VIII. COMMUNICATION RESEARCH
A. MULTIPATH TRANSMISSION
Prof. L. B. Arguimbau E. E. Manna C. K. H. Tsao E. J. Baghdady R. D. Stuart L. S. Tuomenoksa
1. Transatlantic Tests
Because of an accumulation of difficulties, both in technical matters and in coordina-tion, it has been decided to postpone these tests until the fall and winter of 1953.
The receiver proper has been made and tested. The capture ratios are similar to those for the previous receiver. Further work must be done on the trapping, diversity, and waveform-repair circuits.
C. K. H. Tsao, L. S. Tuomenoksa 2. FM Receiver Design
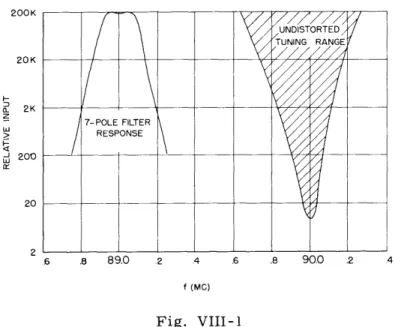
The object of this project is to produce a low-cost high-quality receiver suitable for broadcast reception. One of the chief drawbacks of the domestic receivers which are available at present is that they are difficult to tune, and a slight misadjustment of the tuning control gives rise to a distorted output. There is also trouble on some sets with distortion caused by over-modulation of the transmitter. In unfavorable situations mul-tipath transmission will be present, which will also give rise to distortion. Finally, most receivers are unnecessarily sensitive to interference, a condition that can be remedied by improving the capture ratio and the selectivity.
The multipath effect was the one which gave rise to most of the trouble in the trans-atlantic experiments, and the relay receiver was designed to overcome this difficulty as far as possible. The resulting receiver was not, however, suitable for general use, and so a simplified version was developed. Some of the details have appeared in previ-ous Quarterly Progress Reports, and a complete report has now been prepared. It was realized quite early that this receiver had a rather different tuning characteristic from that of the average FM receiver. In the absence of interference and with a strong signal the tuning is very broad, and undistorted signals can be obtained over a range of 0.5 Mc/sec (see Fig. VIII-1). This curve was obtained by feeding a frequency-modulated wave into the set and varying the tuning of the signal generator. The output was observed on an oscilloscope. The carrier frequencies at which distortion first appeared were taken and plotted as a function of the input signal level. In Fig. VIII-1 the intermediate-frequency response curve is also plotted for a center frequency of 89 Mc/sec. Figure VIII-2 shows the tuning characteristics when two signals are present. One signal is a carrier of 90 Mc/sec frequency-modulated with a 400-cps sine wave and has a fixed amplitude of 20 myv. The other is a carrier of 90. 4 Mc/sec
modu-lated with a 1000-cps sine wave and has a variable amplitude represented by the
-26-200K 20K a- 2K z J 200 20 2 4 f (MC)
Fig. VIII-1
Tuning characteristics and intermediate-frequency response of the simplified receiver.
.4 .6 .8 90.0 .2 .4 .6 .8
f(MG)
Fig. VIII-2
Tuning characteristics of the simplified receiver
with two signals present.
200K UNIT/ E UNDISTORTED 904MC TUNING RANGE /UNDISTORTED /90 MC ,TUNING RANGE / __ /
I
h~T~ F(VIII. COMMUNICATION RESEARCH)
ordinate. The output is again observed on an oscilloscope. An undistorted 400-cps sine wave is obtained in the vicinity of 90 Mc/sec and an undistorted 1000-cps wave in the vicinity of 90. 4 Mc/sec. The range of tuning over which the undistorted signals are obtained is plotted as a function of the amplitude of the variable 90. 4 Mc/sec signal. Investigations have been made to see whether it is possible to incorporate this type of tuning characteristic in a low-cost domestic receiver.
The broad tuning characteristic is obtained because the disciiminator has a linear range of 3 Mc/sec, and so long as the signal level is large enough to operate the limiters, the output is undistorted. Hence, it would seem that the requirements for a good tuning characteristic are a broadband detector and good limiting. These, together with a flat intermediate-frequency response curve, are essentially the requirements for good capture performance.
A commercial FM receiver has been modified to meet these requirements as follows: The intermediate frequency has been adjusted to be flat to within 15 percent over the range +75 kc/sec, and the discriminator which is a conventional Foster-Seeley circuit has been made linear over a frequency range of 1 Mc/sec. This broadens the tuning range as expected (see Fig. VIII-3), but another effect arises. Most domestic receivers do show side responses, but in this receiver they are aggravated. They occur in a region where the detector is still linear and can be quite undistorted. They may, in fact, be mistaken for the correct tuning point. These responses are attributed to the fact that as the signal becomes detuned, it is attenuated more and more by the inter-mediate frequency until, eventually, there is not enough to operate the limiter.
Further-more, at these points the output of the intermediate frequency is a strong
100K 100K 10K -1K -100 10
function of frequency, and so the input to the detector is a small signal con-taining amplitude modulation; the sharper the cut-off of the filter, the larger the amplitude-modulation content. Since the output of the discriminator is directly proportional to the amplitude of the input, we get an output from the detector as a resULL UI the amnpituue modulation on the
input. It should be noted that this effect
89.6 89.8 900 902 904
has nothing to do with the side responses
F(MC/S)
of the discriminator itself. The
simpli-Fig. VIII-3
fied receiver mentioned above gave no
Tuning characteristics of an experimental
trouble in this respect. Unlike
com-model of the low-cost receiver.
mercial ratio detector sets, this one
28-(VIII. COMMUNICATION RESEARCH)
used a fixed bias on the detector. The output of such a detector is independent of the amplitude of the input; so we might expect that there would be no trouble from ampli-tude modulation of the input. However, this statement is obviously subject to some mod-ification; if the input is zero, the output is also zero, and at very low signal levels the output must depend in some way on the amplitude of the input. Hence, the detector becomes sensitive to amplitude modulation. A closer investigation shows that there are side responses on this receiver, but they give no trouble because the gain of the inter-mediate frequency is almost sufficient to make the noise operate the limiters. The signal is lost in the noise before the side responses occur. However, the cost of such an intermediate frequency amplifier is too high for this solution to be used in a low-cost receiver.
As we have already mentioned, the simplified receiver uses a fixed bias on the ratio detector. This arrangement makes the output independent of the signal level. Unfor-unately the drive required, which is proportional to the bias, is constant. As the set is detuned, the input to the detector eventually becomes insufficient and the amplitude influences the output. In practice, the detector curve droops at the two ends. In the conventional circuit the bias is developed from the signal itself. Thus, there is a possi-bility of designing the set so that there is always sufficient drive for the detector. But the ratio detector itself has side responses, and these may be troublesome. When the signal is appreciably detuned, however, the output begins to fall because of the decrease in bias. If the cutoff of the intermediate frequency is sharp enough and the detector wide enough, the output may be negligible before the side response occurs. The design will depend upon the ratio of the strongest to the weakest signals to be received. The output caused by the strongest signal when detuned to the point where the side response occurs, must be no larger than that given by the weakest signal at a center frequency. A pre-liminary investigation has shown that it should be possible to achieve this with a smallest usable signal of 30p.v and a largest of 0. 5 volt without any large increase in the cost of the receiver. The calculated capture ratio would be 0. 7.
(VIII. COMMUNICATION RESEARCH)
B. STATISTICAL THEORY OF COMMUNICATION
Prof. J. B. Wiesner
Prof. W. B. Davenport, Jr.
Prof. R. M. Fano Prof. Y. W. Lee Prof. J. F. Reintjes R. W. Aboudi C. A. Desoer P. E. Green, Jr. A. J. Lephakis R. M. Lerner I. Uygur1.
Information Theory
a. Communication through channels in cascade
This work has been completed and will be presented in Technical Report No. 251.
C. A. Desoer
2.
A Statistical Study of Speech and Music
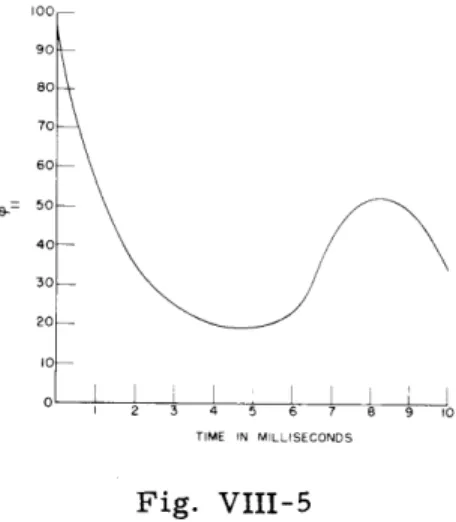
This study was made with the Laboratory's digital and analog correlators. It will be
presented fully in a forthcoming technical report. Some of the results of the study are
presented in the autocorrelation curves shown in Figs. VIII-4 to VIII-11.
The voices of three readers were recorded under the same conditions in the anechoic
chamber of the M. I. T. Acoustics Laboratory. All three subjects read the same page of
a current magazine for the prose, and four of Keats' poems for the poetry reading. One
of them read passages from German and Russian novels. Three-minute samples were
used so that a stationary random process could be approached.
It was of interest to find that the autocorrelation function or its Fourier transform,
the power density spectrum, of speech waves depend more on the reader than on the
language used or the text read.
I. Uygur
TIME IN MILLISECONDS 100 90 80 70 60 50O 40 30 20 10 2345678O TIME IN MILLISECONDSFig. VIII-4
Autocorrelation curve of reader I
reading English poetry.
Fig. VIII-5
Autocorrelation curve of reader I
reading English prose.-30-80 70 60 50 40 I I I I- r i 23 4 5 6 7 8 9 K)0 TIME IN MILLISECONDS
Fig. VIII-6
Autocorrelation curve of reader II
reading English poetry.
-:J
I 2 3 4 5 6 7 8 9 10
TIME IN MILLISECONDS
Fig. VIII-7
Autocorrelation curve of reader II
reading English prose.
I I
I 2 3 4 5 6 7 8 9 10 TIME IN MILLISECONDS
Fig. VIII-8
Autocorrelation curve of reader III
reading English poetry.
30 20 I I I 1 2 3 4 5 6 7 8 9 10 TIME IN MILLISECONDS
Fig. VIII-9
Autocorrelation curve of reader III
reading English prose.
80 70 60 50 40 30 20 I I I I I I I I 2 3 4 5 6 7 8 9 10 TIME IN MILLISECONDS
Fig. VIII-10
Autocorrelation curve of reader III
reading German prose.
I I I 2 3 4 5 6 7 8 9 10
TIME IN MILLISECONDS
Fig. VIII-11
Autocorrelation curve of reader III
reading Russian prose.60 SC 50 =40 3C 20 IC am r70 B n
(VIII. COMMUNICATION RESEARCH)
C. HUMAN COMMUNICATION SYSTEMS
Dr. L. S. Christie J. Macy, Jr. J. B. Flannery Dr. R. D. Luce S. C. Bedard L. N. Lindgren Dr. G. O. Rogge L. M. de Leeuw E. S. Palmer
1. Experiment on Network Change
The design of this experiment has been described in previous reports (1, 2). Statisti-cal tabulation of the questionnaire data by the IBM Center of Analysis and the first lengthy step of extracting attitudinal measures from these tabulations have been com-pleted. The reduction of objective message data to IBM form is nearing completion and IBM processing has begun.
The questionnaire was designed to elicit multiple responses indicating each attitude to be assessed. Since each item in the questionnaire was selected by intuition guided by the results of previous experimentation, it was deemed important to determine whether or not the intent of the questionnaire construction was realized in practice. Accordingly, a series of factor analyses was run. In most cases the intuitive choice of items was vindicated. In those cases where more than one appreciable attitudinal factor appeared, factor scores have been computed.
The influence of change of network or change of network position on the attitudes of the subjects will be evaluated in terms of the improved measures obtained by the analysis referred to above.
L. S. Christie, R. D. Luce, J. Macy, Jr.
2. A Study of Semantic Confusion
An experiment in which semantic ambiguity was introduced in an attempt to make the performance of a task-oriented group unstable was previously reported (3). Sub-sequently, these data were analyzed in terms of "coding noise," and four more groups were run on each of the three networks to examine further the hypotheses suggested by the coding noise analysis. It was found possible to predict group errors and to account for the reduction of errors over trials, but only by making certain plausible assumptions about the noise characteristics of the confusion which occurred. Furthermore, network differences were incompletely explained. This experimental work and the analysis may be found in reference 4.
The approximate character of this analysis was dictated by the nature of the data to which it was applied. A more adequate theory will require better data. Moreover, the original experimental design was unsatisfactory as a study of semantic confusion on several counts: too few groups were run on each network, the stimuli were unstandard and of unequal difficulty, the order of presentation of the stimuli was not balanced, and
-32-(VIII. COMMUNICATION RESEARCH)
it was not possible to make a certain assignment to the stimuli intended either of the sender's descriptions or of the receiver's interpretations of the description. Because of these facts and the importance of semantic confusion in human groups, we are designing a new experiment in this area.
As in the original work, we shall restrict our study to the simple case of nonabstract stimuli. All subjects will have the same set of possible stimuli. (Of course, a far more subtle problem occurs when the confusion in the group concerns abstract ideas.) As before, colors have been selected as stimuli; however, they are standardized colors rather than colored marbles. To reduce the effect of color blindness, we have elected to use a single hue of red with two values of saturation and two of intensity. Those tentatively selected are standard Munsell color papers, chroma R-5, brightnesses 4 and 6, and saturations 6 and 10.
A numerical code, which is different for each subject and changes from trial to trial, is assigned to the stimuli so that the subjects identify (to the experimenter) which color they mean by a given description. A similar technique in recording answers provides
a coding (again for the experimenter only) of what the subjects think a description means. It is felt that these codes should be sufficient to get at the intents and beliefs of the
subjects, the most difficult experimental aspect of this problem.
In the last few days of the quarter, several pilot experiments were run in which the subjects were allowed to draw their descriptions from an assigned vocabulary. The artificial language, which consisted of 10 words, was constructed from the results of a series of tests on individual subjects conducted during the preceding six weeks. The primary guiding principles in its selection were that a given stimulus should generate the selection of two words with about equal frequency and two others with low frequency, and that there should be words of the language used for two different stimuli, but the statistical structure should be invariant under certain relabelings of the stimuli.
No careful analysis of these pilots has been completed, but a few tentative conclu-sions appear warranted. Within the confines of the artificial language, error reduction is not usually complete, and the mechanism of noise reduction by redundancy (found in the original experiment) is severely hampered. When redundancy has occurred, the subjects have commonly gone outside the artificial language. With the present task, which is an information collection task and does not have a single group answer, it appears that much less error reduction can be effected without outside feedback of error than can be effected with this feedback. This is in conformity with part of the proposed explanation of the difference in error reduction in different networks which was given for the original experiment (4).
Further pilots will be carried out before the final design is selected, and it is expected that the experiment itself will be begun in the coming quarter.
(VIII. COMMUNICATION RESEARCH)
3. Some Abstract Properties of Networks
One class of networks which is of interest in communication problems is that in which the distance from one node to any other does not exceed a certain length. For example, a transitive network (transitive binary relation) which is connected is totally connected, and so no distance exceeds 1. This class is trivial, but it provokes the question: Can the condition of transitivity be weakened so that it is interesting and still permits the resulting class to be described ? We shall introduce one possible definition and characterize the class. This class, as we shall show later, is still too restrictive. Definition: A network N is h-transitive if there exists a chain (ab, h)EN, a b; and for
any chain (xy, q)EN, x ? y, q > h + 1 implies (xy)EN; and 1 < q < h implies (xy)4N. For h = 1, this property is the same as transitivity, so we consider only h > 1.
A network is called uniform if every connected subnetwork has degree 1 (see ref. 5). Theorem: If N is h-transitive, h > 1i, connected, and has no chain of length greater than h, N is minimal (see ref. 5). Otherwise, N is either uniform or a circle (which has degree 2).
Corollary: For m > 5, there is no 2-transitive, connected, nonminimal network. Theorem: If N is nonminimal, h-transitive, connected, and not a circle, and includes an arc ab, then N is reducible into two connected networks Na and Nb joined only by
the arc ab. At least one of Na and Nb is h-transitive and nonminimal.
Thus, h-transitive networks except for the circle and h = 1 case are close to, or identical to, minimal networks. Indeed, a nonminimal network N contains as a com-plete subnetwork a minimal network Nl which is h+l-transitive. N is obtained from N1 by inductively introducing a link (ab) if (ab, h+1)E N. This shows that the class of nonminimal h-transitive networks is smaller than, and closely related to, the class of minimal networks; hence our statement that it is still too restrictive. In fact, the h-transitive networks on 5 nodes are the 15 minimal networks, one nonminimal
3-transitive case, the circle network, and the totally connected network.
R. D. Luce References
1. Quarterly Progress Report, Research Laboratory of Electronics, M.I.T. April 15,
1952, p. 62
2. Quarterly Progress Report, Research Laboratory of Electronics, M. I. T. January 15, 1952, p. 56
3. Quarterly Progress Report, Research Laboratory of Electronics, M.I.T. July 15,
1951, pp. 78-81
4. L. S. Christie, R. D. Luce, J. Macy, Jr.: Communication and Learning in Task-Oriented Groups, Technical Report No. 231, Research Laboratory of Electronics, M.I.T. (to be published)
5. Quarterly Progress Report, Research Laboratory of Electronics, M.I. T. July 15,
1952, p. 74
-34-(VIII. COMMUNICATION RESEARCH)
D. REPLACEMENT OF VISUAL SENSE IN TASK OF OBSTACLE AVOIDANCE
Dr. C. M. Witcher L. Washington, Jr.
Tests made during the early part of the past quarter indicated that the step-down detector as it then existed was not sufficiently reliable to be turned over to the Perkins Institution as proposed in the Quarterly Progress Report, October 15, 1952. Two chief sources of the unreliability of the instrument were: (a) its inability to detect step-downs at normal speeds of approach greater than 7 ft/sec, and (b) the necessity for very criti-cal adjustment of the gain of the amplifier to detect step-downs without at the same time obtaining false alarms from poorly reflecting surfaces. Although the original specifi-cations set up for the device contained the figure of 5 ft/sec as a desirable maximum speed of approach, experience showed that if the device could be made to detect at
15 ft/sec or 20 ft/sec, it would be much more useful for such tasks as maintaining a direction of travel parallel to a curb or the edge of a subway platform.
The maximum speed of detection is determined primarily by three things: (a) the pulse repetition frequency of the signal, (b) the time constant of the combination of R13 and C1 2 (see Fig. VIII-12) shunted by the crystal diodes and transformer T1, and (c) the
duration and magnitude of the dip in signal produced by a step-down. The pulse repeti-tion frequency of the signal has now been increased from 15 pps to 60 pps by using a much lighter reflector in the transmitting light source. This reflector is positioned to give the minimum possible moment of inertia. A further scheme for increasing the pulse recurrence frequency has been tried, but is not being used at present. This scheme consisted of splitting the transmitted light beam into two parts by means of a light lucite prism fitted over the mouth of the reflector. If necessary, this method will again be used. The time constant of R1 3 and C1 2 cannot be reduced much more without causing the alarm switching relay (see Fig. VIII-12) to chatter seriously.
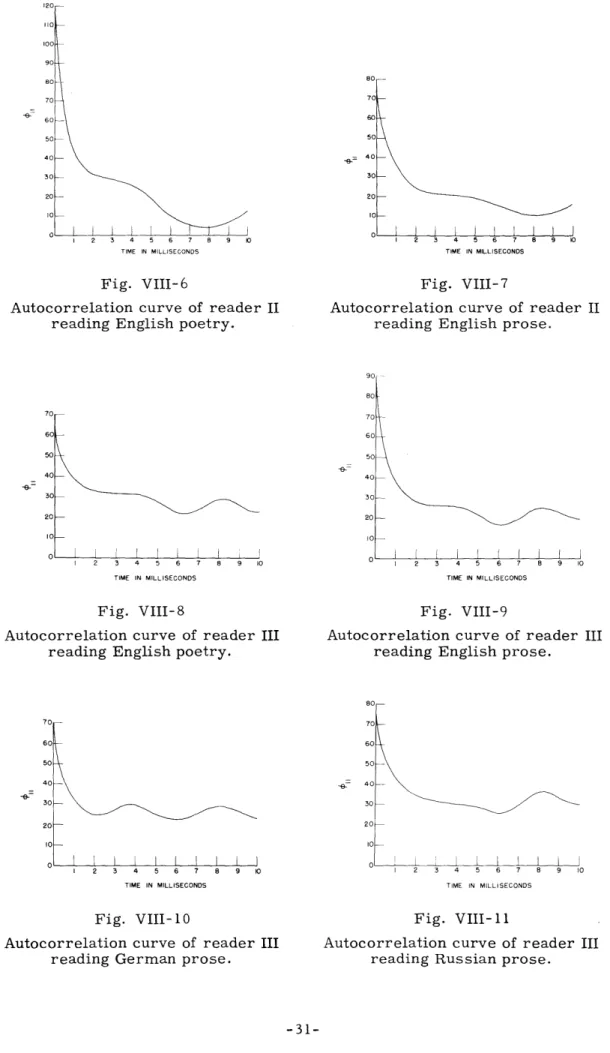
The most promising way to increase speed of detection, and also to avoid the necessity for the critical gain adjustment mentioned above, is to increase the size and duration of the signal dip produced by a step-down. This could be done by using a much higher quality, and hence a much more expensive, receiving lens; or by increasing the vertical distance between light source and receiving lens. It was finally decided to adopt the latter procedure. Accordingly, the detector has been completely redesigned as shown in Figs. VIII-13 and VIII-14. As will be seen, the received light enters the device through the opening in the front of the small triangular housing mounted on top of the main instrument box. After being reflected from a slanting mirror, this light proceeds vertically downward through the receiving lens, coming to a focus at the photo cell as shown. This arrangement has increased the distance between (effective) centers
- - - I
- - - 4
,.---<
®
C~nSOIlKr--fl- _
A'_~"""oar" ~,-A?ev
1\ II ~_~~"'-7 0.0)C,..-=---~_ _~ t---ol .IM.EtiOS<....-_-+ +--<il ,R-11
<?L---4---_
_+_~1'".1
II
I II
I \'",
I
i__
1 - - - _- f - - _I-
_
/-2n R-// '> - - I - - - - f - - - ---.J1
1
t~~:~wc<
IL
_-t-_!-
-l---+
+-
.L++-_r-__
+
-ttll~_O_·/_: r"'~R~~>l-/~.$A'-""" "A'-/5~-/" =~~J-";!
-""'/.06"£1""-""'/c~ ..r~/rr_E.r ~fOOftlt:".~..t_---t_--t_-~,-7 I I..N 0' I Fig. VIII-12 Step-down detector.
Fig. VIII -13
Right view of the redesigned detector.
(VIII. COMMUNICATION RESEARCH)
Fig. VIII-14
Left view of the redesigned detector.
of light source and receiving lens from 5 inches to 8 inches. The amount of
improve-ment in size and duration of the signal dip at a step-down depends, of course, on the height of the step-down, but it should be a substantial improvement in all cases.
The redesigned detector is now being completed. In addition to the feature already
described, it has at least two other features of interest. In the first place, the large
empty space in the upper front section of the box is available for housing the necessary optical and electrical components for obstacle detection when this phase of the travel
problem is reached. In fact, the obstacle detector lens can be mounted in the front wall
of the box, approximately where the step-down detector lens was formerly located. A
further feature of interest is the fact that the switches for the" A" and" B" batteries are
mounted in the handle of the device, so that it is energized when it is lifted and is
(VIII. COMMUNICATION RESEARCH)
E. SPEECH ANALYSIS
*
Prof. M. Halle Carol D. Schatz C. P. Smith
1. Perception of Artificially Combined Speech Sounds
a. Effect of the following vowel on the perception of stop consonants
Experimentation with synthetic speech (Liberman, Delattre, Cooper: The Role of
Selected Stimulus-Variables in the Perception of the Unvoiced Stop Consonants, Am. J. Psych. 65, 497-576, 1952) has indicated that identification of the stop consonants [pJ. [t], and [k] in initial position depends not only upon the characteristic s of the consonantal noise-like burst but also upon the relation of this burst to the vowel which follows it. Thus, in certain cases a burst identified as [k] before one vowel is identified as [pJ
before another vowel. Similarly, in order to elicit like responses before different
vowels, bursts having different characteristics must be used.
The notion that identification of the consonants depends not on the burst alone but on the burst in relation to the following vowel suggests that in actual speech a consonant pronounced before a certain vowel may not be heard as the same consonant if, on a tape recording, it is cut away from this vowel and spliced back before a different vowel; for
example, a
[kJ
recorded in the syllable [kiJ might be heard as a [tJ or [pJ if cut off andspliced back before [a] or [uJ.
1I1111111UIIIIIIHIIIIII
III1IHIl!IIl/llIllIlIlIl
20 MSEC MARKERS
111111"III~"JI""11111
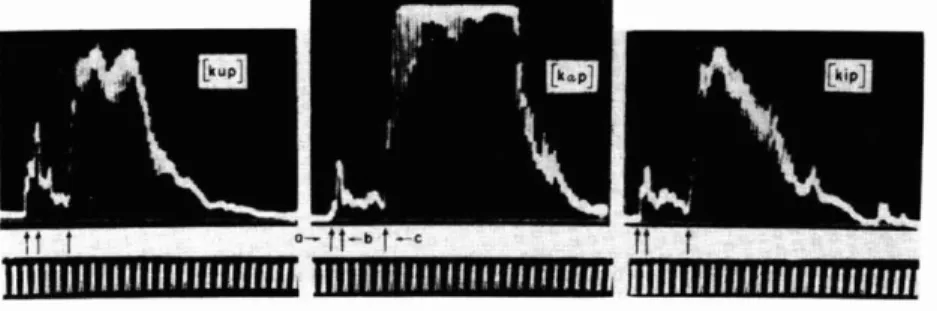
Fig. VIII-IS
Oscillograms showing the burst (a - b) and aspiration (b - c) of [kJ in the words coop, cop, and keep.
Accordingly, the following experiment was carried out. Tape recordings were made
of an American speaker pronouncing the syllables [kiJ, [kaJ, [kuJ, and the vowels [i],
[a], and [ul As shown in Fig. VIII-IS the consonants consist of an initial burst (from
*
Additional support from the Carnegie Foundation and the Rockefeller Foundation.-38-(VIII. COMMUNICATION RESEARCH)
points a to b) followed by a period of aspiration (b to c). The entire consonant (a to c) was cut away from its own vowel and spliced back before the other two vowels. Such a procedure yielded [k] responses from subjects in every case. This can be explained by the fact that vocalic formants present in the aspiration of the [k] are prominent enough for the vowel to be easily identified even when the entire voiced portion of the syllable has been removed and the consonant heard alone (the cut having been made at c). The effect is similar to that of whispered [ki], [ka], and [ku]. When this segment, identifi-able when heard alone, is spliced in before another vowel, [k] is heard, followed first
by its own vowel, w
SYLLA SYLLABLE FROM WHICH BURST IS TAKEN [ki] [ku] [ku]
Fig.
Consonant identific
made up of [k] bur
and
[hu.
the desired impress
away to shorten it
These combinations
hispered, and then by the other vowel, voiced.
If, however, the cut is made at b, and only the initial burst retained, this portion
rBLE WHICH FOLLOWS BURST
of the consonant when played alone gives [hi] [ha] [hu] no indication of the vowel it originally
pre-ceded and is not even identifiable as a [k]. k t p This burst, then, was cut from each syl-p k p lable and spliced back before [i], [a], and k,p p k
[U].
It was found necessary at this pointto reintroduce in some way the aspiration VIII-16 that had been cut away, since the combina-ations in syllables tion, burst plus vowel, sounded unnatural sts plus [hiJ, [ho], to listeners accustomed to aspirated stops.
When the bursts were followed by [hi], [ha], and [hu] instead of the vowels alone, sion of aspiration was produced. The initial portion of the [h] was cut
to 70 msec, approximately the length of the aspiration of a [k].
, burst plus [hi], [ha], and [hu], yielded the results illustrated in Fig. VIII-16.
The bursts were identified by the subjects as [k] when followed by the vowels they originally preceded. In other positions they were identified in four cases as [p], in one
case as [t], and in one case as 50 percent [p] and 50 percent [k]. These data are in full agreement with the data for synthetic speech to which we referred above.
(VIII. COMMUNICATION RESEARCH)
F. TRANSIENT PROBLEMS
Prof. E. A. Guillemin F. Ba Hli E. F. Bolinder
Dr. M. V. Cerrillo Dr. F. M. Reza
1. Study of Convergence Phenomena Associated with the Propagation of Impulses through Finite Networks
In the study of pulse formation by means of linear, lumped-parameter networks, anomalous behavior appeared as a result of convergence phenomena. An investi-gation led to the following notes on the problem of approximation which is encountered when formulating polynomial functions.
Let f(t) be an impulse response of bounded variation and specified time delay. Then
Re F(iw)] = 0 f(t) cos wt dt
is symmetrical about w
=
0 but is otherwise arbitrary. Denoting Re [F(iw)] by R(x), we
see in Fig. VIII-17 that it may assume a variety of forms depending on f(t), and we approximate it by a sum of terms which yield realizable networks and are also standard transforms in order to minimize the computations for the resulting transients.
A0 (x 2 - x2 v=n A x2(
x2 - X2
R(x) e
=NO
01
+
=N v
Ov
x - z)( 2 -2) v= (xn
(
) x -2))where conjugate complex z2's are necessary to ensure the real character of R(x) for x real, and even powers are necessary to provide the symmetry of R(x) about x = 0. The integers N are determined by the requirements on the attenuation of the component curves of the approximating function.
-xot -X04 *XO3 02X R, (X) XoI X0 2 X0 4 Xon (a) Fig. VIII-17
Sample plots of R(x) vs x. R (x) is typical of symmetrical time pulses while RZ(x) is for nonsymmetrical time pulses.
-iv
S =iz
Fig. VIII-18
Relation between the s and z
planes.
Fig. VIII-19
Relationship between the curves of the functions and the locations of their poles: x2/(x2 + 1) and x2/(x2 + 1)2 , with pole at z = il;
x4/(x4 + 4) and x2/(x4 + 4), with poles at z = +1 + il.
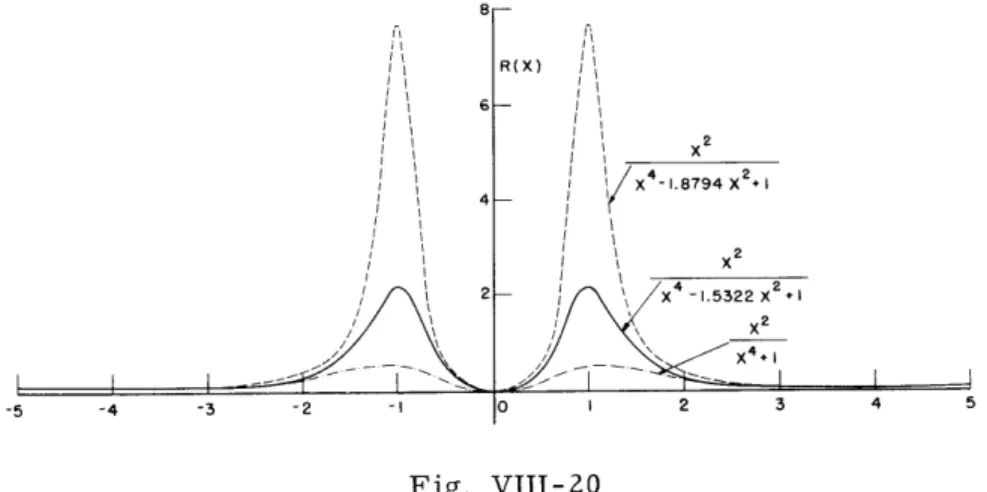
Fig. VIII-20
Relationship between the curves of the functions and the locations
of their poles: x2/(x4 + 1) with poles at z = 1
/450
and
/1350;
x2/(x
4_ 1.5322x
2+ 1) with poles at z = 1/20
and
1/160
0
x2/(x
41. 8794x
2+ 1) with poles at z = 1/10
and 1/1700
(VIII. COMMUNICATION RESEARCH)
-3 -2
R(X)
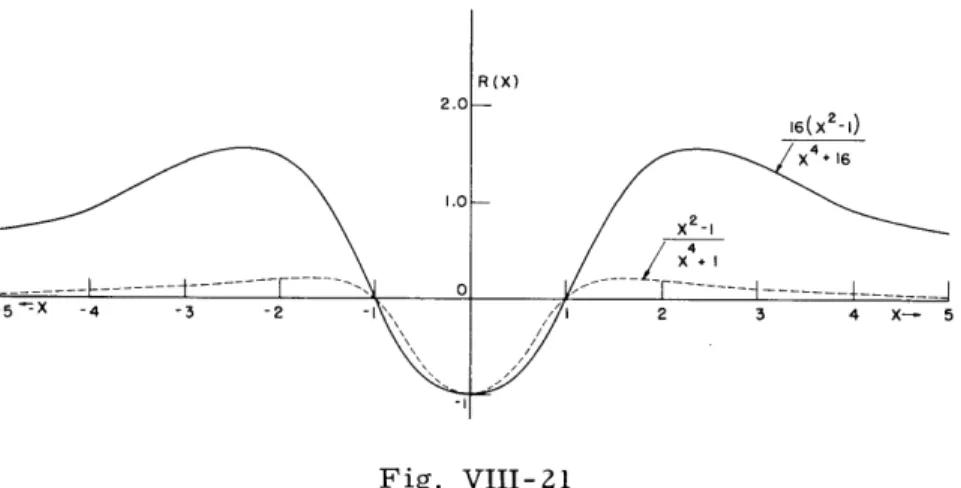
Fig. VIII-21
Relationship between the curves of the functions and the locations of their poles; (x -
l)/(x4
+ 1) with poles at z = 1 /45 and1/135 ; (x2 - 1)/(x4 + 16) with poles at z = 2 /45 and 2/135
0.
This form allows the coefficients A to be calculated easily after the pole locations z in the Z plane have been chosen. The relation between the z plane and the complex fre-quency plane (Fig. VIII-18) follows from the fact that x was written for w in s =
0-
+ iW. The poles may be located by referring to a set of curves of the type shown in Figs. VIII-19, VIII-20, and VIII-21.In the s plane the poles have negative real parts. The network is realizable since the impulse response f(t) satisfies the Basic Existence Theorem 2-2. 2 (Quarterly Progress Report, Jan. 15, 1952, p. 87): The Laplace Transform of f(t) is a transfer function if f(t) is a real, single-valued, bounded function of time which is zero for t < 0, possessing a denumerable set of isolated points of simple discontinuity, and a denumer-able set of isolated points at which f(t) exhibits finite area impulses whose total area is also finite.
F. Ba Hli, M. V. Cerrillo
2. Frequency-Modulation Transients
Work has been continued in connection with some specific problems of the transient response of a network which is excited by a signal whose frequency is a function of time.
There are some basic points in connection with these FM transients which must be clarified, particularly the appropriate formation of the Riemann manifolds and the selec-tion of the appropriate sheet in which the transfer funcselec-tion associated with the signal is defined.
-42-(VIII. COMMUNICATION RESEARCH)
In simple forms of frequency variation, for example, of the form
e(t) = K sin( (at + at )
where K,
Go,
a = constants, and t = time, we have found that some of the results already published in the literature seem to be wrong. Work has been particularly directed to this special case in order to clarify certain important points associated with the network response to this kind of excitation. A technical report on this subject is being prepared. E. F. Bolinder, M. V. Cerrillo3. Introductory Study of the Structure of Passive Networks
Part II
Generation of Impedance Functions Leading to Mutual Coupling
In the synthesis of two-terminal networks following O. Brune's method, one is often confronted by the problem of mutual coupling. In 1949 R. Bott and R. J. Duffin (1) suggested a method which avoids such mutual coupling. Their method is based on a theorem by P. I. Richards (2) which is in turn an application of Schwarz's lemma to positive real functions.
The objects of the present section are: (a) to investigate the nature of a particular class of functions leading to a Brune configuration with mutual coupling; and (b) to derive the basic structure of the Bott and Duffin procedure independently, using physical reasoning and the general concept of "classes of networks" (3).
In the strictest interpretation of the Brune synthesis one first removes the poles and zeros of the impedance function on the imaginary axis until the remainder function no longer has any more of them. One must next remove the smallest value of the real part
of this impedance function for real frequencies. If the numerator of the Re [Z(j) of
the remainder has one or more roots at a finite nonzero real frequency, then the Brune synthesis requires mutual coupling. In such cases, the numerator of the Re Z(j)] , as a function of o , will have one or more positive real roots of even multiplicity. In the present work, "network with mutual coupling" refers to a driving-point impedance function having the last mentioned property.
In order to identify the general class of positive real functions with this property, consider first the special class of driving-point impedances:
Am 1
ZI(S)= Bm + Cn 1/R + 1/[F(s)]
aZ (s) B.Cn OR IMPEDANCES
bZ2(s) OR b REACTANCES
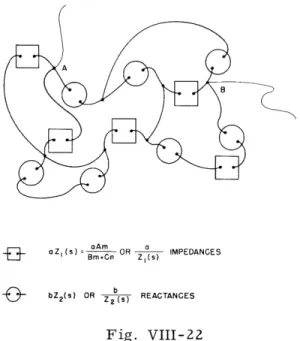
Fig. VIII-22
A general configuration made by the random combination of two particular classes of impedance functions, generating mutual coupling. a is the arbitrary impedance level for each block; b is the arbitrary reactance level for each lossless network.
R+x
Fig. VIII-23
Rx
R+x
General structure of network block Zl(s), generating mutual coupling in the Brune process.
(a) (b) ad = cb ad cb b aZI cZ2 oZ Z2+ b aZI Z2+b aZ + cZ Fig. VIII-24
A basic structure which, in general, cannot be synthesized by the Brune process without mutual coupling.
-44-(VIII. COMMUNICATION RESEARCH)
degree higher than 1; and A, B, and C are positive real constants. ZI(s) can be syn-thesized immediately in the form of a resistance R = A/B in parallel with a reactance F(s) = Am/Cn. Now consider the arbitrary reactance function Z2(s) and its inverse
function 1/[Z 2(s) combined with ZI(s) and 1/[Zl(s) in a random manner, as illustrated
in Fig. VIII-22.
It is now possible to prove that the combination of these two classes of functions generates a network with mutual couplings. In fact, if Z(s) is the driving-point impedance between any two nontrivial modes A and B, one has only to prove that Re Z(O)] has
2
positive
wo
zeros of even multiplicity.Proof: The Re Zl(jc) vanishes at the real frequencies wl' 2' "....' n which are roots of m(s) = 0. Assume a voltage of frequency ol applied to the terminals A and B. Since Z2(s) is lossless, and the cubic blocks of Fig. VIII-22 at such a frequency are
either short-circuited or open-circuited, then there must be no power dissipation. This means that
2
is a root of even multiplicity for Re[Z(j)
. The original characteristic of the network Zl(s) is thus preserved through its block combination with lossless net-works.A formal proof of the converse situation leading to the synthesis of Z(s) is under investigation, but has not been completed. If, however, Z(s) = (ml + nl)/(mZ + n2 ) is a
positive real function representing mutual coupling in the Brune process, Re [Z(jw)] has at least a root of even multiplicity at some real frequency. At such a frequency the network behaves as a pure reactance m1/n 2 or n1/m 2. In general, therefore, one might
suppose that all resistances would appear either in series with a parallel resonant circuit of frequency wl, or bridged across a series resonant circuit of the same fre-quency. Therefore, it might be expected that these resistances would occur as a part of network blocks of special form, as shown in Fig. VIII-23.
Z
1(s)=
R
+x
or
Z(s)
Rx
The size of R and the impedance levels may vary for different blocks but the configura-tions are of the same general structure.
It is interesting to note that the parallel combination of Zl(s) with a reactance, as well as the series combination of I/[Zl(s) with reactances, is generally recognizable in the Brune process without mutual coupling. The removal of poles and zeros on the imaginary axis reveals such configurations except in particular cases of such mixed combinations as are shown in Fig. VIII-24. These are the general structures which cannot be broken down without mutual coupling in the Brune process. Without loss of generality one may let Z(s) = s; one thus recognizes in Fig. VIII-24 the structure used
in the Bott and Duffin procedure.
(VIII. COMMUNICATION RESEARCH)
essentially of a combination of two kinds of functions: Zl(s) and reactances. For the more general case one could readily conceive the possibility of having other networks immediately in series or parallel with Zl(s). The general pattern of the somewhat "localized resistances" will still be retained.
For obvious reasons one might call the function Z(s) = l/[ 1 + F(s)], the generating function for the class of RLC impedances whose Brune configuration represents mutual
coupling.
F. M. Reza
References
1. R. Bott, R. J. Duffin: J. Appl. Phys. 20, 816, 1949 2. P. I. Richards: Duke Math. J. 14, 777-786, 1947
3. F. M. Reza: Quarterly Progress Report, Research Laboratory of Electronics, October 15, 1952, pp. 55-60
-46-(VIII. COMMUNICATION RESEARCH)
G. COMMUNICATIONS BIOPHYSICS
Prof. W. A. Rosenblith K. Putter
1. Anechoic Chamber
Construction of the anechoic chamber has been completed and associated electronic and acoustic equipment is being installed. A description of this facility will be included in the next Quarterly Progress Report.
2. Construction and Testing of the Cherry Correlator
a. Correlator
The plans for this instrument were made available by Dr. E. Colin Cherry of the Imperial College of Science, London, during his stay at the Institute as an exchange professor. After adaptation of the design for American vacuum tubes and delineation of construction details, the instrument was built. The frequency range of the instrument is from 10 cps to 10 kc/sec. An external source of delay (for obtaining time displace-ment of the two signals) is required for the instrudisplace-ment as constructed here. (In the original British instrument, a closed loop of magnetic tape running past two playback heads, separated from one another by a variable distance, provided the delays. ) Con-tinuous multiplication is performed by using the nonlinear characteristics of 6B8 vacuum tubes, and the resulting product is integrated in a long time-constant circuit (maximum integration time 1 minute).
b. Recording apparatus
For part of the investigation, an Ampex telemetering recorder was used. This instrument has two recording channels, with a frequency response of 300 cps to 20, 000 cps. One of the channels has a low-frequency compensator, extending the low-frequency range of that channel to 50 cps.
c. Magnetic drum
Mr. Kenneth Goff of the Acoustics Laboratory has made available for our occasional use his magnetic drum delay system, which consists essentially of magnetic material sprayed onto a revolving drum, with two sets of heads for the two channels: two recording heads, and two reproducing heads, one fixed, the other variable, in angular spacing from the recording heads. Erase heads are provided. The relative delay between the two channels is then dependent on the difference in angular spacing of the two sets of recording and reproducing heads, and the surface velocity of the drum.
Fig. VIII-25
Autocorrelation function of 400-cps sine wave.
3. 1 volts rms; integration time. 13 sec.
Fig. VIII -26
Autocorrelation function of 400 -cps sine wave. 3.1 volts rms; integration time, 60 sec.
I
~
00 I
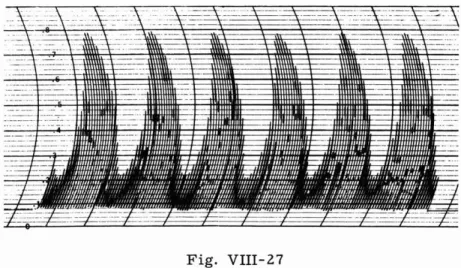
Fig. VIII-27
Autocorrelation function of 400-cps sine wave. 5.0 volts rms; integration time. 12 sec.
(VIII. COMMUNICATION RESEARCH)
Relative delays of -15 msec to +200 msec are obtainable. Because of the arrangement of the heads, the absolute delay in each channel for zero relative delay is about 15 msec. The frequency range is from 100 cps to 10 kc/sec.
d. Tests of the system
The correlator has been tested for performance in the autocorrelation of sine-wave inputs. Four samples of the results obtained with a 400-cps sine wave are shown in Figs. VIII-25 to VIII-27, which represent integration times of 13, 60, 12, and 15 sec
respectively. The results are quite favorable, especially from the standpoint of drift of the long time-constant integrator.
In a pilot experiment this instrument has been used for crosscorrelation of an epi-leptic patient's electroencephalogram with a pulsed flash in order to record the effect of rhythmic photic stimulation of the eyes on the brain potentials. A rhythmic response from the occipital regions of the head was clearly correlated with the flash.
J. S. Barlow and Mary A. B. Brazier