Abstract—This paper presents a COMSOL Multiphysics 2D
axisymmetric model of an pH-ElecFET (pH-sensitive electrochemical field effect transistor) microsensor. This device combines an integrated microelectrode with a pH-sensitive chemical field effect transistor (pH-ChemFET). Thus, by triggering electrolysis phenomena owing to the integrated microelectrode, associated local pH variations in microvolumes are monitored thanks to the pH-ChemFET microdevice. Taking into account (electro) chemical reactions and diffusion phenomena in liquid phase, the proposed model points out the role of the ElecFET geometrical design (microelectrode width w, gate sensitive radius re and distance between the pH-ChemFET
gate and the microelectrode d), as well as polarization parameters, (polarization voltage Vp and time tp), on the
microsensor response. It is first applied to water electrolysis in order to validate pH impulsional variations in microvolume. Then, oxidation of hydrogen peroxide in phosphate buffer (PBS, pH0=7.2) solutions is studied, evidencing the H2O2 potentiometric detection in the [10–100mM] concentration range. This developed model paves new ways for sensor applications, opening several new opportunities for pH-ElecFET devices for H2O2-related enzymatic detection of biomolecules.
Index Terms—Modelling, ElecFET, microelectrode,
pH-ChemFET, water electrolysis, hydrogen peroxide detection.
I. INTRODUCTION
n the last decade, the electrochemical microsensors have received an increasing interest in a wide range of applications such as clinical diagnostics, food analysis, environmental monitoring due to their low cost, simple operation, small size, and rapidity, sensitivity and real-time [1-3]. The electrochemical sensors can be divided into three groups depending on the measured electrical signal [4-6]: amperometric, potentiometric, and conductometric. Even so, the combination of amperometric and potentiometric techniques is a very promising method in terms of detection [7-10]. Diallo et al. have developed an electrochemical field effect transistor (ElecFET) microsensor based on this technique [8, 9]. This device is achieved through the integration of a planar noble metal electrode around the dielectric gate area of a pH-sensitive ChemFET microdevice. By triggering pH-related electrochemical reactions thanks to the microelectrode polarization and by monitoring the
so-N. Aoun and F. Echouchene are with the Laboratory of Electronics and Microelectronics, University of Monastir, 5000, Tunisia (e-mail: nejibaaoun@yahoo.com, frchouchene@yahoo.fr)
A. K. Diallo, J. Launay and Temple-Boyer are with the University of Toulouse, UPS, LAAS, F-31400 Toulouse, France.
H. Belmabrouk is with the Department of Physics, College of Science AlZulfi, Majmaah University, Saudi Arabia.
obtained pH variations thanks to the pH-ChemFET, electrolysis phenomena and pH measurement are closely embedded at the microscale, enabling new electrochemical detection potentialities. Among the ElecFET microdevice applications, the most frequent is the manufacturing of a pH-related enzyme sensor. In this case, the ChemFET detects the pH change resulting from the enzymatic reaction in the membrane that covers the sensor [11]. The output voltage of the ChemFET controls the current flowing through the sensor-actuator system [12]. ElecFET has been successfully used to determine acid or base concentration [13], to form the heart of a carbon dioxide sensor [14] and detect different biomolecules [8, 11].
Various mathematical models of microsensors have been developed and successfully used to study and optimize analytical characteristics of microsensors [15-18].
Meena and Rajendran [15] have derived analytical expressions of concentration and current in order to describe and evaluate the performances of amperometric and potentiometric biosensors using homotopy perturbation method. A numerical study of potentiometric and amperometric electrochemical gas sensors based in a solid-state ion conducting electrolyte has presented by López-Gándaraa et al. [16] in order to optimize the diffuse layers covering one of their catalytic electrodes. The model describes the current-voltage characteristics in the system layer/electrode/electrolyte/electrode. A theoretical study and numerical simulation of potentiometric and amperometric enzyme electrodes and of enzyme reactors have been developed by Morf et al. [17, 18]. The response characteristics of potentiometric and amperometric sensor systems, as well as the product release from enzyme reactors, are analyzed, and the influence of the relevant parameters on the steady-state response is demonstrated and discussed [17].
In this paper, we apply the concept of the combination of amperometric and potentiometric techniques to simulate the ElecFET microdevice detection principles, in order to monitor water (H2O) electrolysis phenomena in a first stage and
hydrogen peroxide (H2O2) electrochemical detection in the
second stage. We then focus on the study of the influences of the main parameters, i.e. (i) polarization voltage Vp and time tp on the integrated microelectrode, (ii) characteristic of the microelectrode width w, (iii) distance between the gate sensitive radius and the integrated microelectrode d and (iv) gate sensitive radius re.
II. PRESENTATIONOFTHESIMULATIONMODEL
The modelling approach used takes into account the different chemical, electrochemical and physical phenomena occurring in the frame of the ElecFET detection principles:
▪ Oxido-reduction on the integrated microelectrode;
Finite-element simulations of the pH-ElecFET
microsensors
N. Aoun, F. Echouchene, A. K. Diallo, J. Launay, P. Temple-Boyer and H. Belmabrouk
▪ Diffusion phenomena;
▪ (H3O+/H2O) and (H2O/OH-) and acid-base analysis of
aqueous solutions at pH0=7.2.
The ElecFET detection properties were thus modeled by studying the diffusion phenomena of the main chemical species in the electrolyte, focusing on the H3O+/OH-
water-based ions, and finally by analyzing the pH detection properties of the silicon nitride Si3N4 ChemFET gate.
A. Geometry of ElecFET: comparison between real and simulated model
Since their fabrication process used silicon-based microtechnologies and therefore photolithography, the real ElecFET microdevices are based on a rectangular concentric geometry [9]. In order to decrease calculation times, the simulated model was simplified by using r-z cylindrical geometry, leading to a 2D axisymmetric geometry (Fig.1).
The geometrical parameters are: the gate sensitive radius re, the distance between the sensitive gate and the electrode d, and w the microelectrode ring width. The depth of the sensitive gate ze is 0.5µm and the height of the modeled geometry is h=300 µm. The standard values of the parameters (re, d, w) are (10µm, 50µm, 100 µm). At the end of the paper these values will be modified in order to enhance the performance of pH-ElecFET. The dimensions of electrolyte domain are indicated in Fig. 1.
B. Modelling of the electrochemical reactions (H2O &H2O2)
The ElecFET concept was initially used for the monitoring of water (H2O) hydrolysis and secondly of the hydrogen
peroxide (H2O2) oxidation in water based solutions: E0: 6H2O 4H3O O2 4e p V (1) E0: 4H2O 4e 2H2 4OH p V (2) 2 3 2 2 2 1 : H O 2H O 2H O 2e O E p V (3)
where E0+, E0−, and E1+ are equilibrium potentials of the
O2/H2O, the H2/H2O and O2/H2O2 redox couple, respectively.
The values of the constants are: E0+= 1.2V, E
0−= −0.8V [9]
and E1+= 0.7V [8].
C. Modelling of the diffusion phenomena in water
Diffusion phenomena of the most influential chemical species, i.e. H3O+ and OH-ions in case of H2O detection and
H3O+, OH- and H2O2 species in case of hydrogen peroxide
detection, into water, have been modeled using the Fick law: i i i i i i R z c r c r r c D t c ) 1 ( 2 2 2 2 (4) where t denotes the time, ci is the concentration of the studied chemical species, Di is its diffusion coefficient and Ri is an additional term accounting for the production/consumption rate of the ion species through a possible chemical reaction. The reaction term can be deduced using the water protolysis reaction:
(
5)
where kf and kb are the forward and backward reaction kinetic rates, respectively.
One can thus express the reaction for the production of proton and hydroxide ions as [19]:
[H O ][OH ]
] OH [ ] O H [ ] O H [ 3 3 2 3 e f f b OH O H K k k k R R (6)where Ke = kb[H20]/kf is the equilibrium constant of water. The forward rate constant kf of the water protolysis reaction is estimated by values taken from literature [20] while the backward rate constants kb is obtained from where Ke denotes the water dissociation constant.
Buffer solution is of great importance in biosensor applications. Experimentally, the buffer concentration could be optimized. So, a lot of experiments have been reported on the buffer properties which enhance the response and the stability of the biosensor [21, 22]. In our kinetic model the chemical effect of the buffer solution was neglected and was not taken into account. In the frame of a kinetic approach, the influences of acid/bases other than the water-based ones are limited by diffusion phenomena (Eq. 4). In another way, we have been interested only on the protonation reaction because, as a solvent, water is in excess in solution. As a result, we can assume that the buffer solution does not have an effect on the biosensor response which can be expressed with the chemical effect modeled with physical equations.
D. Initial and boundary conditions
Boundary conditions are crucial for a correct description of phenomena with partial differential equations. For our model, several important conditions have to be set. The initial condition related to mass transport of species is given by:
h 0 300µm 0 50 0 ; , 10 0 ; , 10 0 ; , 2 2 0 0 3 O H pH pKe OH pH O H z r mM t z r c t z r c t z r c (7)
Fig. 1.Cross-section on the ElecFET device in r–z cylindrical coordinates.
k
fk
bOn the axis of symmetry, the boundary condition reads: 0 ) , 0 ( t ,z r r ci (8)
At the upper interface of the electrolyte (z=h) and the lower interface (z=0 or ze), the interface is assumed to be impermeable: 0 = ) 0 (r,z=h or or z,t z c e i (9) In order to do not disturb the diffusion phenomena operating from the surface of the microelectrode, the outer surface of the device is assumed to be at a constant concentration: ) , , 300 ( i,0 i r µm z t c c (10)
An oxido-reduction reaction takes place at the electrode for t<tp. Thus, the boundary condition reads:
w ; = ) ( , d r r d r i F N t t , z=z r, z c D j e e j j i p e i i (11) where Nj is the number of electron transferred for reaction “j”, i,j is the stoichiometric coefficient, F is Faraday’s constant and tp is the polarization time. ij denotes the current density given from the kinetic equations for the electrochemical reactions at the electrode surface based on the Butler–Volmer expression[23]:
i i j j c j qi ref i i j j a j pi ref i i ref j j RT F c c RT F c c i i ) exp( ) exp( , , , , , , ; 0 (12)where i0j,ref is the exchange current density due to reaction “j” at the reference concentrations in A/cm2,c
i is the concentration of species “i” adjacent to the surface of electrode in mol/cm3,
ci,ref is the reference concentration of species “i” in mol/cm3, αaj is the anodic transfer coefficient for reaction “j”, αc,j is the cathodic transfer coefficient for reaction “j”, pi, j=i,j is the anodic reaction order of species “i” in reaction “j”, qi, j=-i,j is the cathodic reaction order of species “i” in reaction “j”, R is the gas constant, T is the temperature and ηj is the overpotential of reaction “j” in volts (V), and it is measured with respect to a reference electrode of a given kind in a solution at the reference concentrations.
The overpotential for electrochemical reaction “j”, (η) in Eq. 12 is given by: j p
V
0, j
-
E
(13)where Vp is the applied potential surface in V, E0,j is the
equilibrium potential for reaction “j”.
Total current is obtained by numerical integration of the local current density over the entire ElecFET area. It is given by:
A jdA i t I )( (14)where A is the surface area of the electrode. E. Numerical method
The governing equations with initial and boundary conditions are solved numerically using the finite element software COMSOL Multiphysics 4.3b [24]. An electroanalysis module has been chosen for solving the mass transport of diluted species in electrolytes using the diffusion equation.
The overall computational domain is discretized using an unstructured triangular mesh Fig.2. It is noticed that the region nearby the reaction surface is refined with a better mesh quality.
For the time discretization we have employed First-order backward differentiation formula (BDF), with the time steps controlled by the numerical solver during the computations. Total current, given by Eq. (14), is performed using a fourth order integration method.
III. RESULTS AND DISCUSSION
To describe the pH-ChemFET response, we can use the threshold voltage variation. The pH-ElecFET threshold voltage variation is related to the pH at the silicon nitride Si3N4 surface according to the following equation [20]:
) pH -) (pH(0, s ) (t V0 0 t pzc VT T (15)
where pH(0,t) is the pH at the Si3N4 sensitive surface when
the diffusion phenomena "steady state" is reached and VT0 is a constant parameter depending on the SiO2/Si3N4
pH-ChemFET technology [25], pHpzcis the point zero of charge
which is estimated around 4 for Si3N4 [23, 26]). In the
following, since the VT0 value is only related to the pH-ChemFET technological fabrication, it is of no influence concerning the ElecFET detection properties and it will not be taken into account, i.e. it will be chosen equal to zero [27, 28]. s0 is an ideal sensitivity of ISFET based pH sensor when pH is
measured by the means of Nernst potential given by the following equation [29]: pH / 2 . 59 ) 10 ln( s0 mV q kT (16)
where k=1.38×10⁻²³J/K is the Boltzmann constant, T=300K is temperature and q=1.6×10⁻¹⁹C the elementary charge.
A. Mesh sensitivity
To ensure that the convergence has been obtained and the numerical results are independent of the mesh size,
Fig. 3 shows the pH local at z=150 μm of the electrolyte for several mesh grids. There was no significant difference between the curves obtained using these grids (6818, 13643, 27719, 53534 elements) and we may conclude that the numerical convergence has been reached with all the grids. In the results section, all simulations were done with a total elements number 13645 [30, 31].
B. Study of the most influential parameters
The kinetic parameters and the constants used in this simulation are listed in Table I and Table II [9, 32, 33]. ElecFET detection/transduction principles were first studied for water electrolysis monitoring H2O in aqueous solutions
(pH0=7.2). Then, the ElecFET detection properties were tested
for the hydrogen peroxide H2O2 also in aqueous solutions
(pH0=7.2) solutions containing different stabilized
concentrations [H2O2] ranging from 10 to 100mM because of
their properties in terms of activity, stability and cost.
According to theoretical equations, the most influential parameters are the polarization voltage Vp, the time of polarization tp, the concentration [H2O2], the distance between
the gate sensitive radius and the microelectrode (parameter d), the surface of the microelectrode (associated with the parameter w) and gate sensitive radius (parameter re).
All series of simulation have been devoted to modelling the sensor response, i.e. the dependence of the threshold voltage versus time. The curves of this threshold voltage, measured at pH0=7.2, are shown in Figs.4-9.
Case1: water electrolysis monitoring:
Before testing the sensor performance for the H2O2
detection, one should ensure that the sensor is able to provide a response in the case of water electrolysis.
Fig. 4 presents the temporal evolution of the threshold voltage VT in the case of H2O redox phenomena for different
polarization voltages while maintaining a constant the polarization time (tp = 5s). Since Vp is positive (respectively negative), oxidation (respectively reduction) of H2O takes
place near the platinum microelectrode.
Therefore, a production of hydronium H3O+ (respectively
hydroxide OH-) ions, so for a local pH changes sharply and
finally the threshold voltage VT increases (respectively
decreases). In this case, phenomena occur at higher than 1.2V (positive polarization) and/or lower than -0.8V (negative polarization) polarization voltages Vp according to the associated equilibrium potential values E0+ and E
1+.
Fig. 4.Temporal variations of the pH–ChemFET threshold voltage for different polarization voltages.
TABLEII
PHYSICO-CHEMICAL INPUT VALUES USED IN THE SIMULATION MODEL
Parameter Value Unit
F 96352 C/mol DH30+ 9.3×10⁻⁹ m2/s DOH- 5.3×10⁻⁹ m2/s DH2O2 3.1×10⁻¹⁰ m2/s cH3O+,ref 10-pH0 mol/L cOH
-,ref 10pKe-pH0 mol/L
cH2O2,ref 50×10-3 mol/L pH0 7.2 kf 1.5×10¹¹ L/mol/s Ke 1×10-14 mol2/L2 0 200 400 600 800 1000 1200 -350 -300 -250 -200 -150 -100 -50 0 50 polarization time: 5s Thre sho ld vo lta g e (m V) Time (s) -0.9V -0.95V -1V 1,35V 1,3V 1,4V TABLEI
PARAMETERS USED IN THE SIMULATIONS
Reaction 1 Reaction 2 Reaction 3
i0j,ref (A/m2) 1.115×10⁻⁶ 10-6 9.64×10⁻⁶ E0,j(V) 1.2 -0.8 0.7 αa,j 0.5 0.5 0.5 αc,j 0.5 0.5 0.5 H3O+ +1 +1 OH- +1 H2O2 -1 Nj 4 4 2
Fig. 3. pH at z = 150 μm of the electrolyte for several mesh grids.
0 50 100 150 200 250 300 5,4 5,6 5,8 6,0 6,2 6,4 6,6 6,8 7,0 7,2 7,4 pH r (µm) 3569 elements 6818 elements 13643 elements 27719 elements 53534 elements
The amplitude of the peak is so much greater than the value of the applied potential increases. When the polarization is interrupted, the ElecFET microsensor response follows a return to equilibrium of the system because of the diffusion laws.
Subsequently, the influence of polarization time tp was studied. Fig. 5 illustrates the temporal variations threshold voltage for different polarization times (tp = 5, 10, 10 and3 s) for two values of the polarization voltage on the integrated microelectrode (Vp = 1.4 or -1V). In agreement with the Equation (11), the polarization time increase is responsible for a local pH decrease and therefore a pH-ChemFET threshold voltage increases (Eq. 15). Nevertheless, threshold voltage variations are lower and tend to reach saturation. Fig. 4 and Fig. 5 show clearly that the microsensor has a response in the case of water electrolysis. Therefore, we can continue our analysis and assess the performance of the sensor for H2O2
detection.
Case2: hydrogen peroxide detection:
The ElecFET concept was studied by taking into account the H2O2 oxidation on the integrated microelectrode.
According to the oxidation reaction (Eq.3), in presence of hydrogen peroxide H2O2, a positive polarization Vp on the platinum microelectrode produces hydronium H3O+ions.
Therefore, the local pH decreases around the sensitive area of the microsensor and finally the threshold voltage VT increases.
For this purpose, the polarization voltage Vp was chosen less than 𝐸0+to avoid any interference with water hydrolysis.Since
the 𝐸1+ is roughly equal to 0.7V, a similar polarization voltage
Vp was applied on the platinum microelectrode at the different polarization times (tp = 5, 10, 15, 20, 30, 40 and 60s) while keeping constant [H2O2] concentration at 50mM in a solution
of pH0=7.2, with a constant polarization voltage (Fig. 6). VT
tends toward increasingly positive values (i.e local pH decreases). As previously for the water electrolysis, the amplitude of the peaks increases with tp. The maximum threshold voltage increases steeply over a short period of time and thereafter reaches a plateau value. It is clear that the
influence of polarization time appears only in transient state. The equilibrium state is reached for tp=10s.
In the same way, Fig. 7 represents the H2O2-ElecFET
response as a function of time for different polarization voltages Vp. This figure has been obtained with [H2O2] =
50mM in a solution of pH0=7.2 and tp = 30s.
We found that the asymptotic value of threshold voltage is essentially linearly related to the polarization voltage Vp. As soon as the polarization is interrupted, the ElecFET microsensor response tends to turn to back equilibrium of the system because of diffusion phenomenon.In the case of hydrogen peroxide detection, the Butler-Volmer theory emphasizes on the influence of the [H2O2] concentration of
H3O+ ion production kinetics (Eq. 3).
Fig. 8 shows temporal variations of the pH-ChemFET threshold voltage for different H2O2 concentrations.
Simulation results prove that the amplitude of the threshold voltage increases with the [H2O2] concentration in solution,
and saturates for the highest values. This saturation
Fig. 7.Temporal variations of the pH–ChemFET threshold voltage for the different polarization voltages at [H2O2] =50mM, tp=30s, d=50µm,
w=100µm and re=10µm and (inset) ElecFET response Vp.
Fig. 6.Temporal variations of the pH–ChemFET threshold voltage for the different polarization times at [H2O2] =50 mM, Vp =0.7V, d=50µm,
w=100µm and re=10µm and (inset) ElecFET response versus tp.
-100 0 100 200 300 400 500 600 700 -200 -150 -100 -50 0 50 0,70 0,75 0,80 0,85 0,90 -0,20 -0,15 -0,10 -0,05 0,00 0,05 V sat(V)T Vp(V) Vsat T=0.99Vp-0.86 T hres hold vol tage ( m V ) Time (s) 0.7 0.75 0.8 0.85 0.9V
Fig. 5.Temporal variations of the pH–ChemFET threshold voltage for different polarization times.
0 200 400 600 800 1000 -195 -190 -185 -180 -175 -170 -165 0 10 20 30 40 50 -190 -185 -180 -175 -170 -165 Th re sh ol d vo lta ge (m V ) tp(s) 50 40 30 25 15 5 10 4 3 2 1 T hres hold vol tage ( m V ) Time (s) 0.1 0 200 400 600 800 1000 1200 -350 -300 -250 -200 -150 -100 -50 0 50 T h re sh o ld v o lt a g e ( mV) Time (s) positive polarization: +1,4V negative polarization: -1V 5s 10s 20s 30s 5s 10s 30s 20s
phenomenon is related to the previously discussed ElecFET detection principles [33].
Fig. 8 inset presents the evolution of the asymptotic threshold voltage 𝑉𝑇𝑆𝑎𝑡versus the concentration [H
2O2] and at
Vp=0.7V and tp=30s. As illustrated in Fig. 8 inset, the simulation shows a linear response through a large range of [H2O2] concentration, as well as a very insensitive behavior.
The influence of the microelectrode positions, the surface of the microelectrode and the gate sensitive radius on the terms were also simulated.
The results of these simulations are shown in Fig. 8. It is worth noting that in Fig. 9, each of the three curves includes the results of simulations for Vp= 0.7 V, tp = 30s and [H2O2] =
50mM.
In Fig. 9a, the change of the threshold voltage is imposed by the variation of the microelectrode width (w), from 50 to 200 µm with a step of 50µm. In this case, the maximal variation 𝑉𝑇𝑆𝑎𝑡 was increased during the simulation of this stage. Far
from the microelectrode (d = 20, 50, 80, 100 and 150 µm), once hydronium ions are created, they take longtime to diffuse into the solution causing a reduction in their number at very large distances leading to low response of the sensor as illustrated in Fig. 9b.
Finally, Fig. 9c shows the threshold voltage variation with time at various gate sensitive radius (re =5, 10, 15, 20 and 25µm). When the gate sensitive radius increases, the 𝑉𝑇𝑆𝑎𝑡
value also decreases slightly. This proves that the ElecFET detection principles depend mainly on the spatial integration of both microelectrode and pH-ChemFET microdevices. C. Comparison with experimental results
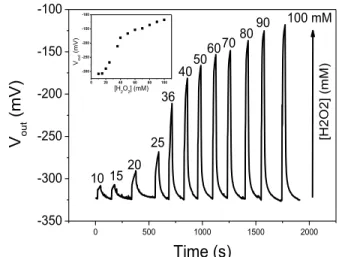
This section presents a comparative study of experimental results and those obtained by simulation (Fig.8) in the case of hydrogen peroxide detection. It is worth noting that our ChemFET-meter measurement interface was used to measure the pH-ChemFET gate-source voltage VGS, also called output
voltage Vout, enabling the local pH monitoring in the
microelectrode surroundings depending on the polarization conditions. Vout shift provides an identical threshold voltage
shift and therefore thinking in term of Vout or threshold voltage
is the same.
Fig.10 shows the evolution of the output voltage versus time at various [H2O2] concentrations, while inset represents
the maximum of Vout versus [H2O2] concentrations. We can
see that the curve of sensor response for experimental studies shows similar shape as in theoretical studies. As the [H2O2]
concentrations increases, the sensor response increases too, with Vout shifted towards positive values.
Our numerical results show that the amplitude of the impulsional voltage variations increases with the [H2O2]
concentration in solution, and saturates for the highest values. This saturation phenomenon is related to the ElecFET detection principles as previously mentioned: in the presence of hydrogen peroxide, a positive bias on the platinum microelectrode produces hydronium H3O+ ions. Therefore the
local pH decreases and finally the pH-ChemFET-meter output voltage Vout increases. When the [H2O2] concentration
increases, the H3O+ ions production also increases.
Nevertheless, the H3O+ ion increase is limited by diffusion and
electromigration phenomena, leading to a new chemical equilibrium at the microscale. Hydrogen peroxide H2O2
potentiometric detection was finally demonstrated in the [10-100mM] range.
Theresponse from our simulation is not in the same range of the value obtained from the experience. This is due to the effect of the buffer properties. Indeed, Chong et al. have shown that when concentration of the PBS solution decreases, the ionic strength of the PBS solution also decreases causing
Fig. 9.Temporal variations of the pH–ChemFET threshold voltage for various: (a) surface of the microelectrode at d=50µm and re=10µm (b)
positions of the microelectrode at w=100µm and re=10µm, and (c) gate
sensitive radius at d=50µm and w=100µm and to all at Vp=0.7V, tp=30 s,
[H2O2] =50 mM.
Fig. 8.Temporal variations of the pH –ChemFET threshold voltage for the different H2O2 concentrations at 0.7V, tp=30s, d=50µm, w=100µm and
re=10µm and (inset) H2O2 response of the ElecFET microdevice (Vp =0.7V)
0 100 200 300 400 500 600 -190 -180 -170 -160 -150 -100 0 100 200 300 400 500 600 700 800 -190 -180 -170 -160 -150 -100 0 100 200 300 400 500 600 700 800 -190 -180 -170 -160 -150 T hres hold vol tage ( m V ) 50 100 150 200µm (a) 20 50 80 100 150µm (b) Time (s) 5 10 15 20 25µm (c) 0 500 1000 1500 2000 -190 -180 -170 -160 -150 0 20 40 60 80 100 -190 -185 -180 -175 -170 -165 -160 -155 -150 100 mM 90 80 70 60 40 30 25 20 15 T hres hold V ol tage ( m V ) Time (s) 10 50 T h re sh ol d vol tage ( m V ) [H 2O2] (mM)
the drain current Id to decrease. The dependence of the Id to the pH value of the testing pH buffer solutions is related to the variation of the threshold voltage [34]. In the future work, we intend to take into account the effect of the buffer.
IV. CONCLUSION
In this study, we have investigated the modelling of the ElecFET microdevice, taking into account the mass transport for different species, electrochemical reactions on the microelectrode and acid/basic reactions for couples (H3O+/H2O) and (H2O/OH-). The pH-ElecFET techniques
were used for monitoring the water-based electrolysis by pH-ChemFET and extended to the hydrogen peroxide in order to obtain the threshold voltage (i.e local pH) variation. The influence of the ElecFET geometrical design, i.e. characteristic width of the microelectrode w, gate sensitive radius re and distance between the gate sensitive radius and the microelectrode d, as well as polarization parameters, i.e. polarization voltage Vp and time tp, on its response behavior was studied. So, the obtaining of pH impulsional variations in microvolumes was clarified and the potentiometric detection of hydrogen peroxide H2O2 was evidenced in the [10–100mM]
concentration range. In the near future, we intend to model the ElecFET device for the enzymatic detection of lactate and glucose in cylindrical coordinates.
REFERENCES
[1] S. A. Zaidi, J. H. Shin, “Recent developments in nanostructure based electrochemical glucose sensors,” Talanta, vol. 149, pp. 30–42, 2016. [2] S. Chaiyo, E. Mehmeti, K. Zagar, W. Siangproh, O. Chailapakul, K. Kalcher, “Electrochemical sensors for the simultaneous determination of zinc, cadmium and lead using a Nafion/ionic liquid/graphene composite modified screen-printed carbon electrode,” Analytica Chimica Acta, 2016 (in press). [3] A. A. Vasiliev, A. V. Pisliakov, A. V. Sokolov, N. N. Samotaev, S. A. Soloviev, K. Oblov, V. Guarnieri, L. Lorenzelli, J. Brunelli, A. Maglione, A. S. Lipilin , A. Mozalev, A. V. Legin, “Non-silicon MEMS platforms for gas sensors”, Sensors and Actuators B 224 (2016) 700–713.
[4] A. Safavi; Z. Shojaeifard; M. Tohidi, “Fabrication of an Amperometric Sensor for Hydroxylamine Based on Silver Paste Nanocomposite Electrode,” IEEE Sensors Journal, Vol. 14, pp. 839-846, 2014.
[5] S. M. Sayyah; M. Shaban; M. Rabia, “A High-Sensitivity Potentiometric Mercuric Ion Sensor Based on m-Toluidine Films,” IEEE Sensors Journal, vol. 16, pp. 1541-1548, 2016.
[6] Y. Chen; S. C. Mun; J. Kim, “A Wide Range Conductometric pH Sensor Made With Titanium Dioxide / Multiwall Carbon Nanotube /Cellulose Hybrid Nanocomposite,” IEEE Sensors Journal, vol. 13, pp. 4157-4162, 2013. [7] G. Alberti, F. Cherubini, R. Palombari, “Potentiometric and amperometric gas sensors based on the protonic conduction of layered zirconium phosphates and phosphonates,” Sensors and Actuators B, vol. 24, pp. 270-272, 1995. [8] A.K. Diallo, L. Djeghlaf, J. Launay, P.Temple-Boyer, “Development of pH-based ElecFET biosensors for lactate ion detection”, Biosensors and Bioelectronics, vol.40, pp.291-296, 2013.
[9] A. K. Diallo, L. Djeghlaf, L. Mazenq, J. Launay, W. Sant, P. Temple-Boyer,“Modelling of impulsional pH variations using ChemFET-based microdevices: application to hydrogen peroxide detection,” Sensors, vol. 14, pp. 3267-3283, 2014.
[10] Y. Ouyang, X. Wang, G. Yu, Z. Song, X. Zhang, “Performance of Amperometric and Potentiometric Hydrogen Sensors,” J. Mater. Sci. Technol., vol. 30, pp. 1160-1165, 2014.
[11] B.H.van der Schoot, P.Bergveld, Biosensors, vol. 2, pp. 161-186, 1988. [12] J. Luo, W. Olthuis, B. H. van der Schott, P. Bergveld, M. Bos, W. E. van der Linden, “Modelling of the migration effect occuring at an ISFET-based coulometric sensor-actuator system,” Anal.Chim. Acta, vol. 237, pp. 71-81, 1990.
[13] W. Olthuis, B.H.van der Schoot, F.Chavez, P.Bergveld, Sensors Actuators, vol.17, pp. 279, 1989.
[14] B.H. van der Schoot, P.Bergveld, Sensors Actuarors, Vol.13, pp. 251, 1988.
[15] A. Meena, L. Rajendran, “Mathematical modeling of amperometric and potentiometric biosensors and system of non-linear equations-Homotopy perturbation approach,” Journal of Electroanalytical Chemistry, vol. 644, pp. 50-59, 2010.
[16] C. López-Gándaraa, M. Blanes, J.M. Fernández-Sanjuána, F.M. Ramosa, A. Cirera, “Modeling and optimization of diffusive layers in potentiometric and amperometric electrochemical gas sensors,” Procedia Engineering, vol. 47, pp. 1295-1298, 2012.
[17] W.E. Morf, P.D. van der Wal, E. Pretsch, N.F. de Rooij, “Theoretical treatment and numerical simulation of potentiometric and amperometric enzyme electrodes and of enzyme reactors Part 1: Steady-state concentration profiles, fluxes, and responses,” Journal of Electroanalytical Chemistry, vol. 657, pp. 1-12, 2011.
[18] W. E. Morf, P.D. van der Wal, E. Pretsch, N.F. de Rooij, “Theoretical treatment and numerical simulation of potentiometric and amperometric enzyme electrodes and of enzyme reactors. Part 2: Time-dependent concentration profiles, fluxes, and responses,” Journal of Electroanalytical Chemistry, vol. 657, pp. 13-22, 2011.
[19] G. Pardon, W. van der Wijngaart, “Modeling and simulation of electrostatically gated nanochannels”, Advances in Colloid and Interface Science, vol. 199, pp. 78-94, 2013.
[20] M. Moritsuka, Y. Kitasako, MF. Burrow, M. Ikeda, J. Tagami,“The pH change after HCl titration into resting and stimulated saliva for a buffering capacity test,” Australian Dental Journal, vol. 51, pp. 170-174, 2006. [21] K. Saeedfar, L. Y. Heng, T. L. Ling and M. Rezayi, “Potentiometric Urea Biosensor Based on an Immobilised Fullerene-Urease Bio-Conjugate,” Sensors, vol. 13, pp. 16851-16866, 2013.
[22] M. Alqasaimeh, L. Y. Heng, M. Ahmad, A. S. Santhana Raj and T. L. Ling, “A Large Response Range Reflectometric Urea Biosensor Made from Silica-Gel Nanoparticles,” Sensors, vol. 14, pp. 13186-13209, 2014. [23] P. Temple-Boyer, J. launay, I. Humenyuk, T. Do Conto, A. Martinez, C. Bériet, A. Grisel, “Study of front side connected chemical field effect transistor for water analysis,” Microelectron. Reliability, vol. 44, pp.443-447, 2004.
[24] Comsol multiphysics finite element analysis software, http://www.comsol.com.
[25] L. Bousse, N. De Rooij, P. Bergveld, “Operation of chemically sensitive field effect sensors as a function of the insulator-electrolyte interface,” IEEE Trans. Electron Devices, vol. 30, pp.1263-1270, 1983.
[26] A. Poghossian, “Determination of the pHpzc of insulators surface from capacitance-voltage characteristics of MIS and EIS structures,” Sens. Actuators B, vol. 44, pp. 551-553, 1997.
[27] P. Temple-Boyer, J. Le Gal, M.L. Pourciel-Gouzy, W. Sant, A. Martinez, “Modelling of EnFETs for the creatinine detection,” Sensors and Actuators B, vol. 118, pp. 47-52, 2006.
[28] W. Sant, P. Temple-Boyer, E. Chanié, J. Launay, A. Martinez,“On-line monitoring of urea using enzymatic field effect transistors,” Sensors and Actuators B, vol. 160, pp.59-64, 2011.
Fig. 10. Detection of impulsional pH variations related to the H2O2 electrolysis in phosphate buffer solutions: influence of the H2O2 concentration and (inset) ElecFET response for the H2O2 detection.
0 500 1000 1500 2000 -350 -300 -250 -200 -150 -100 0 20 40 60 80 100 -300 -250 -200 -150 -100 Vout ( m V) [H2O2] (mM) 90 80 70 60 50 [H 2 O 2 ] (m M ) 100 mM 40 36 25 20 15 10 V out (mV) Time (s)
[29] Z. Dong, U.C. Wejiny, I.H. Elhajj, “Fabrication and testing of ISFET based pH sensors for microliter target solutions,” Sensors and Actuators A, vol. 194, pp. 181–187, 2013.
[30] M. Selmi, F. Echouchene, M. H. Gazzah, and H. Belmabrouk, “Flow Confinement Enhancement of Heterogeneous Immunoassays in Microfluidics,” IEEE SENSORS JOURNAL, vol. 15, no. 12, 2015.
[31] Nitesh Nama, Rune Barnkob, Zhangming Mao, Christian J. Kähler, Francesco Costanzo, and Tony Jun Huang, “Numerical study of acoustophoretic motion of particles in a PDMS microchannel driven by surface acoustic waves,” Lab on a Chip, vol. 15, pp. 2700-2709, 2015 [32] A.J. Bard, L.R. Faulkner, “Electrochemical methods: fundamental and applications”, second edition, New York: John Wiley & Sons, Inc., 2001. [33] W. J. Moore, “Basic Physical Chemistry,” Prentice-Hall International Editions, London, 1983.
[34] Chong Soon Weng, U. Hashim, Wei-Wen Liu, “The Effect of Phosphate Buffer Solution (PBS) Concentration on the Ion Sensitive Field-Effect Transistor (ISFET) Detection”, RSM2013 Proc., Langkawi, Malaysia, 2013.
Nejiba Aoun was born in Tunisia, 1984. She received his Master’s Degree in Materials, Nano-structures, Device and Micro-electronics System from the Faculty of Science of Monastir, Tunisia in 2011. She is now a Ph.D. student at the laboratory of electronics and microelectronics, department of Physics, Faculty of science of Monastir. His research interests are modelling and simulation of microsensors.
Fraj Echouchene was born in Tunisia, 1978. He received Master and Ph.D. degree in Physical department from Monastir University in 2006 and 2011, respectively. In september 2012, he joined the Department of Physics at Gafsa University, Tunisia where he is assistant professor now. His research interests are modelling and simulation of microfluidic sensors, cavitation flow and heat transfer.
Hafedh Belmabrouk received the Ph.D. degree in laser Doppler velocimetry from the Ecole Centrale de Lyon, France, in 1992. He currently supervises a team of about 20 researchers in the field of nonlinear optics, biosensor and microfluidics, and heat transfer
Abdou Karim Dialo was born on April 14, 1977. He received his Master’s Degree in Microelectronics from Louis Pasteur University of Strasbourg, France in 2005. He joined the Lyon Institute of Nanotechnologies, France in 2005 and received the Ph.D. degree from the Ecole Centrale of Lyon in 2008. He was a postdoctoral fellow at the French "Université de la Méditerranée" (France) in the French "Centre Interdisciplinaire des Nanosciences de Marseille" (France) where he worked on organic transistor devices in 2009, and joined the French "Laboratoire d'Analyse et d'Architecture des Systèmes" ofthe French "Centre National de la Recherche Scientifique (LAAS-CNRS) as a postdoctoralfellow in 2010. He is working on the development of ChemFET-based microsensors for chemical and biochemical detections.
Jérôme Launay was born on March 1975. He received the Engineer Degree in electronic engineering from the French "Institut National des Sciences Appliquées de Toulouse" (INSAT-France) in 1998. He joined the French "Laboratoired'Analyseetd'Architecture des Systèmes" from the French "Centre National de la RechercheScientifique" (LAAS-CNRS) in 1998 and received the Ph.D. degree from the French "Institut National des Sciences Appliquées de Toulouse" (INSAT-France) in 2001. In 2002, he became lecturer at the French "Université Paul Sabatier de Toulouse" (France). His research activities include the development of chemical microsensors for the detection in liquid phase.
Pierre Temple–Boyer was born was born on October 25, 1966. He received his Engineer Degree in electronic engineering from the Ecole Supérieure d'Electricité (Paris -France) in 1990 and his Master Degree in microelectronics from the French "Université Paul Sabatier de Toulouse" (France) in 1992. He joined the French "Laboratoire d'Analyse et d'Architecture des Systèmes" of the French "Centre National de la Recherche Scientifique" (LAAS-CNRS) in 1992 and received the Ph.D. degree from the French "Institut National des Sciences Appliquées de Toulouse" (France) in 1995. Since then, as a senior researcher, he has been working on the development of micro-and nanotechnologies.


![Fig. 6.Temporal variations of the pH–ChemFET threshold voltage for the different polarization times at [H 2 O 2 ] =50 mM, V p =0.7V, d=50µm, w=100µm and r e =10µm and (inset) ElecFET response versus t p](https://thumb-eu.123doks.com/thumbv2/123doknet/14426613.514332/5.918.475.822.690.958/temporal-variations-chemfet-threshold-different-polarization-elecfet-response.webp)