HAL Id: hal-02955255
https://hal.ehesp.fr/hal-02955255
Submitted on 1 Oct 2020
HAL is a multi-disciplinary open access archive for the deposit and dissemination of sci-entific research documents, whether they are pub-lished or not. The documents may come from teaching and research institutions in France or abroad, or from public or private research centers.
L’archive ouverte pluridisciplinaire HAL, est destinée au dépôt et à la diffusion de documents scientifiques de niveau recherche, publiés ou non, émanant des établissements d’enseignement et de recherche français ou étrangers, des laboratoires publics ou privés.
Distributed under a Creative Commons Attribution| 4.0 International License
Comparison of growth models to describe growth from
birth to 6 years in a Beninese cohort of children with
repeated measurements
Shukrullah Ahmadi, Florence Bodeau-Livinec, Roméo Zoumenou, André
Garcia, David Courtin, Jules Alao, Nadine Fievet, Michel Cot, Achille
Massougbodji, Jérémie Botton
To cite this version:
Shukrullah Ahmadi, Florence Bodeau-Livinec, Roméo Zoumenou, André Garcia, David Courtin, et al.. Comparison of growth models to describe growth from birth to 6 years in a Beninese cohort of children with repeated measurements. BMJ Open, BMJ Publishing Group, 2020, 10 (9), pp.e035785. �10.1136/bmjopen-2019-035785�. �hal-02955255�
Comparison of growth models to
describe growth from birth to 6 years in
a Beninese cohort of children with
repeated measurements
Shukrullah Ahmadi ,1 Florence Bodeau- Livinec,1,2 Roméo Zoumenou,3
André Garcia,4 David Courtin,4 Jules Alao,5 Nadine Fievet,4 Michel Cot,4
Achille Massougbodji,6 Jérémie Botton 7
To cite: Ahmadi S, Bodeau- Livinec F, Zoumenou R, et al. Comparison of growth models to describe growth from birth to 6 years in a Beninese cohort of children with repeated measurements. BMJ Open 2020;10:e035785. doi:10.1136/ bmjopen-2019-035785
►Prepublication history and additional material for this paper are available online. To view these files, please visit the journal online (http:// dx. doi. org/ 10. 1136/ bmjopen- 2019- 035785).
Received 15 November 2019 Revised 30 June 2020 Accepted 03 July 2020
For numbered affiliations see end of article.
Correspondence to
Shukrullah Ahmadi; shukrullah. ahmadi@ inserm. fr © Author(s) (or their employer(s)) 2020. Re- use permitted under CC BY. Published by BMJ.
ABSTRACT
Objective To select a growth model that best describes
individual growth trajectories of children and to present some growth characteristics of this population.
Settings Participants were selected from a prospective
cohort conducted in three health centres (Allada, Sekou and Attogon) in a semirural region of Benin, sub- Saharan Africa.
Participants Children aged 0 to 6 years were recruited
in a cohort study with at least two valid height and weight measurements included (n=961).
Primary and secondary outcome measures This study
compared the goodness- of- fit of three structural growth models (Jenss- Bayley, Reed and a newly adapted version of the Gompertz growth model) on longitudinal weight and height growth data of boys and girls. The goodness- of- fit of the models was assessed using residual distribution over age and compared with the Akaike Information Criterion (AIC) and Bayesian Information Criterion (BIC). The best- fitting model allowed estimating mean weight and height growth trajectories, individual growth and growth velocities. Underweight, stunting and wasting were also estimated at age 6 years.
Results The three models were able to fit well both
weight and height data. The Jenss- Bayley model presented the best fit for weight and height, both in boys and girls. Mean height growth trajectories were identical in shape and direction for boys and girls while the mean weight growth curve of girls fell slightly below the curve of boys after neonatal life. Finally, 35%, 27.7% and 8% of boys; and 34%, 38.4% and 4% of girls were estimated to be underweight, wasted and stunted at age 6 years, respectively.
Conclusion The growth parameters of the best- fitting
Jenss- Bayley model can be used to describe growth trajectories and study their determinants.
INTRODUCTION
Insufficient growth during childhood adversely affects later health outcomes. According to estimates from the Global Burden of Diseases, Injuries and Risk Factors study 2016,1 the prevalence of stunting,
wasting and underweight (based on the defini-tions using the WHO 2006 growth standards) in children under 5 years were, respectively, 36.6%, 8.6% and 19.5% in sub- Saharan Africa (SSA) in 2015. Furthermore, more than 23% of under-5 mortality was attributable to child growth failure, being thus the second leading risk factor for child mortality in this region.
Mathematical growth modelling is a powerful tool for the study of child growth and growth trajectories. It consists of fitting models to physical growth data (eg, weight, length/height and head circumference) to obtain an appropriate growth curve that will conveniently summarise growth information provided by weight and height measurements of children, even from irregularly spaced growth measurements.2 Clinicians routinely
compare growth data to growth charts to identify impaired growth trajectories in chil-dren. Indeed, looking at growth trajectories (weight, height/length or body mass index) has gained importance for several purposes. It is becoming essential for surveillance to identify abnormal growth trajectories.3 In
the postnatal period, length/height and weight surveillance is an essential tool for
Strengths and limitations of this study
► This is the first study to assess the comparative merits of growth models on child anthropometric data in a semirural setting in sub- Saharan Africa with a high prevalence of undernutrition.
► The generalisability of these results cannot be guar-anteed because the study sample is not representa-tive of Beninese children.
► Other models could have been tested but the over-all fit of the selected models was very optimal and they present advantages for future studies in this population.
Publiqu Unite Documentation Multimedia. Protected by copyright.
on October 1, 2020 at Ecole des Hautes Etudes en Sante
Open access
monitoring child growth. It is also used in research to study determinants of growth, including identification of modifiable risk factors and sensitive age periods during which interventions may be especially useful to achieve optimal growth.4 Characterising growth trajectories is
also important to study whether past growth is associated with future growth patterns or later health outcomes.5
There are several structural and non- structural growth models to describe child growth, among them are the Jenss- Bayley model,6 the Reed model278 and the
Gompertz functions.9 These three models are among
the most common structural models described in the literature, while non- structural models are mainly poly-nomial and splines,10–13 as cited in Chirwa et al (2014).14
The parameters of structural models have a biological basis. In contrast, non- structural models do not formu-late any particular form of growth curve and may demon-strate instability at extremities. Besides, the parameters obtained from non- structural models do not provide any biological interpretation.12 15
Many studies have analysed child growth data in Africa, but few studies8 13 14 16–19 have applied structural or non-
structural growth models on African longitudinal growth data. Very few of these studies8 14 have assessed the
comparative merits of models like the Jenss- Bayley and Gompertz on child growth in SSA. Furthermore, as to our knowledge, no study has compared the goodness- of- fit of the adapted Gompertz growth model on child growth data.
This study aimed to compare the fit of three structural growth models (the Jenss- Bayley model, the Reed model and a new model which is an adaptation of the Gompertz model) applied to weight and height growth data in a population of Beninese children aged 0 to 6 years, living in a semirural region, and to describe their growth using the selected model.
METHODOLOGY
Study design and data sources
Weight and height measurements were available from a prospective cohort study of Beninese children followed from birth to age 6 years. These children who partic-ipated were born within the MiPPAD (Malaria in Preg-nancy Preventive Alternative Drugs) clinical trial (NCT00811421) and followed in three ancillary studies, the APEC (Anaemia in pregnancy: etiology and conse-quences), TOLIMMUNPAL and TOVI studies, and finally assessed in the EXPLORE study at 6 years, on average. The research objectives, design, sample size and follow- up period varied for these studies.
Participating children were born of HIV- negative mothers (n=1182) enrolled in the MiPPAD clinical trial in 2011 in the district of Allada, south Benin.20 The MiPPAD
trial, which enrolled pregnant women before 28 weeks of gestation at the first antenatal care visit, compared the effi-cacy of two intermittent preventive treatments for malaria in pregnancy (IPTp). Height and weight of children were
assessed at birth and women were requested to bring their infants to the health centre when the babies were aged 1 month, and also 9 and 12 months. Children included in our analyses met the following inclusion criteria: being born within the MiPPAD clinical trial, and assessed at least twice with valid anthropometric measurements (weight and height) between birth and age 6 years within MiPPAD, APEC, TOLIMMUNPAL, TOVI or EXPLORE studies.
Within this (MiPPAD) cohort, a subsample of 400 chil-dren was followed more closely. These chilchil-dren were followed from birth to age 2 years in the APEC21 and
TOLIMMUNPAL studies.22 The APEC study included
the first 400 offspring born within the MiPPAD study including anthropometric measurements of children at 6 and 9 months. Infants assessed in the APEC study were also followed up in the TOLIMMUNPAL study between birth and 24 months, with further anthropometric measurements at 15, 18, 21 and 24 months.
The TOVI study followed up 747 singleton 1- year- old children born within MiPPAD. Among these children, only 92 children randomly selected were assessed between 3 and 5 years for anthropometric measurements.23 Finally,
the children were assessed within the EXPLORE study at age 6 years on average for anthropometric measurements (2016 to 2018).24 25 Online supplementary figure 1 shows
participants inclusion and how different ancillary studies are embedded in this cohort.
Appropriate participant consent and ethics approval were obtained for the different studies included.
Patient and public involvement
Patients and the public were not directly involved in the planning of this study. Results will be communicated to participants via community meetings with local leaders.
Anthropometric measurement
Measurements were performed by trained staff at each visit, with children wearing light clothes only and no shoes. From birth up to around age 2 years, children’s length was measured to the nearest 1 mm using a locally manufactured wooden measuring scale according to the WHO guidelines.26 From birth up to age 2 years, weight
was measured using an electronic baby scale (Seca type 354) with a precision of 10 g. From age 2 years onward, standing weight and height was measured for all children. Height was measured by a locally manufactured length board. The length board comprised of a measuring board mounted to the wall with an attached measuring tape and movable right angle headpiece. Weight was measured using an analogue scale (Camry DT602). At age 6 years, children were weighed with the Tanita scale.
Data inclusion
Participants with at least two weight or height measure-ments anytime between birth and age 6 years were included in the analysis. Weight- for- age z- scores (WAZ) and height- for- age z- scores (HAZ) were calculated based
Publiqu Unite Documentation Multimedia. Protected by copyright.
on October 1, 2020 at Ecole des Hautes Etudes en Sante
http://bmjopen.bmj.com/
on the WHO growth standards.27 To identify outliers, as
the distribution of the z- scores was shifted to the left, the distribution was corrected by centring it to the mean. Then measurements with centred WAZ or HAZ greater than +4 or less than −4 were considered outliers for growth and were systematically excluded from the analysis. Addition-ally, individual weight and height profiles were plotted to visually check individual growth trajectories for plau-sibility. 65 height (out of 5291 measures) and 35 weight observations (out of 5291 measures) were excluded. They were considered as outliers on the descriptive graph even after the systematic removal of observations with WAZ or HAZ greater than +4 or less than −4. The final analyses had 961 participants (461 boys and 500 girls). The number of children with anthropometric measure-ments at different age intervals is presented in the online supplementary table 1.
Growth models
The following three structural growth models were compared: the Jenss- Bayley model, the Reed model and a new model which is an adaptation of the Gompertz model. These models are presented in the equations 1, 3 and 4, where E (yij) is the expected value (weight or length of child i at jth occasion, t
ij is age in days, Ai, Bi, Ci and Di are the parameters of the functions for the ith
child.
The Jenss- Bayley model6 is presented in equation 1 and
as another parameterisation in equation 2. Briefly, a or expA is the predicted value at birth (t=0); b or exp–B is the
asymptotic slope or growth rate from about 2 years onward; d or exp–D allows for decelerating growth (decreasing
exponential function) during infancy. The parameter c or expC can reflect the degree of catch- up growth. These
four parameters or model coefficients can be obtained for each individual—thanks to a mixed- effects modelling approach—and represent the global individual growth trajectory. Parameters (or a combination of them, eg, the velocity) can then be studied in association with the determinants of growth or other independent variables.28
E(yij) = ai+ bi· tij− (expci+di.tij) (1)
E(yij) = expAi+ exp−Bi.tij+ expCi.(1 − exp−exp−Di.tij) (2)
The Gompertz model29 (equation 3 with Di=0) is a
three- parameter model commonly used to model human growth and development.30 31 Parameter Ai represents the
upper asymptote (maximum value), Ci represents growth
rate and Bi is related to weight at birth (t=0). The Gompertz
model theoretically approaches a null asymptote at later ages and to better represent the positive linear growth between about 3 and 6 years, the Gompertz growth func-tion9 31 was expanded by adding a fourth parameter Di
on height and weight modelling. This adaptation allows the model to have a non- flat asymptote (slope=velocity different from 0). This permits to fit the linear part of the growth at the later ages in our data (constant linear growth velocity). The model is non- linear in the model parameters.
E(yij) = Ai.exp(−Bi.exp(Ci.tij)) + Di.tij (3)
In the Reed model,7 parameter B
i is the asymptotic
slope or growth rate/velocity of preschool growth, Ci is an important component of rapid early childhood growth2 32
and models the exponential growth deceleration, Di is used to better model early life variations in growth, and Ai is the intercept. The model is as follows:
E(yij)= Ai+ Bi.tij+ Ci.ln(tij+ 1)+Dtiji (4)
Statistical methods
The Jenss- Bayley model, the Reed model and the adapted Gompertz model were applied to weight and height growth data of children from birth to age 6 years.
The Reed fixed- effects model was fit using the lm (linear model) function in R,33 and the Jenss and
Gompertz models using the nls (non- linear least squares) function in R33 to obtain initial values more easily.28 Then
the models were fitted to weight and height data using the SAEMIX34 package in R-3.5.1 software33 as applied in
another study.28 Due to convergence issues with
unstruc-tured matrices, a diagonal variance- covariance matrix was selected for random effects.
Growth trajectories of the children were estimated using a recently proposed method described elsewhere.28
Briefly, weight and height growth trajectories and growth velocities (first derivative of the equation) was estimated using the model presenting the best fit (the Jenss- Bayley model). Fixed- effect parameters (A, B, C and D) obtained from the mixed- effects model using SAEMIX package were used to represent average growth trajectories. The Jenss- Bayley model then allowed predicting individual weight and height by substituting the individual model parameters into their corresponding model equation (equation 2). Similarly, individual growth velocities were calculated by substituting determined individual param-eters into the derivative of the Jenss- Bayley model. As a derivative of the Jenss- Bayley model, the following equa-tion can be used to estimate growth velocity over time.28
dy
dt = exp−Bi+ expCi−Di−exp −Di.tij
(5) Finally, undernutrition (underweight, stunting and wasting) of children was estimated at age 6 years using predicted data by the best- fitting model. Children with WAZ <−2 were classified as underweight, those with HAZ <−2 as stunted, and those with weight- for- height- z- score <−2 were classified as wasted.27
Comparison of goodness-of-fit
The three non- nested models were compared using the Akaike Information Criterion (AIC), delta AIC and Bayesian Information Criterion (BIC). Lower AIC and BIC values indicate a better fit. The delta AIC35 for a
candi-date model, is the difference between the AIC values of the best and the candidate models. This difference (delta AIC) is then used to determine the amount of support for each candidate model. If the delta AIC is <2, there is
Publiqu Unite Documentation Multimedia. Protected by copyright.
on October 1, 2020 at Ecole des Hautes Etudes en Sante
Open access
substantial evidence to support the candidate model (ie, the candidate model is almost as best performing as the best model). If the delta AIC is between 4 and 7, there is considerably less support for the candidate model to be the best model. Finally, if the delta AIC is >10, there is essentially no support for the candidate model to be better than the best model. Additionally, residuals of the models were estimated by subtracting observed measure-ments (weight and height) from the model- predicted ones. The distribution of the residuals of the models was plotted against age. The residual SD (RSD) for each model was also reported.
RESULTS
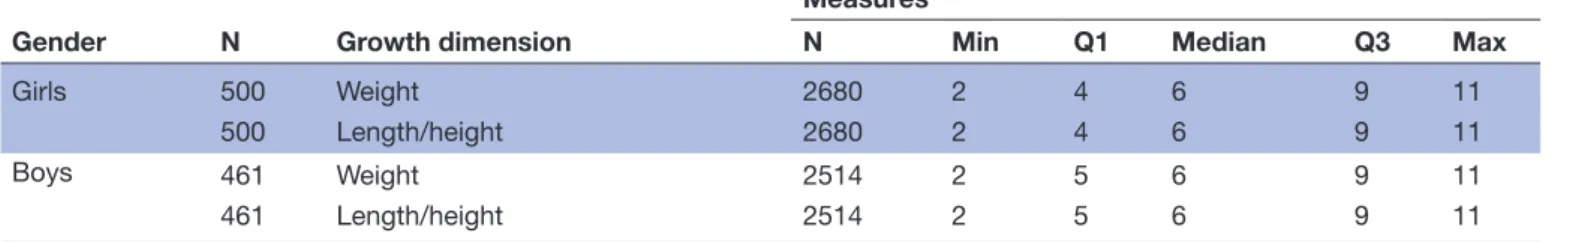
Three models were fitted to weight and height growth data of 961 children from birth to age 6 years separately for boys and girls (table 1). Children had between two and 11 weight and height measurements (table 1), and
75% of girls had at least four measurements (five in boys). Some descriptive characteristics of the study popu-lation are presented in online supplementary table 2. The overall mean maternal age at age 1 year of the study child was 25.8 years (SD 5.6). Almost three- fourth of all mothers could not read or write at the start of the cohort. Almost 10% of mothers were underweight before their pregnancy. Almost 10% of boys and 14% of girls had a lower birth weight (<2.5 kg) and less than 7% of children were born preterm. Almost 10% of children had malaria at 1 year of age and almost 74% of boys and 67% of girls had anaemia at 1 year of age.
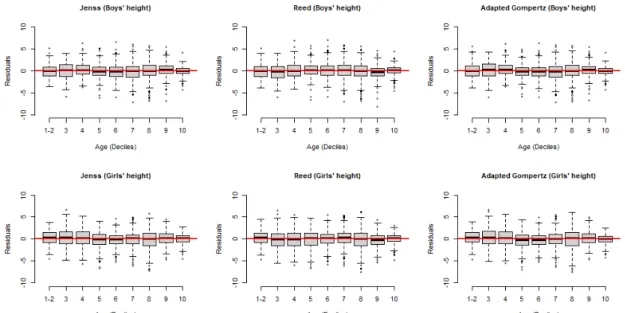
The distribution of the residuals over age for weight and height of both boys and girls showed that, overall, residuals were centred around zero for all ages and there was no strong dependence of residual distribution over ages for all the models (figures 1 and 2).
Table 1 Number of anthropometric measures per child and sex
Gender N Growth dimension
Measures
N Min Q1 Median Q3 Max
Girls 500 Weight 2680 2 4 6 9 11
500 Length/height 2680 2 4 6 9 11
Boys 461 Weight 2514 2 5 6 9 11
461 Length/height 2514 2 5 6 9 11
Max, maximum; Min, minimum; N, total number of measurements; Q1, first quartile; Q3, third quartile.
Figure 1 Residuals of weight models for boys and girls (data of the first two deciles was gathered, as there were more than 10% of the data at birth).
Publiqu Unite Documentation Multimedia. Protected by copyright.
on October 1, 2020 at Ecole des Hautes Etudes en Sante
http://bmjopen.bmj.com/
For weight models, the Jenss- Bayley model had the lowest AIC and BIC values, both in boys and girls, indi-cating a better fit than the two other candidate models (table 2). Both the Reed and the adapted Gompertz model had high delta AIC values for both boys (136 and 117, respectively) and girls (129 and 135, respec-tively), indicating essentially no support for these two candidate model to be better than the best- fitting model (Jenss- Bayley).
For height models, the Jenss- Bayley model and the adapted Gompertz model had the lowest AIC and BIC values for the height model in boys while the Jenss- Bayley model had lower AIC values in girls than the Reed and adapted Gompertz model. Concerning delta AIC values, both the Reed and the adapted Gompertz model had values <10 for boys (8 and 6, respectively), indicating considerably less support for these two models to be the best- fitting model. While in girls, these two candidate models had delta AIC values >10 (28 and
32, respectively), which does not indicate any support for these two models to have a better fit than the Jenss- Bayley model.
Using the Jenss- Bayley model, weight and height were calculated for all the children at age points, particularly when they were not measured, as well as instantaneous growth velocities at different age points, and growth trajectories were calculated (tables 3 and 4, and figure 3, respectively).
Means and SD of parameters estimates of the Jenss- Bayley model along with two other candidate models (the adapted Gompertz model and the Reed model) fitted to weight and height of boys and girls are reported in online supplementary table 3.
Nutritional status for all children was estimated at age 6 years. About one- third of the children were wasted and underweight (online supplementary table 4). While 8% of boys and 4% of girls were stunted (online supplementary table 4). In comparison, in the WHO growth reference
Figure 2 Residuals of height models for boys and girls (data of the first two deciles was gathered, as there were more than 10% of the data at birth).
Table 2 Comparison of the goodness- of- fit of the three candidate models
Model
Boys Girls
RSD AIC BIC Delta AIC Log- likelihood RSD AIC BIC Delta AIC Log- likelihood
Weight Jenss- Bayley 0.46 5251 5300 −2613 0.46 5452 5503 −2714 Reed 0.52 5387 5424 136 −2684 0.51 5581 5619 129 −2781 Adapted Gompertz 0.49 5368 5405 117 −2675 0.49 5587 5625 135 −2784 Length/height Jenss- Bayley 1.90 11 786 11 823 −5884 2.00 12 711 12 749 −6347 Reed 2.00 11 794 11 831 08 −5888 2.10 12 739 12 777 28 −6360 Adapted Gompertz 1.95 11 792 11 829 06 −5887 2.10 12 743 12 781 32 −6362
AIC, Akaike information criterion; BIC, Bayesian information criterion; RSD, residual SD.
Publiqu Unite Documentation Multimedia. Protected by copyright.
on October 1, 2020 at Ecole des Hautes Etudes en Sante
Open access
population, the percentage of children under −2 z- scores is expected to be 2.3%.
DISCUSSION
Three growth models (the Jenss, the Reed and an adap-tation of the Gompertz model) were fitted to the weight and height of children from birth to age 6 years and their performance was compared. There was no strong trend in the residual distribution of the models over age, suggesting that all the models performed well without systematic underestimation or overestimation of growth at any age. Comparison of AIC/BIC values and RSD supported the conclusion that the Jenss- Bayley model had the best fit. Also, the difference between the AIC (delta AIC) of the Jenss- Bayley model (best model) and other two candidate models demonstrated quantifiable evidence that the Jenss- Bayley model was the best one fitting on weight and height both for girls and boys.35
Therefore, the Jenss- Bayley model was chosen to estimate mean growth trajectories and instantaneous growth veloc-ities of children, and estimated their nutritional status at age 6 years.
This paper extends the previous limited studies that either fitted the Jenss- Bayley model or compared its goodness- of- fit with other growth models in childhood in SSA. Pagazey and Hauspie16 successfully fitted the
Jenss- Bayley model on Congolese babies weight data. However, the phase of growth studied in this study was restricted from around birth to age 2 years. Similarly, few studies reported Reed model fitted well. Simondon and colleagues8 compared several models on the growth data
of 95 Congolese children and reported that the Reed model had a better fit, but this study did not include the Jenss- Bayley and the adapted Gompertz models and studied child growth only during infancy. Chirwa and colleagues14 also reported that the Reed model fitted well on the growth data from birth to age 10 years in 453 chil-dren living in an urban setting in South Africa. The study reported that the Jenss- Bayley model did not fit well in the early years. However, this study included children only from an urban setting and did not test the performance of the Gompertz model. In summary, the above previous studies from SSA8 14 16 either tested growth models during
a limited phase of growth in early childhood or studied children only from an urban setting. The current study differs from the aforementioned studies in some respects. First, it included growth data of both infancy and early childhood. Second, it included children from a semirural setting which have not been studied before very well in SSA. Third, the growth data used in this study were taken from a prospective study which had standardised measurements of weight and height; therefore, it is likely to be more accurate than data from routine surveys or health records. A limitation of this study is lesser measure-ments between age 3 and 5 years, but as during this period weight and height are known to increase linearly with age, the impact on the obtained growth modelling parameters is likely to be less. Another limitation of this study is the generalisability of the results. These children lived in a semirural setting with a high prevalence of undernutri-tion. They also presented a high prevalence of potential risk factors for altered growth36 (online supplementary
table 2). It is therefore possible that their growth would differ from a setting with different characteristics.
The estimated instantaneous growth velocities reflected the overall expected pattern of growth velocity in children that is, a maximum during the earliest age then a decrease until age 2 years and a constant velocity afterwards, as also reported in other population of children,10 37 although
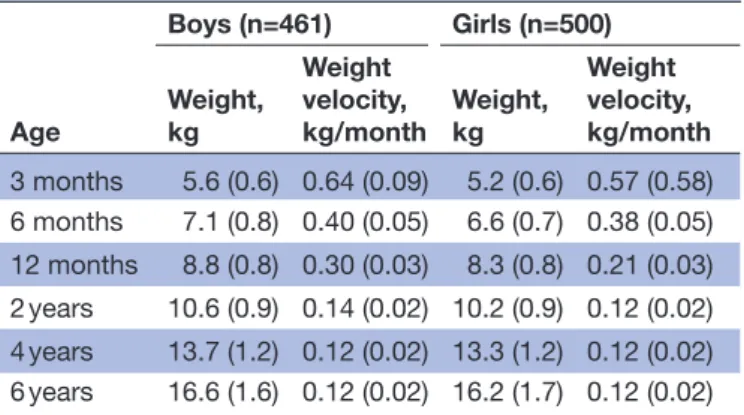
Table 3 Estimated weight and weight growth velocity (SD) of girls and boys aged 0 to 6 years, from the Jenss- Bayley model Age Boys (n=461) Girls (n=500) Weight, kg Weight velocity, kg/month Weight, kg Weight velocity, kg/month 3 months 5.6 (0.6) 0.64 (0.09) 5.2 (0.6) 0.57 (0.58) 6 months 7.1 (0.8) 0.40 (0.05) 6.6 (0.7) 0.38 (0.05) 12 months 8.8 (0.8) 0.30 (0.03) 8.3 (0.8) 0.21 (0.03) 2 years 10.6 (0.9) 0.14 (0.02) 10.2 (0.9) 0.12 (0.02) 4 years 13.7 (1.2) 0.12 (0.02) 13.3 (1.2) 0.12 (0.02) 6 years 16.6 (1.6) 0.12 (0.02) 16.2 (1.7) 0.12 (0.02)
Table 4 Estimated length/height and length/height growth velocity (SD) of girls and boys aged 0 to 6 years, from the Jenss- Bayley model Age Boys (n=461) Girls (n=500) Length/height, cm Length/height velocity, cm/month Length/height, cm Length/height velocity, cm/month 3 months 59.9 (1.4) 2.67 (0.10) 58.6 (1.4) 2.55 (0.16) 6 months 66.3 (2.8) 1.66 (0.06) 64.8 (3.0) 1.66 (0.08) 12 months 73.4 (2.9) 0.91 (0.06) 72.1 (1.9) 0.92 (0.06) 2 years 82.6 (3.3) 0.63 (0.05) 80.9 (2.1) 0.65 (0.04) 4 years 96.6 (3.0) 0.61 (0.05) 95.9 (2.9) 0.62 (0.04) 6 years 111.24 (4.1) 0.61 (0.05) 110.7 (3.7) 0.62 (0.04)
Publiqu Unite Documentation Multimedia. Protected by copyright.
on October 1, 2020 at Ecole des Hautes Etudes en Sante
http://bmjopen.bmj.com/
growth rate could differ depending on the population, for example, weight velocity among boys at age 3 years (mean±SD): 0.19±0.06 kg/month in American chil-dren37 versus 0.16±0.04 kg/month in French children10
and weight velocity among boys at 4 years: 0.17±0.02 kg/ month in South African children.38 However, the study by
Regnault et al excluded birth weight from their analyses while the birth weight was included in the current study, which could have underestimated weight growth veloci-ties during infancy in our population.28 The mean height
growth trajectories were relatively parallel, with no visible difference in the direction of the curve between boys and girls. On the contrary, visible difference in direction was observable in the mean weight growth trajectory of boys and girls. This difference was visible after infancy where the trajectory of girls falls below the curve of boys.
In general, the three models (Jenss- Bayley, adapted Gompertz and the Reed model) seemed to fit well both on weight and height data as was evidenced by mean resid-uals close to zero (figures 1 and 2). Certain factors could influence the models’ goodness- of- fit when comparing several models. For example, a temporary delay to reach the maximum growth velocity after birth might cause difficulty in modelling weight by models like the Jenss- Bayley that do not consider this pattern. The adapted Gompertz model was tested as a potential way to tackle this issue but our adaptation did not perform better than the Jenss- Bayley model. Further analysis was done to show whether predictions by the three models (Jenss- Bayley, Reed and adapted Gompertz model) at different age points that is, at 3 months, 1 year, 3 years and 6 years were different. The predictions differ mainly at 3 months. with no major differences afterwards and the goodness- of- fit indicators supported the use of Jenss- Bayley model (data not shown).
There were slight variations in the way the models converged. The Jenss- Bayley model converged easily on weight data using an unstructured variance- covariance matrix for random effects. More convergence issues were faced after attempting to converge the Jenss- Bayley
model on the height data when the number of itera-tions was extended to 20 000. The Reed model and the adapted Gompertz model also had convergence issues both on weight and height data with an unstructured variance- covariance matrix but were able to converge with a diagonal variance- covariance matrix for random effects. Although an unstructured variance- covariance matrix would have been preferred for all the models, there was no difference in the fit indicators (ie, AIC/BIC and RSD), fixed effects and predictions (data not shown) when using a diagonal variance- covariance matrix on the Jenss- Bayley model. In particular, a diagonal variance- covariance matrix for random effects does not constraint the growth parameters to be uncorrelated, as the fixed part (population parameters) are free to be correlated anyway.
Convergence issues could be affected by several reasons including, but not limited to, the number of measurement occasions and how the time intervals between measure-ment occasions are spaced, complexity of the model (eg, the number of parameters and monotonicity), parame-terisation (eg, addition of higher- order terms such as ln (age)),14 as well as the type of statistical packages. Simpler
methods than SAEMIX could have been used for the Reed model, but for consistency in methods, it was preferred to fit them with the same one. Some computational and convergence issues we faced could be explained by the limited measurement occasions and unequally spaced time intervals between age 2 and 6 years as also reported by a previous study in South Africa.14 To facilitate the
convergence of the models, constraints of positivity on the parameters of all three models were applied by using exponential functions, as shown in equation 2 for the Jenss- Bayley model.28
CONCLUSION
This paper demonstrated that the Jenss- Bayley model presented the best fit among the three candidate models applied to longitudinal weight and height data of
Figure 3 Weight and height mean growth trajectories from the Jenss- Bayley model. (A) Weight growth curve. (B) Height growth curve. The solid (black) line implies boys’ curve and the dashed (red) line implies girls’ curve.
Publiqu Unite Documentation Multimedia. Protected by copyright.
on October 1, 2020 at Ecole des Hautes Etudes en Sante
Open access
Beninese children between birth and age 6 years. This model was then used to estimate growth trajectories and growth velocities even for children with few measure-ments. Finally, it was estimated that about one- third of the children were wasted and underweight at age 6 years. Parameters of this model will be used to study the deter-minants of growth trajectories in children.
Author affiliations
1Université de Paris, Centre of Research in Epidemiology and Statistics /CRESS, INSERM, INRA, Paris, France
2EHESP, F-35000 Rennes, France
3Institut de Recherche pour le Développement (IRD), Cotonou, Benin 4MERIT (Mère et Enfant Face aux Infections Tropicales)- UMR 216, Institut de Recherche pour le Développement (IRD), Université Paris Descartes, Paris, France 5Paediatric Department, Mother and Child University and Hospital Center (CHU- MEL), Cotonou, Benin
6Faculté des Sciences de la Santé, Université d'Abomey- Calavi, Cotonou, Littoral, Benin
7EPI- PHARE Scientific Interest Group in Epidemiology of Health Products, French National Agency for the Safety of Medicines and Health Products and the French National Health Insurance, Saint- Denis, Ile- de- France, France
Acknowledgements The authors gratefully acknowledge families enrolled in the above- mentioned studies and the contributors of the research team and staff.
Contributors SA, JB, and FBL collaborated in the conduct, analysis, interpretation of data and writing. SA performed growth modelling under the supervision of JB. FBL, RZ, AG, DC, MC, AM, JA and NF contributed towards data collection and acquisition; follow- up of studies; revision of the paper; and providing technical support. FBL and JB collaborated in the conception, planning, methodology, overall supervision and critical revision of the work. All authors read and approved the final manuscript.
Funding The Malaria in Pregnancy Preventive Alternative Drugs (MiPPAD) study was co- funded by the European and Developing Countries Clinical Trials Partnership (EDCTP; IP.2007.31080.002), the Malaria in Pregnancy Consortium and the following national agencies: Instituto de Salud Carlos III (PI08/0564), Spain; Federal Ministry of Education and Research (BMBF FKZ: da01KA0803), Germany; Institut de Recherche pour le Developpement (IRD), France. The 'Anaemia in Pregnancy: Etiologies and Consequences' (APEC) study received funding from a grant from the Bill & Melinda Gates Foundation. The TOLIMMUNPAL project was funded by Agence Nationale de la Recherche (ANR). The Eunice Kennedy Shriver National Institute of Child Health & Human Development (NIH/NICHD) funded The TOVI study (grant no. R21- HD060524). The EXPLORE study was funded by Fondation de France. Shukrullah Ahmadi received funding from a grant from Fondation de France (reference 00079816).
Competing interests None declared.
Patient consent for publication Not required.
Ethics approval The MiPPAD trial was approved by the institutional review board of the University of Abomey- Calavi, Benin. The APEC study was approved by the Ethics Committee of the Faculty of Medicine of Cotonou, Benin. The TOLIMMUNPAL study was approved by the Comité Consultatif de Déontologie et d’Éthique (CCDE) of the Institut de Recherche pour le Développement (IRD, France) and the Ethics Committee of the Faculté des Sciences de la Santé, Université d’Abomey Calavi, Benin (approval number: 43/11/2010/CE/FSS/UAC). The EXPLORE study was approved by the Research Ethics Committee of Institute of Applied Biomedical Sciences, Benin (Comité d’Ethique de la Recherche, Institut des Sciences Biomédicales Appliquées, CER- ISBA, Benin) (approval number: 87 du 17/05/2016). The TOVI study was approved by the institutional review boards of the University of Abomey- Calavi in Benin and New York University in the United States (IRB#09-1253)
Provenance and peer review Not commissioned; externally peer reviewed.
Data availability statement Data are available upon reasonable request.
Open access This is an open access article distributed in accordance with the Creative Commons Attribution 4.0 Unported (CC BY 4.0) license, which permits others to copy, redistribute, remix, transform and build upon this work for any purpose, provided the original work is properly cited, a link to the licence is given,
and indication of whether changes were made. See: https:// creativecommons. org/ licenses/ by/ 4. 0/.
ORCID iDs
Shukrullah Ahmadi http:// orcid. org/ 0000- 0001- 7071- 8761
Jérémie Botton http:// orcid. org/ 0000- 0002- 4814- 6370
REFERENCES
1 Gakidou E, Afshin A, Abajobir AA, et al. Global, regional, and national comparative risk assessment of 84 behavioural, environmental and occupational, and metabolic risks or clusters of risks, 1990–2016: a systematic analysis for the global burden of disease study 2016. The Lancet 2017;390:1345–422.
2 Berkey CS. Comparison of two longitudinal growth models for preschool children. Biometrics 1982;38:221–34.
3 Scherdel P, Dunkel L, van Dommelen P, et al. Growth monitoring as an early detection tool: a systematic review. Lancet Diabetes Endocrinol 2016;4:447–56.
4 Zhang X, Martin RM, Oken E, et al. Growth during infancy and early childhood and its association with metabolic risk biomarkers at 11.5 years of age. Am J Epidemiol
5 Regnault N, Gillman MW. Importance of characterizing growth trajectories. Ann Nutr Metab 2014;65:110–3.
6 Jenss RM, Bayley N. A mathematical method for studying the growth of a child. Human Biology 1937;9:556.
7 Berkey CS, Reed RB. A model for describing normal and abnormal growth in early childhood. Hum Biol 1987;59:973–87.
8 Simondon KB, Simondon F, Delpeuch F, et al. Comparative study of five growth models applied to weight data from Congolese infants between birth and 13 months of age. Am J Hum Biol 1992;4:327–35. 9 Winsor CP. The Gompertz curve as a growth curve. Proc Natl Acad
Sci U S A 1932;18:1–8.
10 Botton J, Heude B, Maccario J, et al. Postnatal weight and height growth velocities at different ages between birth and 5 Y and body composition in adolescent boys and girls. Am J Clin Nutr
2008;87:1760–8.
11 Molinari L, Gasser T, Hauspie RC, et al. The human growth curve:
distance, velocity and acceleration. In: Methods in Human Growth Research. Cambridge UK: Cambridge University Press, 2004: 27–54.
12 Hauspie RC, Cameron N, Molinari L. Methods in Human Growth
Research. Cambridge Press, 2004.
13 Olusanya BO, Renner JK. Predictors of growth velocity in early infancy in a resource- poor setting. Early Hum Dev 2011;87:647–52. 14 Chirwa ED, Griffiths PL, Maleta K, et al. Multi- Level modelling of
longitudinal child growth data from the Birth- to- Twenty cohort: a comparison of growth models. Ann Hum Biol 2014;41:168–79. 15 Singer JD, Willett JB. Applied longitudinal data analysis: modeling
change and event occurence. New York: Oxford University Press,
2003.
16 Pagezy H, Hauspie R. Growth in weight of African babies, aged 0-24 months, living in a rural area at the lake Tumba, Zaire. Ann Trop Paediatr 1985;5:41–7.
17 Cameron N, Jones PR, Moodie A, et al. Timing and magnitude of adolescent growth in height and weight in Cape coloured children after kwashiorkor. J Pediatr 1986;109:548–55.
18 Rozzi FVR, Koudou Y, Froment A, et al. Growth pattern from birth to adulthood in African pygmies of known age. Nat Commun
2015;6:7672.
19 Padonou G, Le Port A, Cottrell G, et al. Factors associated with growth patterns from birth to 18 months in a Beninese cohort of children. Acta Trop 2014;135:1–9.
20 González R, Mombo- Ngoma G, Ouédraogo S, et al. Intermittent preventive treatment of malaria in pregnancy with mefloquine in HIV- negative women: a multicentre randomized controlled trial. PLoS Med 2014;11:e1001733.
21 Ouédraogo S, Koura GK, Accrombessi MMK, et al. Maternal anemia at first antenatal visit: prevalence and risk factors in a malaria- endemic area in Benin. Am J Trop Med Hyg 2012;87:418–24. 22 d'Almeida TC, Sadissou I, Milet J, et al. Soluble human leukocyte
antigen -G during pregnancy and infancy in Benin: Mother/child resemblance and association with the risk of malaria infection and low birth weight. PLoS One 2017;12:e0171117.
23 Mireku MO, Davidson LL, Koura GK, et al. Prenatal hemoglobin levels and early cognitive and motor functions of One- Year- Old children. Pediatrics 2015;136:e76–83.
24 Ahmadi S, Maman S, Zoumenou R, et al. Hunting, sale, and consumption of bushmeat killed by Lead- Based ammunition in Benin. Int J Environ Res Public Health 2018;15:ijerph15061140.
Publiqu Unite Documentation Multimedia. Protected by copyright.
on October 1, 2020 at Ecole des Hautes Etudes en Sante
http://bmjopen.bmj.com/
25 Bodeau- Livinec F, Davidson LL, Zoumenou R, et al. Neurocognitive testing in West African children 3-6 years of age: challenges and implications for data analyses. Brain Res Bull 2019;145:129–35. 26 World Health Organization (WHO). Physical Status: the use
and interpretation of anthropometry. A report of a WHO Expert Committee. In: Who technical series. Geneva: WHO, 1995.
27 World Health Organization (WHO). The WHO child growth standards. Geneva WHO; 2006. https://www. who. int/ childgrowth/ standards/ en/.
28 Botton J, Scherdel P, Regnault N, et al. Postnatal weight and height growth modeling and prediction of body mass index as a function of time for the study of growth determinants. Ann Nutr Metab
2014;65:156–66.
29 Gompertz B. On the nature of the function expressive of the law of human mortality, and on a new mode of determining the value of life contingencies. Philosophical Transactions of the Royal Society of
London B: Biological Sciences 1825;115:513–85.
30 Karkach A. Trajectories and models of individual growth. Demogr Res 2006;15:347–400.
31 Tjørve KMC, Tjørve E. The use of Gompertz models in growth analyses, and new Gompertz- model approach: an addition to the Unified- Richards family. PLoS One 2017;12:e0178691.
32 Hauspie RC. Mathematical models for the study of individual growth patterns. Rev Epidemiol Sante Publique 1989;37:461–76.
33 R Development Core Team. R: a language and environment for
statistical computing. Vienna, Austria: R Foundation for Statistical
Computing, 2017.
34 Comets E, Lavenu A, Lavielle M. Parameter Estimation in Nonlinear Mixed Effect Models Using saemix, an R Implementation of the SAEM Algorithm. J Stat Softw 2017;80:1–42.
35 Anderson C, Hafen R, Sofrygin O, et al. Comparing predictive abilities of longitudinal child growth models. Stat Med
2019;38:3555–70.
36 Accrombessi M, Ouédraogo S, Agbota GC, et al. Malaria in pregnancy is a predictor of infant haemoglobin concentrations during the first year of life in Benin, West Africa. PLoS One
2015;10:e0129510.
37 Regnault N, Gillman MW, Kleinman K, et al. Comparative study of four growth models applied to weight and height growth data in a cohort of US children from birth to 9 years. Ann Nutr Metab
2014;65:167–74.
38 Chirwa ED, Griffiths P, Maleta K, et al. Postnatal growth velocity and overweight in early adolescents: a comparison of rural and urban African boys and girls. Am J Hum Biol 2014;26:643–51.
Publiqu Unite Documentation Multimedia. Protected by copyright.
on October 1, 2020 at Ecole des Hautes Etudes en Sante