HAL Id: hal-02269970
https://hal.archives-ouvertes.fr/hal-02269970
Submitted on 23 Aug 2019
HAL is a multi-disciplinary open access archive for the deposit and dissemination of sci-entific research documents, whether they are pub-lished or not. The documents may come from teaching and research institutions in France or abroad, or from public or private research centers.
L’archive ouverte pluridisciplinaire HAL, est destinée au dépôt et à la diffusion de documents scientifiques de niveau recherche, publiés ou non, émanant des établissements d’enseignement et de recherche français ou étrangers, des laboratoires publics ou privés.
Molecular Magnetic Resonance and Ultrasound Imaging
of Tumor Angiogenesis
Marie Poirier-Quinot, Ingrid Leguerney, Ludovic de Rochefort, Stéphanie
Pitre-Champagnat, Xavier Violas, Sandra Robin, Rose-Marie Dubuisson,
Jean-Christophe Ginefri, Philippe Robert, Luc Darrasse, et al.
To cite this version:
Marie Poirier-Quinot, Ingrid Leguerney, Ludovic de Rochefort, Stéphanie Pitre-Champagnat, Xavier Violas, et al.. Molecular Magnetic Resonance and Ultrasound Imaging of Tumor Angiogenesis. In-ternational Journal of Radiology and Imaging Technology, ClinMed InIn-ternational Library, 2017, 3, �10.23937/2572-3235.1510027�. �hal-02269970�
Poirier-Quinot et al. Int J Radiol Imaging Technol 2017, 3:027
Citation: Poirier-Quinot M, Leguerney I, De Rochefort L, Pitre-Champagnat S, Violas X, et al. (2017) Molecular Magnetic Resonance and Ultrasound Imaging of Tumor Angiogenesis. Int J Radiol Imaging Technol 3:027. doi.org/10.23937/2572-3235.1510027
Received: June 26, 2017: Accepted: October 09, 2017: Published: October 11, 2017
Copyright: © 2017 Poirier-Quinot M, et al. This is an open-access article distributed under the terms of the Creative Commons Attribution License, which permits unrestricted use, distribution, and reproduction in any medium, provided the original author and source are credited.
Volume 3 | Issue 2 DOI: 10.23937/2572-3235.1510027
Open Access
International Journal of
Radiology and Imaging Technology
Molecular Magnetic Resonance and Ultrasound Imaging of Tumor
Angiogenesis
Marie Poirier-Quinot
1,2*, Ingrid Leguerney
1,2, Ludovic De Rochefort
1,2, Stéphanie Pitre-Champagnat
1,3,
Xavier Violas
4, Sandra Robin
1,3, Rose-Marie Dubuisson
1,2, Jean-Christophe Ginefri
1,2, Philippe Robert
4,
Luc Darrasse
1,2and Nathalie Lassau
1,31Imagerie par Résonance Magnétique Médicale et Multi-modalités - UMR8081( IR4M), CNRS, University Paris-Sud, France 2Université Paris-Saclay, France
3Institut Gustave Roussy, France
4Experimental Imaging, MRI Unit, Research Division, Guerbet, France
*Corresponding author: Marie Poirier-Quinot, Imagerie par Résonance Magnétique Médicale et Multi-modalités -
UMR8081(IR4M), CNRS, University Paris-Sud; Université Paris-Sud, Bâtiment 220, 91405 ORSAY, France, Tel: +33-1-69-15-79-65, Fax: +33-1-69-15-41-36, E-mail: marie.poirier-quinot@u-psud.fr
Introduction
Molecular imaging using targeted contrast agents has been used to highlight fundamental biological mechanism for some time now, and facilitates the de-velopment of new drugs [1]. It has also proved to be a valuable tool for the early detection of molecular and cellular events, and for the characterization of molecule expression levels involved in inflammation and angio-genesis process [2-5]. The development of new contrast agents in the oncology field focuses on their specific tar-geting of angiogenesis and their binding to receptors/ molecules such as the αvβ3 integrin, which is highly ex-pressed on activated endothelial cells in tumor vessels [6].
Molecular Ultrasound (US) is an recent imaging ap-proach that has rapidly found its niche among other molecular imaging modalities thanks to its high
tempo-Abstract
Seeking out and identifying imaging biomarkers for early cancer diagnosis and the evaluation of patient response to therapy requires an improvement in the specificity of imaging techniques. This study explores in vivo neo-angiogenesis as-sessment using molecular mechanisms through target molec-ular Magnetic Resonance (MR) and Ultrasound (US). In this context, our study examines and compares the use of both imaging technics, targeting the same integrin in a mouse xeno graft tumor model. Following xeno transplantation of human renal cell carcinoma (Human A498), thirteen nude mice were injected with ανβ3-targeted and non-targeted Contrast Agents (CA) for MR and US use, respectively. CA binding to the tar-geted receptor was measured through Dynamic Susceptibility Contrast MR imaging and Differential Targeted Enhancement (DTE) US imaging. The specificities and co location of both targeted CAs were studied throughout the tumor, in both hypo- and hyper-vascularized areas.
One hour postinjection, a significant difference was ob-served between the signals of targeted and non-targeted MR CA (p = 0.03). The DTE-US targeted CA was signifi-cantly enhanced compared to non-targeted CA (p = 0.002). In the hypo- and hyper-vascularized regions of interest, a strong correlation was observable between both modalities, with values of r10min = 0.86 (p = 0.0003), r30min = 0.85 (p = 0.0004) and r60min = 0.87 (p = 0.0001).
This study highlights the specificity of each targeted CA. A high correlation was noted between MR and US molecular imaging for angiogenesis assessment. These two molecular imaging modalities may be used interchangeably to monitor patient response to anti-angiogenic treatment.
Keywords
Bimodal molecular imaging DCE-US/MRI, Ανβ3- Targeted
contrast agent, USPIO nanoemulsion, US microbubbles
Abbreviations
CA: Contrast Agents; US: Ultrasound; DTE: Differential Targeted Enhancement; MR: Magnetic Resonance; SE: Standard Error; Fps: Frames per second; DSC: Dynamic Susceptibility Contrast; ROI: Region of Interest
ISSN: 2572-3235
DOI: 10.23937/2572-3235.1510027
Poirier-Quinot et al. Int J Radiol Imaging Technol 2017, 3:027 • Page 2 of 9 •
old) were bred and housed in the Animal Care Facility at the Institute Gustave Roussy (Villejuif, France), in ac-cordance with institutional guidelines for animal wel-fare. Human A498 renal cell carcinoma (ATCC-HTB-44, American Type Culture Collection, Manassas, USA) were cultivated in EMEM (Eagle’s Minimum Essential Medi-um, Gibco Life Technologies, Gaithersburg, MD, USA) supplemented with 10% FBS (Fetal Bovine Serum). The experiments started 30 days after 3 × 10⁶ cells in 0.2 mL matrigel (Corning Corporated, Tewksbury, USA) were subcutaneously inoculated into the right flank of the mice.
Imaging protocol
Imaging sessions were performed using MR and US, each combined with targeted and non-targeted CA that had been injected intravenously in the systemic circu-lation (Figure 1). Targeted and non-targeted protocols were performed on the same day (D1) for US experi-ments, and systematically at a 2-day interval for MR experiments (i.e. non-targeted contrast agent injection was made on D3 or D5 and finally the targeted contrast agent injection was carried out on D3 or D5) to avoid any interaction between the MR- and US-targeted CAs.
Mice were anesthetized before each imaging ses-sion by the inhalation of isoflurane (2%) in room air (1.5 L/min). Their body temperature was monitored and maintained constant using a heated platform during US acquisitions or a constant warm air flow during MR ac-quisitions. Table 1 shows the number of mice used to evaluate ανβ3-targeted contrast agents and character-ize their affinity to the ανβ3 sites.
Molecular MR imaging
MR imaging was performed using a clinical 1.5 T scanner (Achieva, Philips Healthcare, Best, The Nether-lands) equipped with a 60 cm bore and a conventional 23 mm diameter microscopy surface coil for reception. Relaxation rate R2* measurements were made using a 3D T2*-weighted gradient-echo multi-echo sequence, selected for its sensitivity to apparent transverse relax-ation effects induced by USPIO. Dynamic Susceptibility ral resolution and ease of use [2]. Dynamic
Susceptibil-ity Contrast (DSC)-Magnetic Resonance (MR) imaging uses Ultra-Small Super Paramagnetic Iron Oxide (USPIO) Contrast Agent (CA) to provide information on tumor vascularization and hemodynamic status.
With the development of targeted agents binding to specific receptors, DSC-MR imaging can also provide mo-lecular information in intra- and extra-vascular conditions; this has the advantage of requiring low CA concentrations making it possible to probe specific molecular events [7].
The increasing development of novel targeted thera-pies to treat tumors necessitates a parallel development of technologies that can determine their potential effi-cacy, and thus facilitate therapeutic protocol planning. Efforts are also being made to assess and quantify bio-markers of treatment response that could provide infor-mation on the location and extent of cancer, including tissue characteristics or spatial heterogeneity [2,8].
The aim of this work was to evaluate the feasibility of detection of molecular events and compare in vivo quantitative US and MR molecular imaging protocols.
The pilot study was performed on renal cell carci-noma xeno grafts in mice and was designed with two main goals in mind: 1) To evaluate the specificity of two contrast agents (MR iron oxide nanoemulsion and US microbubbles), both of which were specifically designed to target ανβ3 integrin and 2) To compare the colocal-ization of molecular expression of the targeted integrin obtained by specific MR and US contrast agent acquisi-tions, respectively (summarized in Table 1).
Materials and Methods
All experiments followed the guidelines of the Euro-pean Convention for the Protection of Vertebrate Ani-mals used for experimental and other scientific purpos-es, and were approved by the Animal Research Commit-tees of the relevant laboratories, C2EA-26 and C2EA-44 (both registered at the French research ministry).
Mice and tumor model
Ten female immune deficient nude mice (6-8 weeks
Table 1: Summary of experimental protocol - evaluation of MR and US CA specificity - evaluation of targeted MR and US CA
colocalization.
Mouse MR US
Non-targeted CA Targeted CA Non-targeted CA Targeted CA
1 × + 2(*) × × × × 3 + × × 4(*) × × × × 5 + × × 6(*) × × × × 7 × + 8 × 9 × 10 ×
MHz center frequency (MS-250, Visual Sonics). Tumor volumes were measured using 2D B-mode imaging, as described in the literature [9]. 2D Differential Targeted Enhancement Ultrasound (DTE-US) imaging sessions were performed on the maximal transverse section of each tumor using contrast pulse sequencing technolo-gy, to reach the nonlinear signal produced by microbub-bles. Images were collected at a high spatial resolution (lateral and axial resolution of 165 and 75 µm, respec-tively), with 4% transmission power, 5 frames per sec-ond (fps), and a dynamic range of 40-dB [9].
Micro Marker ανβ3-targeted and control (IgG) mi-crobubbles (Visual Sonics, Toronto) with a diameter of approximately 2-3 µm were manually injected via the retro-orbital vein (50 µL per injection, injection time: 2 seconds). A 30-minute interval between the two injec-tions allowed the first CA to be cleared from the vascu-lature [9]. After each CA injection, the signal intensity was recorded as a function of time during the wash-in contrast enhancement. CA targeting was then observed 10 minutes after the bolus injection in order to allow the targeted microbubbles to bind to their endothelial molecular receptors [9], and a series of images was re-corded over 30 seconds. Using the destruction/replen-ishment approach [10], a continuous high-powered de-structive pulse (100% transmit power for 1 s) was then applied to destroy all microbubbles within the US beam elevation. Images were recorded while freely circulating CA replenished the tumor vessels. Data were then ana-Contrast (DSC)-MR was performed repeatedly for one
hour after the CA injection. R2* mapping (3D 0.5 mm isotropic sequence, TR/TE/echo spacing = 90/5.9/9.7 m sec, 6 echoes, 0.3 × 0.3 × 0.5 mm3 reconstruction voxel size, 220 Hz/pix, Tacq = 4.2 min) was carried out before and after the injection in the caudal vein of 100 µmol Fe/kg USPIO-based nanoemulsion functionalized with RGD-binding ανβ3 (P4000, referred to as E1 in patent application US 2015/0320889 A1, entitled ‘Vectorised magnetic emulsion’, and filed on Nov. 12, 2015). Identi-cal R2* mapping protocol was also carried out before and after the injection of a non-functionalized control na-noemulsion (P3999, referred to as E1T in patent appli-cation US 2015/0320889). Nanoparticle diameters were approximately 190 nm. These contrast agents are also commercialized by Chematech (France). As generally assumed in a first approximation, transverse relaxation rate R2* = 1/T 2 * = R 2,0 * + r 2
* [Fe] is linear with concentra-tion, and relaxivity is r2*~210 mM-1.s-1 (patent applica-tion US 2015/0320889 A1). All images were processed with Matlab software (2011B, Math works, USA). Mean pre- and post-injection variations, or ΔR2* (R
2 *
pre- R2 *
post), were calculated and monitored for 1 hour to quantify CA concentration, which directly reflects the binding to the targeted receptor.
Contrast-enhanced molecular US
All US acquisitions were performed on a dedicated system for small animal imaging (VEVO®2100, Visual Sonics, Canada), using a linear array probe with a 21
(a) DTE-US
(b) DSE-MRI
Pre- and Post- CA destruction Pre injection
Pre injection Post injection
US acquisition 10 ‘ Post injectionUS acquisition DTE measurement
Time (min) IV CA Injection R2* acquisition R2* acquisitions
0
10
0 10 20 30 40 50 60
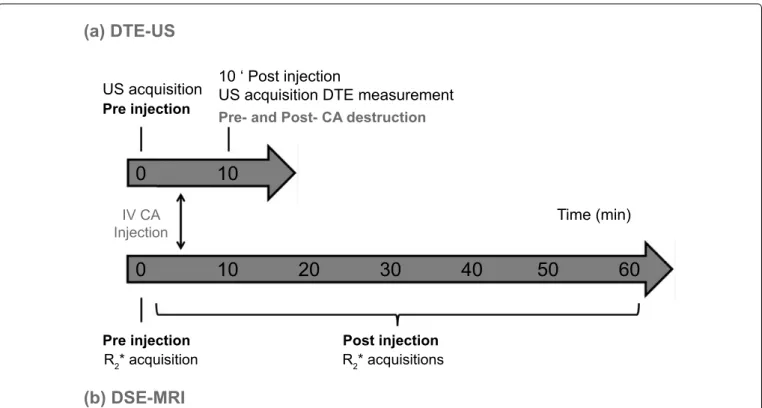
Figure 1: Experimental (a) US; (b) MR protocols. The US protocol began with the CA injection. Ten minutes after the bolus
injection, series of images were recorded for approximately 30 seconds. Using the destruction/replenishment approach, a continuous high-powered destructive pulse was then applied to destroy all microbubbles within the US beam elevation. Images were recorded while freely circulating CA replenished the tumor vessels. The MR protocol began with localization
and included a repeated 3D R2*-weighted sequence for CA quantification. The R
2*-weighted sequence was then performed
ISSN: 2572-3235
DOI: 10.23937/2572-3235.1510027
Poirier-Quinot et al. Int J Radiol Imaging Technol 2017, 3:027 • Page 4 of 9 •
alcohol (Cryomatrix OCT compound, Thermo Fisher Sci-entific, USA), then frozen in liquid nitrogen. The tumors were cut into 7-8 μm-thick sections located as close as possible to the maximal transverse section imaged by DTE-US and DSC-MR. Sections were stained with Hema-toxylin, Eosin and Saffron (HES) and observed to verify tissue integrity.
To verify the presence of β3 on the cells of the vas-cular endothelium of renal carcinoma, cover slips were incubated overnight at 4 °C with anti-human rabbit β3 (1:1000; 04-1060, Millipore) in TNB buffer as a primary antibody, then incubated for 2 h with HRP-conjugated goat anti-mouse IgG (1:1000; 111-036-047, Jackson Im-munoResearch) in TNB buffer as a secondary antibody. Given that the tumor tissue could also express the β3 integrin, β3/CD31 double labeling was carried out to demonstrate the labeling of the integrin in the vascu-lar endothelium. CD31 was revealed using anti-mouse rat CD31 (1:50; 553370, BD Biosciences) then goat an-ti-rat IgG coupled to Alexa Fluor 555 (1:200; A-21434, Life Technologies). The β3 was amplified using the TSA kit (NEL749A001KT, Perkin Elmer) and revealed by FITC-Streptavidin (1:200, STAR2B, AbD Serotec). The nuclei were labeled with DAPI (Atlantic Bone Screen, France). Nuclear staining with DAPI allowed the iden-tification of tissue structure and quality. Tissue fluores-cence was observed under a multiphoton microscope lyzed using the VEVO®2100 software to quantify the DTE
value (arbitrary unit) within specific Regions of Interest (ROIs), calculated by using the difference between the mean pre- and post-destruction signal intensities. DTE value is an indicator of the number of microbubbles that adhere to molecular endothelial receptors.
Evaluation of targeted MR and US contrast agent
colocalization
MR data were colocalized on the US 2D acquisitions to choose the closest slice in the 3D MR-acquisition vol-ume (R2*-weighted images), (Figure 2a). To compare DTE-US imaging to DSC-MR imaging, mean values of DTE and relaxation rates ΔR2* were determined in whole tumor ROI (ROI-1) and multiple intratumoral ROI (ROI 2 to 7) to reflect the heterogeneity of intratumoral mo-lecular expression. ROI 2 to 5 was manually drawn to facilitate the location (Figure 2b). The two remaining ROIs (ROI 6 and 7) were determined as the two extrema of targeted contrast agent imaging, i.e. they were hypo- (ROI-6) and hyper- (ROI-7) contrast enhanced. ROIs all measured 3.14 mm2 (circle with a radius of 1 mm).
Immunofluorescence
Immediately after the last MR imaging session, all five tumors were extracted, embedded in a OCT gel-like medium consisting of polyethylene glycol and polyvinyl
a.
b.
3D MR -acquisition volume MR closest slice on the US 2D acquisition DSC-MR DTE US imaging ROI 3 ROI 4 ROI 7 ROI 6 ROI 1ROI 2 ROI 5 mouse
skin
tumor
Figure 2: Schematic of data segmentation and ROI delimitation a) MR data colocalization on the US 2D acquisitions (B-mode)
to choose the closest slice in the 3D MR-acquisition volume (R2*-weighted images, first echo); b) Bi-dimensional Regions of
Interest (ROIs) were defined manually to delimit the whole tumor (ROI 1), ¼ of the tumor section (ROI 2 to 5), hyper- (ROI 6)
cally analyzed using the Pearson’s correlation coefficient (r) for normally distributed data, and the Spearman rank coefficient correlation was used in the absence of nor-mal distribution. The significance level of the correla-tion was determined with corresponding Pearson and Spearman tests. The ΔR2* and DTE valueswere not nor-(SP8, Leica). Regions of interest were photographed at
a magnification of x63 through an oil immersion lens.
Statistical analysis
All continuous measurements were expressed as mean ± standard deviation. Correlations were
Pre-injection Post-injection DTE-US DSC-MR a. b. c. d.
Figure 3: Molecular US imaging in harmonic mode carried out a) pre-injection; b) 10 minutes postinjection of targeted
microbubbles. First echo of DSC-MR imaging carried out; c) preinjection; d) 10 minutes postinjection of targeted USPIO nanoemulsion. The MR hyposignal is due to the presence of USPIO nanoemulsion, while microbubbles lead to a hypersignal on US acquisition. time (min)
∆
R
2* (S
-1)
non-targeted CA targeted CA 0 10 20 30 40 50 60 70 60 50 40 30 20 10 0Figure 4: ΔR2* mean values (± Standard Error SE), for targeted (square) and non-targeted (diamond) CA as a function of
time. ΔR2* valuesbecame significantly different between targeted and non-targeted CA for all acquisitions performed every
7 minutes between 37 and 60 minutes postinjection (p = 0.03, Wilcox on test for paired samples), thus providing the most appropriate imaging window to image specific binding. At 1 hour postinjection, ΔR2* measurement for targeted CA was
16.5 ± 3.9 s-1, significantly different from the values recorded for non-targeted CA, namely 5.8 ± 1.8 s-1 (p = 0.03, Wilcox on
ISSN: 2572-3235
DOI: 10.23937/2572-3235.1510027
Poirier-Quinot et al. Int J Radiol Imaging Technol 2017, 3:027 • Page 6 of 9 •
jection from 10 to 60 minutes at intervals of 7 minutes, in order to determine the optimal time at which MR imaging parameters should be compared in terms of CA binding specificity. Figure 4 shows the ΔR2* mean values (± Standard Error SE) for targeted (square) and non-targeted (diamond) CA as a function of time. ΔR2* valuesbecame significantly different between targeted and non-targeted CA for all acquisitions performed 37 minutes postinjection and later (p = 0.03), thus provid-ing the imagprovid-ing window to capture specific bindprovid-ing. At 1 hour postinjection, the ΔR2* value for targeted CA was 16.5 ± 3.9 s-1; significantly different to that of non-tar-geted CA, i.e. 5.8 ± 1.8 s-1 (p = 0.03).
Figure 5 shows the mean (± SE) US contrast signal intensities evaluated 10 minutes after the CA injection, before and after targeted and non-targeted CA destruc-mally distributed and were therefore compared using
a non-parametric Wilcox on signed-rank test. A p-value of less than 0.05 was considered statistically significant.
Results
Figure 3 shows an example of the same tumor imaged by MR (R2*-weighted scan, first echo with a Signal to Noise Ratio of 70) and DTE-US before and after the targeted CA injection. S although the signal was homogeneous before injection in both MR and US images, strong heterogeneity was observed after the injection of the CA, with signal en-hancement in US sessions and an R2* increase in MR imag-ing indicatimag-ing molecular ανβ3 expression.
MR and US contrast agent specificity
DTE-US measurements at the tenth minute postin-jection were compared to ΔR2* measurements
non targeted
targeted
7000 6000 5000 4000 3000 2000 1000 0 before CA destruction after CA destructionUS contrast signal intensity (a.u.)
Figure 5: Mean (± SE) US contrast signal intensities evaluated 10 minutes after the CA injection, before and after targeted and
non-targeted CA destruction. Non-significant difference was observed in the signal for non-targeted CA, whereas a significant decrease was observed for the targeted CA (p = 0.03, Wilcox on test), indicating the binding of the specific CA. DTE values (mean ± SE), calculated as the difference between US signal intensities before and after CA destruction, were 260.5 ± 66.0 a.u. for the non-targeted CA and 2601.5 ± 488.3 a.u. for the targeted CA. Significantly different changes in contrast were observed between US targeted and non-targeted CA (p = 0.002, Wilcox on test for paired samples).
US Area (mm2) 0 50 100 150 200 250 300 250 200 150 100 50 0 MR Area (mm 2) y = 1.2535x + 4.34 R2 = 0.995
Figure 6: Tumoral size evaluation from MR and US imaging, where r = 0.99, p < 0.001 (Pearson test). The tumor area
(p = 0.0005). The mean values of ΔR2* and DTE measured for ROI 1 to 5 were not significantly correlated, even for different post-injection times (r < 0.71). The strong correlation was observed on the specific ROIs, i.e., the hypo- and hyper-vascularized areas (ROI 6 and ROI 7, Figure 7 with respectively r10min = 0.86 (p = 0.0003); r30min = 0.85 (p = 0.0004) and r60min = 0.87 (p = 0.0001).
Immunofluorescence
The observations acquired by optical microscopy in tissue images (Figure 8) indicated the colocalization of β3 with CD31, confirming the presence of integrin on the endothelial cells of this A498 RCC tumor model. Several integrins are involved in cancer progression but most of them, such as αvβ3, are over expressed, mak-ing them difficult to quantify [6,11,12]. We successfully evaluated colocalization using Imaris (Bit plane Scientif-ic Software) to quantify the percentage of colocalization between the 2 CD31 and β3 markers, and found that colocalized β3/CD31 areas made up 30.6% of the vas-culature area.
Discussion
The contrast agents, i.e. iron oxide nanoemulsion (DSC-MR) and microbubbles (DTE-US), were both func-tionalized to target the same integrin (ανβ3) for pre-clinical oncology applications, and both were shown to provide specific targeting [13]. The novelty of this work was to make a fair comparison of molecular imaging ap-proaches seeking to identify the colocalization of angio-genesis target, using different contrast agents with dif-ferent fixation mechanisms. These results highlight the reliability of molecular imaging for angiogenesis.
An entire analysis protocol was specifically developed here to colocalize the US 2D acquisition to the closest slice in the 3D MR-acquisition volume. This protocol was combined with a systematic segmentation of the different tumor areas where ΔR2* and DTE were calculated. In this way, we ensured the closest and thus fairest possible com-parison between MR and US results, enabling region-based comparison among imaging modalities.
First, the comparison of these specific contrast agents tion. The signal did not change in the case of
non-tar-geted CA, but a significant decrease was observed for the targeted CA (p = 0.03), indicating the binding of the specific CA. DTEnon-targeted CA values were of 260 ± 66 a.u. compared to 2601 ± 488 a.u for DTEtargeted CA, indicating significantly different contrast enhancement (p = 0.002).
Molecular US and MR colocalization
The manually segmented tumor areas correlated well between the two imaging modalities (r = 0.99, p < 0.001, Figure 6), as expected. The tumor area mea-sured using MR-imaging was 25% larger than the tumor area measured using US; this difference may be due to different manual tracing.
The correlation coefficient r was evaluated for both ΔR2* and DTE values measured in all seven specific ROIs for the different post-injection times in the DSC-MR protocol. The best correlations in all the ROIs were ob-tained at 60 minutes postinjection, with r values of 0.52
DTE 0,00 500,00 1000,00 1500,00 ∆ R 2*(S -1) 40 30 20 10 0 R2 = 0,87 a.
Figure 7: a) Maximum correspondence between US and MR parameters (r = 0.875, Pearson test p < 1.10-5) was observed for
the specific ROIs, i.e., the hypo- and hyper-vascularized areas (ROI 6 and ROI 7), defined in b) US and c) MR acquisitions at 60 minutes after injection.
Figure 8: Examples of immunofluorescence merged
imag-es for β3 (green), CD31 (red), and DAPI (blue) obtained using multi photon microscopy in A498 tumor sections. Bar = 50 µm.
ISSN: 2572-3235
DOI: 10.23937/2572-3235.1510027
Poirier-Quinot et al. Int J Radiol Imaging Technol 2017, 3:027 • Page 8 of 9 •
of MR and US imaging to evaluate the early response of different therapeutic agents in renal cell carcinoma [15]. Some studies suggested that RGD peptide could not ne-cessarily reflect the change of integrin ανβ3 expression on neoangiogenesis detection [16,17]. Consequently, the real potential of RGD peptide in therapy response moni-toring needs to be confirmed with well-designed clinical investigations Beyond this limit of targeted-CAs specificity, the main benefits of the molecular US approach are its ac-cessibility and low cost. Limitations linked to operator de-pendency can often be overcome with practice. The eval-uation of early response to treatment could be achieved by improving methods for the detection and evaluation of tumors and identifying the expression levels of cell sur-face receptor such as integrins, thus permitting doctors to select the most efficient type of treatment for each case. Combining this early response to treatment with an acces-sible imaging technique such as molecular US would be a major gain for personalized care.
Acknowledgments
This work was performed on platforms affiliated to the France Life Imaging network (grant ANR-11-INBS-0006), and was partially funded by the network.
References
1. Kiessling F, Contag CH (2016) World Molecular Imaging Congress 2016: Imaging Biology-Improving Therapy. Mol Imaging Biol 18: 313-314.
2. Deshpande N, Needles A, Willmann JK (2010) Molecular ultrasound imaging: current status and future directions. Clin Radiol 65: 567-581.
3. Kiessling F, Fokong S, Koczera P, Lederle W, Lammers T (2012) Ultrasound microbubbles for molecular diagnosis, therapy, and theranostics. J Nucl Med 53: 345-348. 4. Massoud TF, Gambhir SS (2003) Molecular imaging in
liv-ing subjects: Seeliv-ing fundamental biological processes in a new light. Genes Dev 17: 545-580.
5. Weissleder R, Mahmood U (2001) Molecular imaging. Ra-diology 219: 316-333.
6. Avraamides CJ, Garmy-Susini B, Varner JA (2008) Integ-rins in angiogenesis and lymphangiogenesis. Nat Rev Can-cer 8: 604-617.
7. Poirier-Quinot M, de Rochefort L, Girard O, Darrasse L (2013) MRI: recent advances and new horizons.
8. Weissleder R, Pittet MJ (2008) Imaging in the era of molec-ular oncology. Nature 452: 580-589.
9. Leguerney I, Scoazec JY, Gadot N, Robin N, Pénault-Llorca F, et al. (2015) Molecular ultrasound imaging using contrast agents targeting endoglin, vascular endothelial growth factor receptor 2 and integrin. Ultrasound Med Biol 41: 197-207. 10. Willmann JK, Paulmurugan R, Chen K, Olivier Gheysens,
Martin Rodriguez-Porcel, et al. (2008) US imaging of tumor angiogenesis with microbubbles targeted to vascular endo-thelial growth factor receptor type 2 in mice. Radiology 246: 508-518.
11. Desgrosellier JS, Cheresh DA (2010) Integrins in cancer: biological implications and therapeutic opportunities. Nat Rev Cancer 10: 9-22.
with the non-targeted contrast agents within each im-aging session yielded significant differences (MR - Figure 4, US - Figure 5). The dynamic contrast provided by MR imaging allowed the evaluation to take place over a suf-ficiently long time scale to observe the CA kinetic, which was not the case for US acquisitions. US experiments gave access to measurement of the quantity of target-ed microbubbles at only one time point, i.e. 10 minutes postinjection, as recommended by Van Rookie, et al. [14]. The optimal window to perform MR imaging was assessed (Figure 4), and the targeted MR signal became significantly different from the non-targeted one after 37 minutes. The MR CA injected for this study had larger diameters and stronger relaxivity than those commonly used, and appears to be a promising tool for molecular imaging. These molecular MR CAs, based on nano-ob-jects and containing a high payload of contrast-gener-ating metals (USPIO in this study), are now sensitive enough for use in target-specific imaging. In light of the sensitivity (r2*~210 mM-1.s-1) and the observed average specific ΔR2* (close to 10 s-1) recorded, we can consider that approximately 50 µM concentration of iron (or a 50 pM concentration of droplets) was measurable, which is within the range of receptor concentrations.
Secondly, a good correlation was observed between specific targeted MR and US signal, with a high correlation coefficient of 0.87 at 60 minutes after injection Figure 7.
The results highlighted the high colocalization of MR and US targeted contrast agents in vivo, despite differences in their respective sizes (190 nm vs. 2-3 µm diameters) and fixation mechanisms. MR nanoemul-sion was targeted with RGD, while US CA was targeted with antibodies. Thus, the high colocalization observed in this study demonstrated the reliability of molecular imaging, whatever imaging modalities, MR or US. How-ever, simultaneous imaging by both modalities does not provide any evidence that could explain the funda-mental biological fixation mechanism. In particular, the different CA sizes led us to expect the observation of some integrins expressed exclusively on activated endo-thelial cells from vessels with the DTE-US, and integrins expressed on tumor cells after extravasation of the MR AC. These differences in CA behavior might explain ob-servations made in other ROIs.
The localization of β3 was assessed and confirmed by immunofluorescence within the vessels and within the extracellular matrix. The difficulty of implementing integ-rin labelling and observation makes it impossible to study slices thicker than 20 to 30 µm, which would allow a more robust observation and possible quantification within the vessels. Nevertheless, the multi-staining DAPI/CD31/β3 was optimized to allow high quality visualization.
Finally, our study highlights the equivalence of molec-ular DTE-US and DSC-MR imaging in terms of specificity and CA localization. This approach has already allowed the prediction of response to targeted therapies by the use
15. Leguerney I, de Rochefort L, Poirier-Quinot M, Alexandre Ingels, Xavier Violas, et al. (2017) Molecular imaging to predict response to targeted therapies in renal cell carcino-ma. Contrast Media & Molecular Imaging 2017: 7498538. 16. Rylova SN, Barnucz E, Fani M, Friederike Braun, Martin
Werner, et al. (2014) Does imaging avb3 integrin expres-sion with PET detect changes in angiogenesis during beva-cizumab therapy? J Nucl Med 55: 1878-1884.
17. Niu G, Chen XY (2016) RGD PET: From lesion detection to therapy response monitoring. J Nucl Med 57: 501-502. 12. Yan F, Xu X, Chen Y, Deng Z, Liu H, et al. (2015) A
Lipo-peptide-Based αvβ3 Integrin-Targeted Ultrasound Contrast
Agent for Molecular Imaging of Tumor Angiogenesis. Ultra-sound Med Biol 41: 2765-2773.
13. Niu G, Chen X (2011) Why integrin as a primary target for imaging and therapy. Theranostics 1: 30-47.
14. van Rooij T, Daeichin V, Skachkov I, de Jong N, Kooiman K (2015) Targeted ultrasound contrast agents for ultrasound mo-lecular imaging and therapy. Int J Hyperthermia 31: 90-106.