HAL Id: hal-01451447
https://hal.archives-ouvertes.fr/hal-01451447
Submitted on 12 Apr 2018
HAL is a multi-disciplinary open access
archive for the deposit and dissemination of
sci-entific research documents, whether they are
pub-lished or not. The documents may come from
teaching and research institutions in France or
abroad, or from public or private research centers.
L’archive ouverte pluridisciplinaire HAL, est
destinée au dépôt et à la diffusion de documents
scientifiques de niveau recherche, publiés ou non,
émanant des établissements d’enseignement et de
recherche français ou étrangers, des laboratoires
publics ou privés.
AComDim as a multivariate tool to analyse
experimental design application to γ-irradiated and
leached ion exchange resins
R Korifi, S Amat, C Rébufa, V Labed, D N Rutledge, Nathalie Dupuy
To cite this version:
R Korifi, S Amat, C Rébufa, V Labed, D N Rutledge, et al.. AComDim as a multivariate tool to
analyse experimental design application to γ-irradiated and leached ion exchange resins. Chemometrics
and Intelligent Laboratory Systems, Elsevier, 2015, 141, pp.12-23. �10.1016/j.chemolab.2014.12.003�.
�hal-01451447�
AComDim as a multivariate tool to analyse experimental design
application to
γ-irradiated and leached ion exchange resins
R. Kori
fi
a, S. Amat
a, C. Rébufa
a,⁎
, V. Labed
b, D.N. Rutledge
c, N. Dupuy
aa
Aix-Marseille Université, LISA EA4672, 13397 Marseille, France
bCEA Marcoule DEN/DTCD/SPDE, BP17171, 30207 Bagnols sur Cèze, France c
AgroParisTech, UMR1145 Ingénierie Procédés Aliments, 16 rue Claude Bernard, 75005 Paris, France
a b s t r a c t
a r t i c l e i n f o
Article history: Received 8 October 2014
Received in revised form 4 December 2014 Accepted 5 December 2014
Available online 15 December 2014 Keywords: AComDim Multivariate γ-Irradiation Leaching MIR spectroscopy Ion exchange resin
γ-Irradiations of ion exchange resins were carried out under various experimental conditions, selected using an ex-perimental design, to simulate the ageing of such nuclear wastes. Those resins are a commercial mixed bed, consti-tuted of 75 wt.% of a cationic resin and 25 wt.% of an anionic resin, and both are pure cationic and anionic resins. Then, irradiated samples were leached, at two different temperatures (20 °C and 50 °C). Solid matrices were char-acterized by a spectroscopic technique and spectral data were analysed by the ANOVA Common Dimensions (AComDim) method to detect and highlight influential factors and interactions. Four factors were studied (absorbed dose under irradiation, atmosphere during irradiation, dose rate, leaching temperature and resin type) with several levels for each. In afirst study of the separate resins, the absorbed dose and the irradiation atmosphere appeared as the most influencing factors for the anionic resin. The leaching temperature was significant but only in interaction with other factors, while this parameter was significant for the cationic and mixed bed resins. In a global study of all the spectral data, the resin type appeared as the most influential factor for the radiolysis of resins.
© 2014 Elsevier B.V. All rights reserved.
1. Introduction
In the nuclear industry, ion exchange resins with a polystyrene– divinylbenzene (PS–DVB) backbone are widely used in water deminer-alization or decontamination operations. After using, these resins are considered as low and intermediate level nuclear waste and their man-agement is still studied in some cases. During interim storage and after disposal, the structure of the ion-exchangers is subjected to ionizing ra-diation, due to the presence of nearby radionuclides in the containers, which causes their degradation or modifications in their structure. It is possible that small, water soluble, organic ligands may be generated from these waste forms that could strongly coordinate radionuclides. These reactions would enhance the release of radionuclides to the geosphere.
Here, the resin studied is a Microionex mixed bed (commercial mate-rial of nuclear grade), which is composed of 75 wt.% of a cationic resin (PS–DVB grafted with sulfonic groups) and 25 wt.% of an anionic resin (PS–DVB grafted with trimethylamonium functional groups). Ageing of this resin during its storage and disposal steps can be simulated by sub-mitting this material toγ-irradiation knowing that many factors may af-fect the behaviour of the material, depending on experimental conditions
during the irradiation process. This mixed bed resin (MB400) and its pure anionic (AmbOH) and cationic (AmbH) resins have been the subject of several studies where three parameters (absorbed dose and atmosphere during irradiation, dose rate) with several levels werefixed by an exper-imental design chosen for each type of ion exchange resin, in order to characterize the released gaseous products and the structural modi fica-tions of the resin backbone[1–3]. Also reaction mechanisms have been proposed. Correlations between the irradiation conditions, the detected quantities of gases and the spectral modifications have been established from the analysis of the responses of the experimental designs. After the preparation of all the samples under the designed experimental con-ditions, samples (in a solid state) were leachedfirst to identify species susceptible to be contaminants, and then to validate that changes oc-curred in the structure itself of the solid matrix of the samples. They were leached in de-ionised water at 20 °C and 50 °C because temperature is one of the factors that may influence the diffusion process of the leaching behaviour. Several authors have studied the leaching behaviour of cemented forms containing irradiated resins by following the leaching of60Co from a spent ion exchange resin incorporated into two types of
ce-ment for 25 days[4], by recording the cumulative fractional radioactive nuclide (137Cs) release as a function of leaching time (240 days)[5], by
periodically collecting and analyzing water which contacted cementi-tious wasteforms infield and laboratory test conditions[6], by measuring the leaching rate of60Co and137Cs from different ion exchange resins
(cationic and mix bead ion exchange resins) in cement–bentonite matrix after 245 days[7]. Fortin and Caron[8]have measured the average ⁎ Corresponding author. Tel.: +33 4 91288091; fax: +33 4 91289152.
E-mail addresses:rabia.korifi@yahoo.fr(R. Korifi),sandrine.amat@univ-amu.fr
(S. Amat),c.rebufa@univ-amu.fr(C. Rébufa),veronique.labed@cea.fr(V. Labed),
rutledge@agroparistech.fr(D.N. Rutledge),nathalie.dupuy@univ-amu.fr(N. Dupuy).
http://dx.doi.org/10.1016/j.chemolab.2014.12.003
0169-7439/© 2014 Elsevier B.V. All rights reserved.
Contents lists available atScienceDirect
Chemometrics and Intelligent Laboratory Systems
j o u r n a l h o m e p a g e : w w w . e l s e v i e r . c o m / l o c a t e / c h e m o l a bconcentrations of ions in leachates based on a 16-month monitoring pe-riod of eight waste containers and the complexing capacity of leachates with radionuclides of interest (cadmium and cobalt). Here, to study the leaching phenomenon of the studied resins after irradiation, two analyt-ical approaches were considered: (a) by analyzing the supernatant water of aqueous solutions in which irradiated resins have been immerged by ionic chromatography (IC) or from the Total Organic Carbon (TOC) deter-mination, (b) through the characterization of the leached solid matrix by a spectroscopic technique like Fourier Transform Mid-InfraRed Attenuat-ed Total Reflectance (MIR-ATR). Numerous publications talking about the IR profile of resin materials showed that their backbones are known to be usually stable under radiation because of aromatic ring resonance[9]; only grafted groups are modified or eliminated. Nevertheless, no detailed work has been published about the direct characterization of leached ir-radiated solid matrix of resins as proposed here by mid-infrared spectros-copy. Because of their multivariate nature, spectral data have not yet been used as responses for experimental designs established to study the irra-diation of each resin. To analyse this multivariate data, we propose to in-terpret the changes in the spectra using ANOVA (ANalysis Of Variance) Common Dimensions (AComDim)[10]to identify any variation in the data resulting from the effect of irradiation conditions and the effect of the leaching temperature. Some recent work showed the efficiency of methods like ANOVA–PCA (ANalysis Of Variance–Principal Component Analysis) or AComDim for such studies[11]. For each irradiated resin, AComDim highlighted Factors of influence and their interactions using the calculated saliences. The loading of the Common Components (CCs) gave information to understand the spectral modifications associated with each factor (absorbed dose, dose rate, atmosphere or leaching tem-perature) or their interactions. They also enabled to check whether the structural changes that occurred under the different irradiation condi-tions have generated chemical species well linked on the resins backbone or only adsorbed onto it, by a comparison with the MIR spectra before the leaching phase.
2. Material and methods 2.1. Sampling
Three ion exchange resins were irradiated under various irradiation conditions (atmosphere, absorbed dose, dose rate) defined using an ex-perimental design set up for each resin as detailed in a previous publica-tion[3]. After gamma irradiation, the resins were initially stored at least 15 days at controlled temperature (25 °C) to reach the same hydration level. Then the samples were leached in deionized water at two differ-ent temperatures (20 °C and 50 °C). Afterfiltration, the solids were ly-ophilized to eliminate residual water, susceptible to modify their MIR-ATR profile. The water analysis was carried out by ionic chromatogra-phy as presented in a previous paper[3]. For the pure resins (anionic and cationic ones), 16 different irradiation conditions (with different levels for the“atmosphere” and the “absorbed dose” factors) have been obtained. Each irradiated resin has been leached at 20 and 50 °C, then analysed three times by MIR-ATR. So, 96 (32 × 3) spectra were re-corded, for AmbOH and AmbH, resins and used in ACOMDIM method. For the mixed bed resin (MB400), 17 experimental conditions have been defined by its own experimental design including an additional factor, the dose rate. Each irradiated MB400 sample was leached at 20 °C and 50 °C, then analysed three times by MIR-ATR. So, 102 (17 × 2 × 3) spectra were collected and used in ACOMDIM method. 2.1.1. Resin
The resins studied in this work were the Amberlite IRA400 in its hy-droxide form (AmbOH), the Amberlite IR120 (AmbH) and a mixed bed nuclear grade resin Microionex MB400 manufactured by the Rohm and Haas Company (Philadelphia PA, USA). The AmbOH macroporous struc-ture is formed by quaternary ammonium functional groups in their hy-droxide form (−CH2N+(CH3)3, OH−)fixed on a polystyrene backbone,
cross-linked with 6.0% divinylbenzene, the AmbH has SO3−, H+
substit-uent groups. Microionex resin (MB400) is a commercial resin constitut-ed of 75 wt.% of AmbH and 25 wt.% of AmbOH. Anionic and cationic resins are industrially used in their powder form. Supplied in bead form, these pure samples were then cryoground into powder with a mean particle size of 0.8μm to have the same size as in the MB400 resin. Cryogrinding was used to avoid heat degradation. Before their use, no drying process was applied on resins, initially containing about 53% of hydrated water.
2.1.2. Gamma irradiation
3 g of resins was introduced into a glass tube and then conditioned under the appropriate irradiation environment. For the irradiations under anaerobic conditions with liquid water, a volume of 7 mL of liquid water was added to cover the resin. After conditioning, the atmospheric air inside the irradiation tubes was removed by vacuum aspiration, then backfilled with the appropriate gas: (argon for anaerobic conditions with and without liquid water) and air (for aerobic conditions). The vac-uum pressure was limited to 15–17 mbar to maintain the sample mois-ture content. This operation was repeated three times to eliminate the residual gaseous content before sealing the tube at slightly below atmo-spheric pressure to facilitate sealing. The sealing pressure under anaer-obic conditions was limited to 800 mbar whereas in the presence of oxygen, it was around 1000 mbar to obtain the highest possible concen-tration of oxygen, in order to ensure its presence throughout the whole irradiation period. For the study on solid part of resins under aerobic conditions, irradiation tubes were not sealed to ensure the presence of oxygen during the irradiation time, which was an important point for the high dose at 4 MGy.
2.1.3. Irradiator and doses
Irradiation was performed in two different irradiators both using a Cobalt-60 source to obtain two dose rates of around 0.4 or 4 kGy·h−1 at various doses between 0.1 and 4 MGy. Dosimeters based on Perspex films[12,13](routine measurements with an error of 4% and a con fi-dence interval of 95%) were used at the same place and in the same con-ditions as the samples of interest. The absorbed doses given in the following are average values. Furthermore, the samples were irradiated homogeneously by rotating them during exposure. Irradiation at low doses can be performed within few hours and was thus very easy to schedule; in contrast, irradiation at high doses requires several months. 2.1.4. Leaching experiments
The leaching experiments were then carried out by dipping approx-imately 1 g of sample into 40 mL of ultra pure water in glass vials (50 mL). These vials were then sealed and kept in a thermostatic cham-ber (20 °C or 50 °C) throughout leaching (from 143 to 213 days). To avoid the saturation of the water by leached species, experiments were carried out renewing the leaching solution after water sampling for chromatographic analyses. At the end of the leaching period (based on ionic chromatography analysis), the resin samples were fil-tered and lyophilized.
2.1.5. Freeze drying step
Resin samples (0.5 g) were introduced into an open glass vial (7 mL) and were lyophilized in a freeze dryer (Heto PowerDry LL1500) during three days. They were then stored in a desiccator before MIR-ATR analysis.
2.2. Methods
2.2.1. MIR characterization
Lyophilized samples were directly deposited onto the ATR accessory, consisting of a diamond crystal prism (brazed in only one tungsten car-bide part), four mirrors and two ZnSe focusing lenses. Once the solid has been placed on the crystal area, the pressure arm could be positioned
over the crystal/sample area. The stress is applied onto the sample, pushing it against the diamond surface. MIR-ATR spectra were collected at room temperature using a Thermo Nicolet IS10 spectrometer equipped with an MCT detector, an Ever-Glo source and a KBr/Ge beam-splitter. Spectra were acquired between 4000 and 650 cm−1, with a 4 cm−1nominal resolution. For each spectrum, 100 scans were co-added. A background spectrum in air (with the same acquisition con-ditions as those used for the samples) was acquired before each acqui-sition. The ATR crystal was carefully cleaned with ethanol to remove any residual traces of the previous sample. Three spectra were recorded for each sample and were averaged to reduce the possible impact of powder heterogeneity.
2.2.2. AComDim
To determine the impact of the different factors on sample measure-ments, signal intensity variations (due to each factor and interaction) were compared to other sources of variations, either“noise” or uncon-trolled factors of influence. The AComDim[10,13]method was used in this study to check if spectral variations due to a change of factor level are greater than residual variability (noise or experimental error). AComDim is proposed here as a multivariate technique to analyse ex-perimental designs. It is able to highlight the influential factors and their interactions as defined by the experimental design. AComDim is based on the same concept as ANOVA–PCA[11](also called APCA). The experimental data matrix is decomposed into successive matrices containing the mean at each level for each factor or interaction. The re-sidual matrix, obtained after the successive subtractions of all the mean matrices, is then added back to each matrix of means. In a second step of APCA, a PCA is applied to each matrix of means plus residuals. Groups formed by samples in the PC1–PC2 plane are examined in order to eval-uate the significance level of each factor compared to the residuals. With AComDim, the separate PCAs of the second step are replaced by a single simultaneous analysis of all matrices with ComDim, a multi-block anal-ysis method, which is actually an implementation of the Common Com-ponents and Specific Weights Analysis (CCSWA). From a mathematical point of view, AComDim determines a common space for the p data ma-trices Xi, each with n sample rows. Each matrix Xiis column-centred and
normalized to obtain the scaled matrix Xis. For each Xisthe matrix XisXisT
is computed to obtain the samples variance/covariance matrix Wi
which represents the sample dispersion in the space of the variables of that table. The main idea of AComDim[14]isfirst to calculate WG, a
weighted sum of the sample variance/covariance matrix XisXisT, for
each table, Xis, and then to extract itsfirst Principal Component, or
Com-mon Component (CC). For each successive comCom-mon dimension, the score vector q (coordinates of the n samples along the common dimen-sion) is calculated as thefirst standardized eigenvector of the sum of all λI∗ Wi. Each table Wiis therefore approximated by the equation:
Wi¼ Xj¼n j¼1λ i ð Þ j qjq T j ð1Þ
withλj(i)specific weight (“salience”) related to the ith table for the
com-mon dimension j produced by qj.
Each matrix Wiprovides a specific contribution (“salience”) to the
definition of each dimension of this common space. The salience λiof
each table on the CCs is determined iteratively. λið Þ ¼ q1
T
1Wiq1 ð2Þ
It is also possible to calculate the percentage of the total variance ex-tracted by each Common Component from the complete collection of blocks. This statistic is not as useful or easy to interpret as in a standard PCA, as it reflects both the dispersion of the samples along the compo-nents and the weight of each block in defining that direction. As the first component is by definition related to the greatest dispersion
most common to all the blocks, the corresponding variance is usually much greater than that of all the other Common Components.
The computed saliences, in the case of AComDim, indicate which fac-tor or interaction contributes most to each Common Component. The first Common Component CC1 should correspond to the effect of the re-siduals since as they are added back to each factor matrix all blocks con-tain a contribution from the residual error matrix. The blocks that contribute significantly to CC1, i.e. with high saliences are those that contain little variance other than that due to the residuals. Less a block contributes to CC1, the more its source of variability is different from the residuals. To estimate the significance of a block, one can apply the Fisher test[15]. The saliences can be considered as measures of vari-ances so the F-test of a block can be computed as the ratio between the salience of the residual block on CC1 and the salience of that block on CC1. The F-test is performed by selecting n− 1 degrees of freedom for both variances.
Fi¼λres λi ¼ qT1Wresq1 qT 1Wiq1 ð3Þ whereλresis the salience of the residual block on CC1 andλiis the
sa-lience of the ith block on CC1.
The blocks, for which the Fiis greater than the critical value of the
Fisher table[16], are considered as being related to influential factors or interactions. Two critical value levels were considered (α = 0.05 or α = 0.01). These two values were usually employed in statistical tests. In each case, the values were obtained from statistical table and depended on the number of used experiments. For n experiments, the degree of freedom is n− 1. All computations were performed using Matlab 7.14 (R2012a). The AComDim procedure was adapted from the ComDim function in the free toolbox SAISIR[17].
3. Results and discussion
In the following discussion, spectral data will befirst interpreted separately for each resin as it was provided by the initial experimental designs considering three factors: absorbed dose (4 levels: 0.1, 0.5, 1 and 4 MGy), atmosphere (3 levels: aerobic, anaerobic and anaerobic/ water) and leaching temperature (2 levels: 20 °C and 50 °C) for pure resins (AmbOH and AmbH) and an additional factor, the dose rate (low or high) for the mixed bed resin (MB400). Then to take into ac-count the factor“resin type”, all spectral data were analysed using the AComDim approach. The spectral region between 700 and 1800 cm−1 was pretreated by Multiplicative Scatter Correction (MSC)[18]prior to the AComDim analysis.
3.1. Degradation of anionic resin (AmbOH)
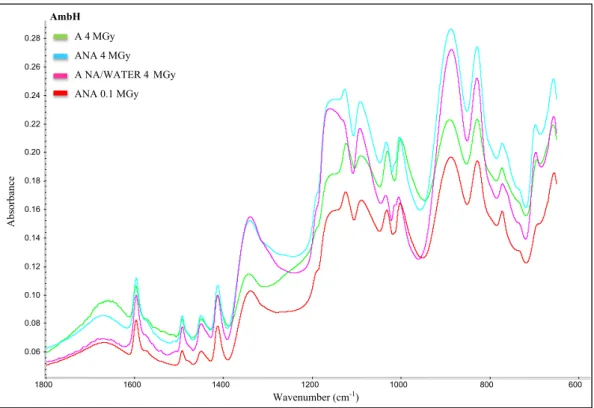
A detailed study of the spectroscopic data (MIR and NMR data) on lyophilized AmbOH samples but without leaching was published previ-ously[1]to describe the spectral modifications of this resin in the differ-ent irradiation conditions cited above. Few visual differences are observed between the spectral data recording after a leaching at 20 °C and 50 °C. Spectral modifications after irradiation and leaching experi-ments at 50 °C can be visualized inFig. 1. The MIR profile at 0.1 MGy under anaerobic conditions (ANA 0.1 MGy) is chosen as a reference at-mosphere because it is almost identical to that of the non-irradiated resin. The quaternary trimethylammonium groups (–CH2N+(CH3)3) in
the resin backbone show characteristic absorption bands at 2640, 1280, 1221 and 977 cm−1as detailed inTable 1. The MIR spectra of AmbOH resin irradiated at high absorbed dose under anaerobic atmo-sphere in the presence or absence of liquid water (respectively noted ANA 4 MGy and WATER/ANA 4 MGy) were characterized by the forma-tion of new spectral bands showing the presence of primary amines due to the elimination of methyl groups (N–H scissor vibration at
1556 cm−1, N–H deformation vibration at 1511 cm−1, C–N stretching
vibration at 1114 and 1039 cm−1, N–H out-of-plane bending vibration at 846 cm−1and N–H deformation vibration at 813 cm−1). The
presence of MIR bands characteristics of monosubstituted benzene ring (C–H out-of-plane deformation at 911, 759 and 701 cm−1)
means that the quaternary ammonium groups (–CH2N+(CH3)3) were
removed. In aerobic atmosphere (noted A 4 MGy), the degradation way of this resin was different because MIR bands of amide groups were observed (C=O stretching vibration at 1554 and 1357 cm−1). The formation of alcohols was also considered according to spectral
Table 1
Infrared assignments of MIR bands for PS–DVB backbone and ion exchange resins.
Wavenumber (cm−1) Assignment
PS-DVB Backbone AmbOH AmbH MB400
/ 3100–3700 3100–3700 3100–3700 O–H str 3056, 3033, 3023 3021 3027 3027 C–H str (aromatic ring) 2919 2917 2923 2923 C–H asym str (CH2, N–CH3) 2845 2856 2856 2860 C–H sym str (CH2, N–CH3) / 2816, 2765 / / C–H sym str (CH2–N+(CH3)3) / 2640 / / O–H str (CH2–N+(CH3)3…OH−)
/ 1629, 1600 1676, 1601 1634, 1597 C_C str (Ar–C_C– branched by CH2–N+(CH3)3or–SO3H)
/ 1485 / 1484 C_C aromatic str, –CH2scissoring, CH3asym def
1602, 1581, 1493 / 1497 / C_C aromatic str
1450 1453 1451 1451 C–H def (–CH2,–CH3), C–H scissoring (–CH2), C_C str (Ar)
/ 1418 1414 1418 C_C str (Ar) 1373, 1320 1370, 1333 / / C–H def (NCH– et CH3) / / 1343 1339 SO2asym str (–SO3H) / 1280, 1221 / / C–H def (CH3), C–N asym str (–CH2–N+(CH3)3) / / 1169, 1127, 1090, 1031, 1002 1169, 1127, 1090, 1031, 1006
C–H def (Ar), S–O asym and sym str (SO2)
1181, 1152, 1070, 1027
1184,1115, 1070, 1036 / / C–H def (Ar)
977 / / C–H o-o-p def (CH3),C–N str (–CH2–N+(CH3)3)
902, 838, 753 / / / C–H o-o-p def (monosubstituted aromatic ring)
/ 929, 891, 860, 825, 764,
705
/ / C–H o-o-p def (disubstituted aromatic ring), C–N str
(N–CH3)
/ / 898, 828, 774 890, 828, 774, 732 C–H o-o-p def (disubstituted aromatic ring)
694 / / / C–H o-o-p def (monosubstituted aromatic ring)
/ 684 / / C–H o-o-p def (disubstituted aromatic ring)
/ / 653 653 C–S str (–SO3H) et C–H o-o-p def (Ar–SO3H)
Ar: aromatic, asym: asymmetric, def: deformation, DVB: divinyl benzene, MIR: middle infrared, PS: polystyrene, o-o-p : out of plane, str: stretching, sym: symmetric.
A: aerobic atmosphere, ANA: anaerobic atmosphere, ANA/WATER: anaerobic with liquid water atmosphere
Wavenumber (cm-1) 0.02 0.04 0.06 0.08 0.10 0.12 0.14 0.16 0.18 0.20 0.22 0.24 600 800 1000 1200 1400 1600 1800 AmbOH Absorbance A 4 MGy ANA 4 MGy A NA/WATER 4 MGy ANA 0.1 MGy
bands at 1357, 1211 and 1168 cm−1(respectively due to C–O deforma-tion and stretching vibradeforma-tions).
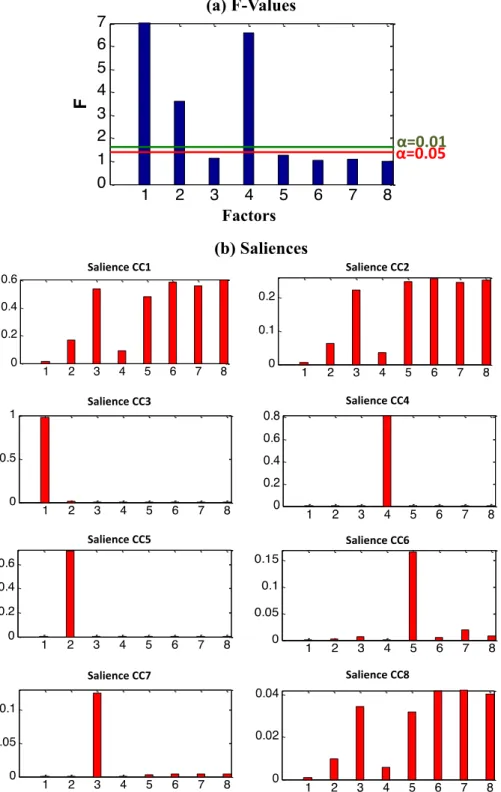
To study now the influence of leaching temperature in addition of absorbed dose and atmosphere, an AComDim analysis has been per-formed by considering three influencing parameters, leading to four possible interaction factors. Then, eight Common Components are cal-culated (3 parameters, 4 interactions and the noise) from a data matrix of 78 FTIR-ATR spectra. The AComDim analysis gives the salience values of these blocks on each CC as can be seen onFig. 2. In AComDim method, the CC1 characterizes the residual noise; its salience is the highest for the residuals block (the 8thblock). The hypothesis that CC1 corresponds
to the residuals is confirmed by the fact that no grouping can be ob-served in the CC1 scores. CC1 presents some blocks as 1, 2 and 4 with lower values of the salience. Fisher tests are computed as the ratio be-tween the salience of the residual block on CC1 (the 8thblock) and the
salience of the other seven blocks. Results of these ratios are compared to the critical value of the Fisher table according to the alpha level, for α = 0.05, the critical value is equal to 1.404 and for α = 0.01, the critical value is equal to 1.617. The ratios of the blocks 3, 5, 6 and 7 are respec-tively 1.12, 1.26, 1.03 and 1.09, none of these values are greater than the critical value of the Fisher table whatever theα level. The ratios of the blocks 1, 2 and 4 are respectively 41.91, 3.63 and 6.58; these values are greater than the critical value of the Fisher table for bothα level. Therefore, factors 1 and 2 as well as the interaction 1 × 2 are considered significant. Moreover, their low p-values show that there is a low prob-ability (b0.01%) that the variability of these three blocks is only due to noise. In other words, these blocks are significantly different from the noise. CC3 (related to the block 1“factor: absorbed dose”), CC4 (related to the block 4“interaction: absorbed dose × atmosphere”) and CC5 (re-lated to the block 2“factor: atmosphere”) have salience values much larger than the others; the components are therefore significantly influ-enced by these blocks which are the cause of the clusters observed on the score plots and their associated loading as seen inFig. 3.
The CC3 (Fig. 3a) corresponds to the block 1 which is related to the absorbed dose. The score projection associated to the CC3 shows good discrimination of samples according to the absorbed dose. The scores of the samples are classified according to the value of the absorbed dose, those which have the highest dose have the largest score values. Samples at 4 MGy are projected at the right of the plot far from the other samples with smaller dose values, whatever high their leaching temperature may be. The other samples could be found at the left of the plot according to their absorbed dose. On the score plot, the projected samples of each group are highly congregated around a near value of CC3 score. The salience of the block 1 is very low, so it is possible that the dispersion of the projected samples depends on the salience value. The salience being assimilated to the factor or interaction impact, the more the factor has significance and the more the samples groups are well defined. The high-irradiated resins (4 MGy) are characterized by absorption bands pointed in positive part of CC3 loading (Fig. 3b), which reveal the presence of amine groups as it was described previous-ly (1556, 1512, 1448, 1113, 1038, 1018, 845, 814 cm−1). The last bands (760, 723, 700 cm−1) are ones of backbone without the grafting of the quaternary ammonium group. The IR peaks in the negative part of CC3 loading describe the non-irradiated anionic resin.
The score projection associated to the CC5 (Fig. 3c) shows good rep-resentation of the sample according to atmosphere during irradiation with a greater dispersion of its CC5 value due to the higher value of sa-lience. Samples irradiated under air are projected at the left of the plot. The other samples (irradiated under anaerobic and anaerobic/water) can be found at the right of the plot. For each atmosphere, a separation of the samples into two groups is observed; this separation corresponds to the value of leaching temperature. The associated loading (Fig. 3d) shows that aerobic atmosphere is responsible for the oxidation of AmbOH structure where the quaternary ammonium groups could be replaced by amide group (C_O stretching vibrations at 1695 cm−1,
N–H deformation at 1639 cm−1, other bands at 1215 and 864 cm−1
which can define –CO–NH–CH3groups). The formation of alcohol
prod-ucts could be considered through the bands at 1358, 1215 and 1169 cm−1(C–O stretching and deformation vibrations). An oxidation in carboxylic acid salts could also take place on the grafted resin because of the presence of bands at 1593 and 1552 cm−1(CO2−asymmetric
stretching vibrations), 1215 cm−1(CO2−symmetric stretching
vibra-tions). The positive bands of CC5 loading associated to the anaerobic at-mospheres, with or without water, describe the initial structure of AmbOH and theγ-radiolysis products with primary amine groups.
The examination of the CC4 scores (Fig. 3e) shows good representa-tion of samples according to the absorbed dose associated to the atmo-sphere during irradiation, whatever high their leaching temperature is. The samples corresponding to absorbed doses at 4 MGy are separated ac-cording to the atmosphere during irradiation. For the lower values of absorbed dose, the separation occurs between air and anaerobic–water/ anaerobic. The gamma irradiation under aerobic conditions at low doses (0.1–1 MGy) has as much impact as degradation at high dose (4 MGy) without oxygen. As the dose is low, the resin's behaviour is the same under anaerobic conditions with liquid water. At 4 MGy with liquid water, the CC4 scores are different for the same atmosphere conditions and a differentiation of samples according to their leaching temperature is visible. It is not the case for the other conditions. The positive part of the CC4 loading (Fig. 3d) contains the IR bands of oxidized compounds formed at 4 MGy under aerobic conditions, described previously. The bands observed at 1512, 1113, 1038 and 814 cm−1in the negative part due to the presence of primary amines CH2NH2 instead of
trimethylammonium groups and the out-of-plane deformation vibrations of C–H bonds in monosubstituted benzene rings at 700 cm−1mean that
under the irradiation conditions cited above, trimethylammonium func-tional groups were three times demethylated and/or detached from the resin matrix.
3.2. Degradation of cationic resin (AmbH)
The modifications of AmbH structure after a γ-radiolysis can be visu-alized on FTIR-ATR spectral data (Fig. 4). Considering the anaerobic at-mosphere at 0.1 MGy as reference conditions, the grafting of functional group (–SO3H) on PS/DVB backbone improved important
spectral modifications. The characteristic bands of this group (Table 1) are detected near 1343 cm−1, 1169 cm−1(SO3asymmetric stretching
vibrations), 1127 cm−1, 1090 cm−1, 1031 cm−1, 1002 cm−1, (SO3
sym-metric stretching vibrations) and 653 cm−1(C–S stretching vibrations)
[19–26]. The irradiation under the different atmospheres and absorbed doses impact all the spectral bands of cationic resin without the appear-ance or a disappearappear-ance of specific bands. McConnell et al.[27] pub-lished that no apparent changes occurred in the structure of his strong acid cationic resin from infrared spectroscopy analysis despite that the resin sample appeared dark orange in colour after its irradiation under 1 MGy. In their works, no soluble products were determined from gas, liquid and supercriticalfluid chromatography but Inductively Coupled Plasma-Atomic Emission spectroscopy showed a loss of sulfonic acid groups and Scanning Electron Microscopy photomicrographs allowed examination of the resin for cracks, bead breakage softening, agglomer-ation and other defects. From the salience values of AComDim analysis (Fig. 5a and b), Fisher tests are computed as the ratio between the sa-lience of the residual block on CC1 (the eighth block) and the sasa-lience of the other seven blocks. The ratios of the blocks 1, 2, 4, 5, 6 and 7 are lower than the critical value of the Fisher table whatever the alpha level. Only the ratio of the third block is greater than the critical value for bothα level. For that reason, only one parameter is significant: the leaching temperature. The score projection associated to the CC2 (Fig. 5c) shows good discrimination of samples according to tempera-ture. On the loading plot of CC2 (Fig. 5d.), the IR bands in positive part differentiate the cationic resins leached at 50 °C from those washed at 20 °C. The AmbH samples leached at 20 °C are characterized by absorp-tion bands pointed at 671, 777, 991, 1028, 1111, 1211 and 1676 cm−1,
initially present in spectral data or hidden under a shoulder for the wavenumbers written in italic, with a little shift according to the atmo-sphere conditions. These bands appear characterizing grafted sulfonic acids. It was known that small traces of water result in ionisation of sul-fonic acids, therefore it is uncommon to observe covalent (non-ionised) sulfonic acids rather than the ionic (hydrated) form,–SO3−, H3O+. The
band due to the O–H stretching vibration of hydrated sulfonic acids is very broad and usually has several maxima, occurring in the region 2800–1650 cm−1; in our case only the a broad band is visible at
1676 cm−1because of the selected spectral region. The band due to the SO3asymmetric stretching vibration occurs at 1211 cm−1; generally
the position of this band mainly depends on whether the compound is alkyl or aryl and increases in intensity as a function of the sulfonic acid group content[28]. The band of the symmetric stretching vibration is sharper and occurs at 1028 cm−1. The absorption centred at 671 cm−1showed the S–O band. The positive band characterizing sam-ples leached at 50 °C may correspond to absorptions of PS–DVB back-bone. It supposes that the temperature of 50 °C may cause a more important elimination of degradation products absorbed in the matrix. One of these compounds may be sulphuric acid that appeared on the grain surface after the irradiation of resins, with darkened and smelled sulphur. Its presence was confirmed by the leaching water analysis. Fig. 2. AComDim applied on AmbOH MIR-ATR data: F-values (a), saliences (b).
Others authors have supposed the formation of new functional groups of carboxylic and phenol types as a result of the radiation–chemical ox-idation of the resin by atmospheric oxygen[29,30]but no spectral bands identifying them have been observed here under the studied irradiation conditions. Agui et al.[31]confirmed the presence of p-sulfonbenzoic acid and p-phenolsulfonic acid in the leachates after soaking a waste acid cation exchange resin into purified water heated at 50 °C but the resin has been employed at high temperature for purification. Under some degradation conditions, a dehydration reaction could occur in-volving the formation of sulfonyl bridges between base polymers with specific IR bands of alkyl-aryl sulphones between 1335–1325 and 1160–1150 cm−1but the resins leached at 20 and 50 °C have been
irra-diated under the same conditions, then this hypothesis must be rejected.
3.3. Degradation of mixed bed resin
The spectra of the tree resins no irradiated, leached at 50 °C and lyophilized were reported onFig. 6a. The FTIR profile of no irradiated
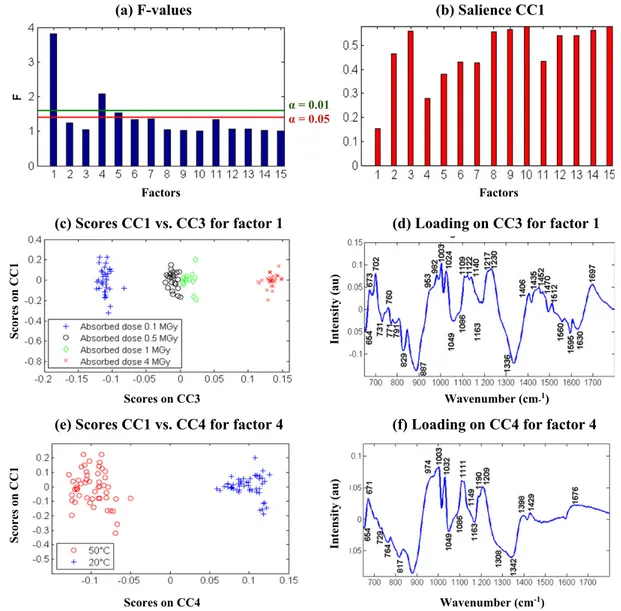
MB400 resin presents strong similarities with that of AmbH sample because of the mass percentage of the last one (75%). The contribu-tion of AmbOH resin is visible at some IR bands with a shift due to its new environment (1634, 1484, 1169 and 890 cm−1). After irradi-ation (Fig. 6b), spectral modifications are important with the dose increase but the atmosphere impact seems to be moderate. In the AComDim treatment of data, an additional parameter was consid-ered for the mixed bed resin: the dose rate with two levels (low and high). With these four parameters (absorbed dose, atmosphere, dose rate and leaching temperature), 10 interactions between them are possible. 15 CCs are calculated (4 parameters, 10 interactions and the noise). FromFig. 7a of F-values, factors 1 (“absorbed dose”) and 4 (“leaching temperature”) are considered significant.Fig. 7b shows the salience values of these parameters on CC1. Fisher tests are computed as the ratio between the salience of the residual block on CC1 (thefifteenth block) and the salience of the other four-teen blocks. The ratio of the blocks 1 and 4 is greater than the critical value of the Fisher table whatever theα level which means that the factors 1 and 4 i.e. the absorbed dose and the leaching temperature Fig. 3. AComDim applied on AmbOH resin MIR-ATR data: Scores on CC3 (a), CC5 (c), and CC4 (e) and their associated loading (respectively b, d, f).
are clearly significant. The block 5 shows that the interaction 1 × 2 (absorbed dose-atmosphere during irradiation) is significant for α = 0.05 but not significant for the more selective level α = 0.01.
The CC3 (Fig. 7c) corresponds to the block 1 which is relative to the absorbed dose. The score projection associated to the CC3 shows a clear impact of absorbed dose, increasing stepwise from 0.1 MGy to 4 MGy
(a) F-values
(b) Salience CC1
(c) Scores CC1 vs. CC2 for factor 3
Scores on CC2
Scores on CC1
Wavenumber (cm-
1)
(d) Loading on CC2 for factor 3
Factors
Factors
Intensity (au)
= 0.01
= 0.05
Fig. 5. AComDim applied on Cationic resin MIR-ATR data: (a) F-values, (b) saliences on CC1, (c) scores on CC2, (d) associated loading.
A: aerobic atmosphere, ANA: anaerobic atmosphere, ANA/WATER: anaerobic with liquid water atmosphere
0.06 0.08 0.10 0.12 0.14 0.16 0.18 0.20 0.22 0.24 0.26 0.28 600 800 1000 1200 1400 1600 1800 Wavenumber (cm-1) AmbH Absorbance A 4 MGy ANA 4 MGy A NA/WATER 4 MGy ANA 0.1 MGy
because of the close position of samples irradiated at 0.5 and 1 MGy. The associated loading (Fig. 7d) shows spectral bands allowing the cluster-ing samples irradiated at 0.1 and 0.5 MGy in the negative part of CC3. The absorption bands pointed at 1630, 1595, 1560, 887, 829, 791, 771, 731 and 654 cm−1characterize the initial functional groups of anionic
(–CH2–N+(CH3)3) and of cationic (–SO3H) grafted on the PS–DVB
backbone in reference at the infrared assignments in theTable 1. The spectral bands in the positive part of this loading describe the new func-tional groups that appeared after the gamma degradation as carbonyl stretching vibrations at 1697 cm−1and N–H deformation of amine or
A: aerobic atmosphere, ANA: anaerobic atmosphere, ANA/WATER: anaerobic with liquid
water atmosphere
0.02 0.04 0.06 0.08 0.10 0.12 0.14 0.16 0.18 0.20 0.22 0.24 0.26 0.28 0.30 0.32 600 800 1000 1200 1400 1600 1800 Wavenumber (cm-1) MB400 Absorbance A 4 MGy ANA 4 MGy A NA/WATER 4 MGy ANA 0.1 MGyb
MB400 AmbOH AmbH 0.08 0.10 0.12 0.14 0.16 0.18 0.20 0.22 0.24 0.26 0.28 0.30 0.32 0.34 Absorbance 600 800 1000 1200 1400 1600 1800 Wavenumbers (cm-1)a
1634
1484
1339
1169
1006
890
705
amide at 1512 cm−1. The other associated vibrations bands in the rest of the spectral range may describe the oxidized compounds and the scis-sion of the–SO3H group.
On the plot of scores on CC1 versus scores on CC4 (Fig. 7e), samples are classified according to the value of the leaching temperature. The MB400 samples leached at 20 °C placed at the right on the scores plot of CC3 are described on the loading (Fig. 7f) by IR bands similar to those identified for AmbH samples leached at 20 °C (at 1676, 1209, 1111, 1032, 1003 and 671 cm−1) with a low shift due to the AmbOH presence emerging under the bands at 1429, 1398 cm−1and under the shoulders at 1190, 1149 and 974 cm−1. For the MB400 resins leached at 50 °C, the loading shows the bands already identified for the AmbH resins leached at 50 °C (1342, 1163 and 880) superimposed to AmbOH IR bands or PS–DVB backbone (1308, 1049, 817, 764, 729 and 654 cm−1).
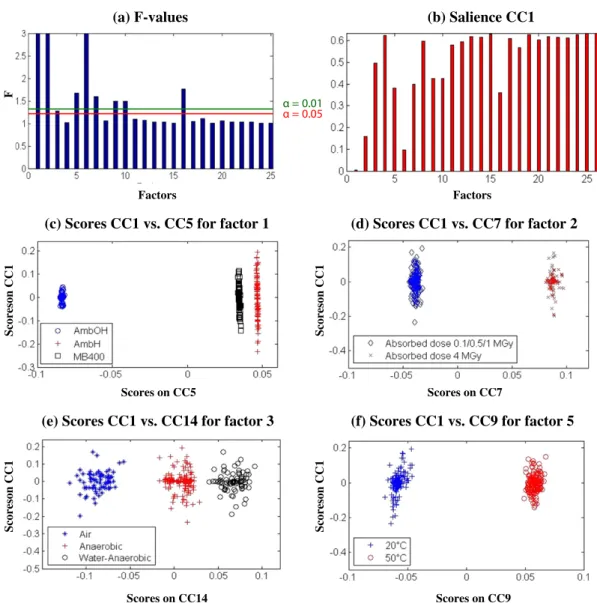
To exalting the spectral variability due to the nature of the resin, all spectral data were considered to take accountfive parameters (resin na-ture, absorbed dose, atmosphere, dose rate and leaching temperature) with the 20 associated interactions. The plot of F-values (Fig. 8a) and the plot of the salience values of these parameters on CC1 (Fig. 8b) con-firm that the dose rate was not a significant parameter whatever the α level. The most influencing factor is the nature of the resin, followed by the absorbed dose then the leaching temperature while the atmosphere
environment could have a low impact when a value of 0.05 is consid-ered forα level. On the score plot (Fig. 8c), the projected samples are grouped according the resin nature with a close position for the AmbH and MB400 sample because of their similar structure. A near value of CC5 score is also found because of the high significance of this factor. The spectral differentiations due to the absorbed dose are only detect-able when the absorbed dose is upper 1 MGy (Fig. 8d) because only the resins data at 4 MGy have been separated from other absorbed doses. In comparison with the reference atmosphere (anaerobic condi-tions), the presence of air or liquid water during the irradiation induces a different behaviour of resins as it is shown from the clusters of the
Fig. 8e, presenting nevertheless a more important dispersion of the projected samples. The influence of the leaching temperature is clearly observed on theFig. 8f that confirms the effect of temperature on the water leaching into these simulated waste forms of ion exchange resins and shows the importance of the material choice to ensure the integrity of the barriers that surround the waste packages.
4. Conclusion
AComDim method allowed to highlight the factors of influence and their interactions from MIR spectra collected, with parameters defined by an experimental design. It conduced to graphical interpretations = 0.01
= 0.05
Factors Factors
(a) F-values
(b) Salience CC1
(c) Scores CC1 vs. CC3 for factor 1
Scores on CC3
Scores on CC1
Wavenumber (cm-1)
(d) Loading on CC3 for factor 1
(e) Scores CC1 vs. CC4 for factor 4
Scores on CC4
Scores on CC1
Wavenumber (cm-1)
(f) Loading on CC4 for factor 4
Intensity (au)
Intensity (au)
such as saliences plots that easily allow detecting significant factors and their interactions. The sample projections on the plots of scores on CCs were a way to visualize clusters of resin samples versus the influencing factors or their interactions. An understanding of structural and func-tional modifications has been done from the associated loading. This work showed that MIR spectroscopy might be used to study the effect of gamma radiation on the degradation of the solid part of the ion ex-change resins and assess their different behaviour in leaching condi-tions at two temperatures. In conclusion, the nature of grafted functional groups on the resin was clearly an important parameter to limit the simulated resin's ageing. For AmbOH samples, a high value of absorbed dose was dominant on the atmosphere parameter and their interaction was obvious. Only the leaching temperature was a signi fi-cant factor for the similar structures as MB400 and AmbH resins. The four factors (resin's nature, absorbed dose, atmosphere environment and leaching temperature) became all significant when the three resins have been considered together because of a more important variability in the spectral data.
Conflict of interest
There is no conflict of interest.
Acknowledgements
Ali Traboulsi[1]is gratefully acknowledged for his participation to recording the FTIR-ATR data.
References
[1] A. Traboulsi, N. Dupuy, C. Rebufa, M. Sergent, V. Labed, Investigation of gamma radi-ation effect on the anion exchange resin Amberlite IRA-400 in hydroxide form by Fourier transformed infrared and13
C nuclear magnetic resonance spectroscopies, Anal. Chim. Acta. 717 (2012) 110–121.
[2] V. Labed, A. Traboulsi, V. Dauvois, N. Dupuy, C. Rebufa, Nucl. Inst. Methods Phys. Res. B 312 (2013) 7–14.
[3] C. Rebufa, A. Traboulsi, V. Labed, N. Dupuy, M. Sergent, Experimental design ap-proach for identification of the factors influencing the γ-radiolysis of ion exchange resins, 2014, Radiat. Phys. Chem. 106 (2015) 223–234.
[4] I. Plećaš, A. Perić, S. Glodić, A. Kostadinović, Comparative leaching studies of60Co from spent radioactive ion-exchange resin incorporated in cement, Cem. Concr. Res. 25 (1995) 314–318.
[5] K.J. Swyler, C.J. Dodge, R. Dayal, Irradiation Effects on the Storage and Disposal of Radwaste Containing Organic Ion-exchange Media, Rapport NUREG/CR–3383, United States Nuclear Regulatory Commission, 1983.
[6] M.I. Ojovan, G.A. Varlackova, Z.I. Golubeva, O.N. Burlaka, Long-termfield and laboratory leaching tests of cemented radioactive wastes, J. Hazard. Mater. 187 (2011) 296–302.
[7] I. Plecas, R. Pavlovic, S. Pavlovic, Leaching behavior of60 Co and137
Cs from spent ion ex-change resins in cement–bentonite clay matrix, J. Nucl. Mater. 327 (2004) 171–174.
α = 0.01
α = 0.05
Factors
F
(a) F-values
(b) Salience CC1
(c) Scores CC1 vs. CC5 for factor 1
Scores on CC5
Scoreson CC1
(d) Scores CC1 vs. CC7 for factor 2
Scores on CC7
Scoreson CC1
Factors
(e) Scores CC1 vs. CC14 for factor 3
Scores on CC14
Scoreson CC1
(f) Scores CC1 vs. CC9 for factor 5
Scores on CC9
Scoreson CC1
Fig. 8. AComDim applied on anionic, cationic and mixed bed resins MIR-ATR data: F-values (a), saliences on CC1 (b), scores CC1 vs. CC5 (c), scores CC1 vs. CC7 (d), scores CC1 vs. CC14 (e), scores CC1 vs. CC9 (f).
[8] C. Fortin, F. Caron, Complexing capacity of low-level radioactive waste leachates for 60
Co and109
Cd using an ion-exchange technique, Anal. Chim. Acta. 410 (2000) 107–117.
[9] C. Albano, J. Reyes, M. Ichazo, J. Gonzalez, M. Hernandez, M. Rodriguez, Polym. Degrad. Stab. 80 (2003) 251–261.
[10] D.J.R. Bouveresse, R.C. Pinto, L.M. Schmidtke, N. Locquet, D.N. Rutledge, Identification of significant factors by an extension of ANOVA–PCA based on multi-block analysis, Chemom. Intell. Lab. Syst. 106 (2011) 173–182.
[11] P. de B. Harrington, N.E. Vieira, J. Espinoza, J.K. Nien, R. Romero, A.L. Yergey, Analysis of variance–principal component analysis: a soft tool for proteomic discovery, Anal. Chim. Acta 544 (2005) 118–127.
[12] K. Farah, T. Jerbi, F. Kuntz, A. Kovacs, Dose measurements for characterization of a semi-industrial cobalt-60 gamma irradiation facility, Radiat. Meas. 41 (2006) 201–208.
[13]S. Amat, N. Dupuy, J. Kister, D.N. Rutledge, Development of near infrared sensors: detection of influential factors by the AComDim method, Anal. Chim. Acta. 675 (2010) 16–23.
[14] M. Hanafi, G. Mazerolles, E. Dufour, E.M. Qannari, J. Chemom. 20 (2006) 1–31.
[15] M. Abramowitz, I.A. Stegun (Eds.), Handbook of Mathematical Functions, Dover, New York, NY, 1965.
[16] The critical value of the F-test, according to the alpha level and the degrees of free-dom is available from the website:http://www.danielsoper.com/statcalc3. [17] SAISIR, Package of function for chemometrics in the Matlab (R) environment.
Domi-nique Bertrand coordinator (bertrand@nantes.inra.fr). Unité“Biopolymères, Interac-tions, Assemblage”. INRA, rue de la Géraudière-BP 71627- 44316 Nantes Cedex 3 France, 2008.
[18]H. Martens, S.A. Jensen, P. Geladi, O.H.J. Christie (Eds.),Proceedings of the Nordic Symposium in Applied Statistics, Stokkand Forlag, Stavanger, 1983, pp. 205–234.
[19] A. Strasheim, K. Buijs, Infra-red spectra of ion-exchangers on polystyrene base, Spectrochim. Acta 17 (1961) 388–392.
[20] V.G. Dedgaonkar, N.B. Jagtap, S. Waghmare, S.A. Kulkarni, Studies on radiation dam-age to polystyrene exchanger in different cationic forms, Radiochemistry and Radi-ation Chemistry Symposium, Kanpur, 9-13 Dec, 1985.
[21] M. Matsuda, K. Funabashi, H. Yusa, Influence of functional sulfonic acid group on pyrol-ysis characteristics for cation exchange resin, J. Nucl. Sci. Technol. 24 (1986) 124–128.
[22]V.G. Gregoriou, R. Hapanowicz, S.L. Clark, P.T. Hammaond, Infrared studies of novel optically responsive materials: orientation characteristics of sulfonated polystyrene/poly(diallyldimethylammonium chloride) ionic polymer multi-layers on patterned self-assembled monomulti-layers, Appl. Spectrosc. 51 (1997) 470–476.
[23]J.C. Yang, M.J. Jablonsky, J.W. Mays, NMR and FT-IR studies of sulfonated styrene-based homopolymers and copolymers, Polymer 43 (2002) 5125–5132.
[24] G. Socrates, Infrared and Raman Characteristics Group Frequencies, John Wiley and Sons, Ltd, 2001.
[25] F. Vladimir, F. Selemenev, A. Andrei, A. Zagorodni, Infrared spectroscopy of ion-exchange resins. Determination of amino acids ionic form in the resin phase, React. Funct. Polym. 39 (1999) 53–62.
[26] M. Matsuda, K. Funabashi, T. Nishi, Decomposition of ion exchange resins by pyrol-ysis, Radioact. Waste Manag. 75 (1986) 187–192.
[27] J.W. McConnell Jr., D.A. Johnson, R.D. Sanders, Radiation degradation in organic ion exchange resins, Waste Manag. 13 (1993) 65–75.
[28] J.M. Cánovas, I. Sobrados, J. Sanz, J.L. Acosta, A. Linares, Proton mobility in hydrated sulfonated polystyrene NMR and impedance studies, J. Membr. Sci. 280 (2006) 461–469.
[29] A.M. Dessouki, A.H. Zahran, A.M. Rabies, S.I. Amer, Some investigations on the radi-ation stability of a strongly acidic cradi-ation exchange resin, Radiat. Phys. Chem. 33 (1989) 545–549.
[30] J.A. Stahlbush, R.M. Strom, A decomposition mechanism for cation exchange resins, React. Polym. 13 (1990) 233–240.
[31] W. Agui, M. Takeuchi, M. Abe, Keizo Ogino, Leachables from strong acid cation ex-change resins, J. Jpn. Oil Chem. Soc. 37 (1988) 40–46.