HAL Id: hal-01197838
https://hal.archives-ouvertes.fr/hal-01197838
Submitted on 25 May 2020
HAL is a multi-disciplinary open access archive for the deposit and dissemination of sci-entific research documents, whether they are pub-lished or not. The documents may come from teaching and research institutions in France or abroad, or from public or private research centers.
L’archive ouverte pluridisciplinaire HAL, est destinée au dépôt et à la diffusion de documents scientifiques de niveau recherche, publiés ou non, émanant des établissements d’enseignement et de recherche français ou étrangers, des laboratoires publics ou privés.
Modelling the impact of land use change and rainfall
seasonality on sediment export from an agricultural
catchment of the northwestern European loess belt
O. Evrard, Guillaume Nord, Olivier Cerdan, Veronique Souchere, Yves Le
Bissonnais, Philippe Bonté
To cite this version:
O. Evrard, Guillaume Nord, Olivier Cerdan, Veronique Souchere, Yves Le Bissonnais, et al.. Modelling the impact of land use change and rainfall seasonality on sediment export from an agricultural catch-ment of the northwestern European loess belt. Agriculture, Ecosystems and Environcatch-ment, Elsevier Masson, 2010, 138 (1-2), pp.83-94. �10.1016/j.agee.2010.04.003�. �hal-01197838�
1 2 3 4 5 6 7 8 9 10 11 12 13 14 15 16 17 18 19 20 21 22 23 24 25 26 27 28 29 30 31 32 33 34 35 36 37 38 39 40 41 42 43 44 45 46 47 48 49 50 51 52 53 54 55 56 57 58 59 60 61
Modelling the impact of land use change and rainfall seasonality on sediment export 1
from an agricultural catchment of the northwestern European loess belt 2
Olivier Evrard a, Guillaume Nord b, Olivier Cerdan c, Véronique Souchère d, 3
Yves Le Bissonnais e, Philippe Bonté a 4
a Laboratoire des Sciences du Climat et de l’Environnement (LSCE/IPSL), UMR 1572 (CEA/CNRS/UVSQ), 5
Centre de Recherche du CNRS – Bâtiment 12, Avenue de la Terrasse, F-91198 Gif-sur-Yvette Cedex (France)
6
b Institute of Environmental Assessment and Water Research (IDÆA), CSIC, Lluis Sole Sabaris s/n, E-08028
7
Barcelona (Spain)
8
c BRGM – Aménagement et risques naturels, Avenue Claude Guillemin 3, BP 6009, F-45060 Orléans (France) 9
d INRA, UMR 1048, SAD-APT, F-78000 Thiverval Grignon (France)
10
e INRA, Laboratoire d’étude des Interactions Sol-Agrosystème-Hydrosystème,UMR LISAH, 2 Place Viala,
F-11
34060 Montpellier (France)
12
Correspondence: Olivier Evrard. E-mail : olivier.evrard@lsce.ipsl.fr Tel. +33/1/69.82.35.20. 13
Abstract 14
15
Soil erosion leads to important environmental problems (e.g. muddy floods, reservoir sedimentation) 16
in cultivated areas of the European loess belt. This study aimed to determine the impact of rainfall 17
seasonality and land use change on soil erosion over the last 40 years in a 94-ha cultivated catchment 18
of Normandy (France). To this end, scenarios representative of the different land use conditions were 19
simulated using the STREAM expert-based erosion model. A 13-yrs long sequence of rainfall events 20
was run with this model. Results showed that erosion increased dramatically after land consolidation 21
(+168% on average). Interannual variability of erosion is important. After land consolidation, 79% of 22
erosion was observed in summer and autumn, even though these seasons only accounted for 58% of 23
annual rainfall kinetic energy. The bulk of erosion was hence produced by a few intense thunderstorms 24
during this period. Thunderstorms correspond to 5% of rainfall events and to 15% of the total rainfall 25
depth, but they generate 51% of total annual erosion after land consolidation (and up to 57% of 26
erosion before land consolidation). Confrontation of the STREAM model outputs with the erosion 27
rates modelled based on Cs-137 measurements suggested that soil redistribution within the catchment 28
was very high but that sediment exports from the catchment remained limited (sediment delivery ratio 29
between 1 – 10%). Erosion rates derived from Cs-137 measurements showed an important and 30
organised spatial variability, but erosion rates integrated over larger areas remained in the same order 31
of magnitude as those simulated by the STREAM model or were slightly higher. Water erosion would 32
*Manuscript
1 2 3 4 5 6 7 8 9 10 11 12 13 14 15 16 17 18 19 20 21 22 23 24 25 26 27 28 29 30 31 32 33 34 35 36 37 38 39 40 41 42 43 44 45 46 47 48 49 50 51 52 53 54 55 56 57 58 59 60 61
hence not be the only process generating erosion within this catchment. In this context, our results 33
show that tillage erosion cannot be neglected to calculate the sediment budget over several decades. 34
35
Keywords: Agricultural landscape; erosion; rainfall seasonality; Cesium-137; expert-based 36 model. 37 38 39 1. Introduction 40 41
During the last decades, a significant increase in environmental problems such as 42
eutrophication, pollution of water bodies and reservoir sedimentation has been observed in 43
Europe, as a result of soil erosion on agricultural land (Boardman and Poesen, 2006). Among 44
these off-site impacts, muddy floods affect numerous villages of northwestern Europe 45
(Boardman et al., 2006) and induce high costs (e.g. 16 – 172 106 € each year in central 46
Belgium; Evrard et al., 2007a). Regions of intensive agricultural production of the European 47
loess belt, e.g. in Normandy, France (Souchère et al., 2003a), on the South Downs, UK 48
(Boardman et al., 2003) and in central Belgium (Evrard et al., 2007a) are regularly affected by 49
erosion and muddy floods. A severe decline in biodiversity is also outlined in agricultural 50
landscapes of northwestern Europe, as a consequence of agriculture intensification (e.g. 51
Robinson and Sutherland, 2002; Berger et al., 2006). 52
It is now well established that soil sensitivity to erosion depends on the coincidence of 53
two distributions, namely the driving force of erosion (i.e. rainfall and induced runoff 54
erosivity) and the system resistance (i.e. soil erodibility; Morgan, 2005; Nearing, 2006). 55
Rainfall erosivity depends on the climate area, the seasonal pattern of rainfall and the random 56
occurrence of storms. Soil erodibility, i.e. the sensitivity of soil to detachment by the impact 57
of raindrops and the shearing action of runoff, results from the combination of soil resistance 58
and infiltrability (Knapen et al., 2007a; Knapen et al., 2007b). On the plateaus of the 59
European loess belt, soil erodibility greatly varies throughout the year, because of the 60
decrease in infiltration rate of cultivated soils after tillage/sowing due to surface crusting 61
processes, vegetation growth and the evolution of soil moisture content (Auzet et al, 1990; Le 62
Bissonnais et al., 1998, 2005; Evrard et al., 2009). 63
The major role played by the interaction between rainfall erosivity and land use on soil 64
erosion at the scale of agricultural catchments has been outlined in several studies (e.g. 65
Cerdan et al., 2002b; Nearing et al., 2005; Evrard et al., 2008a; Valentin et al., 2008). This 66
interplay results in a strong seasonality of erosion during the year. However, to our 67
knowledge, the studies outlining erosion seasonality were restricted to a period of a few years 68
1 2 3 4 5 6 7 8 9 10 11 12 13 14 15 16 17 18 19 20 21 22 23 24 25 26 27 28 29 30 31 32 33 34 35 36 37 38 39 40 41 42 43 44 45 46 47 48 49 50 51 52 53 54 55 56 57 58 59 60 61
or to the impact of storms or extreme events (e.g. Papy and Douyer, 1991; Souchère et al., 69
2005; Nearing et al., 2005). Furthermore, the few studies that investigated erosion seasonality 70
focused on Mediterranean regions, rather than on northwestern Europe (e.g. Gallart et al., 71
2005; Lana-Renault, et al., 2007). 72
Still, in the current context of climate change, there is a need to evaluate the relative 73
contribution of rainfall erosivity and land use change on soil erosion in intensively cultivated 74
areas of northwestern Europe at the scale of several decades. Furthermore, the agricultural 75
regions of northwestern Europe have been characterised by important environmental changes 76
during the last decades. The implementation of the European Common Agricultural Policy 77
(CAP) has, for instance, led to important changes in farming practices, the selection of crop 78
varieties and the landscape structure (e.g. ditch network, field size and shape). Souchère et al. 79
(2003a) outlined that, in certain areas (e.g. Normandy), these modifications occurred very 80
rapidly, within a few years only. These changes greatly modified both the pathways and 81
quantities of runoff and erosion generated in cultivated areas (Van Oost et al., 2000). 82
Operations of land consolidation have particularly modified the pattern of runoff and its lag 83
time to flow across cropland (Evrard et al., 2007b). 84
When applied over the short-term studies (i.e. from the event to the annual scale), 85
investigations about the driving factors of soil erosion in agricultural land are typically carried 86
out by simulating scenarios using spatially-distributed models, and by comparing the model 87
outputs to field measurements. However, two problems arise when such a methodology is 88
used for several decades. First, it is difficult to find an appropriate erosion model. The model 89
must indeed be spatially-distributed, continuous and require limited input data. Second, field 90
measurements of erosion are rarely available at the catchment scale over such a long period. 91
In order to overcome the modelling problem, we used the STREAM erosion expert-based 92
model (Cerdan et al., 2002a). Even though different types of erosion models have been 93
developed in the past (see e.g. Jetten and Favis-Mortlock, 2006, for a review of models), the 94
ability of empirical models (e.g. USLE) to integrate the dominant processes at the catchment 95
scale is uncertain (Imeson and Kirkby, 1996), whereas process-based models require 96
numerous input data that are generally not available and difficult to measure (Takken et al., 97
1999). In such a context, it has been shown that expert-based models (e.g. STREAM) offer an 98
alternative and reliable solution in regions where hortonian runoff dominates (Evrard et al., 99
2009). This type of model focuses on the driving factors of erosion which can be combined by 100
developing tables of decision rules. Furthermore, the application of the selected expert-based 101
model to the catchment where it was initially designed and validated (i.e. the Blosseville 102
1 2 3 4 5 6 7 8 9 10 11 12 13 14 15 16 17 18 19 20 21 22 23 24 25 26 27 28 29 30 31 32 33 34 35 36 37 38 39 40 41 42 43 44 45 46 47 48 49 50 51 52 53 54 55 56 57 58 59 60 61
catchment in Normandy for the STREAM model; Cerdan et al., 2002a) should limit the 103
uncertainties associated with modelling. Various scenarios representative of the different land 104
use and rainfall conditions need to be modelled to derive ranges of sediment export, given 105
long term databases of input data are difficult to derive . 106
To overcome the lack of field surveys in the past, we used 137Cs measurements to 107
estimate the spatial patterns of erosion and deposition since the 1960s in the Blosseville 108
cultivated catchment. Even though this method is associated with large uncertainties, it can 109
provide an “order of magnitude” of the soil erosion that occurred in intensively cultivated 110
areas over the last four decades (e.g. Sogon et al., 1999; Walling et al., 2002; Van Oost et al., 111
2005). We also hypothesised that water erosion is the dominant erosion process in this area, 112
and that tillage erosion remains limited. 113
The main objective of this paper is to model the relative impact of rainfall seasonality 114
and land use change on soil erosion over the last 40 years, in an intensively cultivated 115
catchment of northwestern Europe. First, erosion rates over the whole period are derived from 116
137
Cs measurements. Then, local databases of rainfall, land use and associated soil surface 117
characteristics are analysed to construct various scenarios. These scenarios are then simulated 118
using the STREAM model in order to test the impact of rainfall seasonality and land use 119
change (e.g. land consolidation) on soil erosion, and to compare the simulated erosion rates 120
with the ones derived from 137Cs measurements. Finally, the implications of the reconstructed 121
history of erosion for landscape management within this catchment are discussed. 122
123
2. Materials and methods 124
125
2.1. Study site
126 127
The Blosseville catchment (94.4 ha) is located in northwestern France (49°50‟ N, 128
0°47‟W; Normandy; Fig. 1) and is characterised by a humid temperate climate. Mean annual 129
rainfall in the catchment varies between 800 and 900 mm, with a high frequency of low to 130
moderate rainfall in winter (Papy and Douyer, 1991). Mean annual temperature reaches 13°C, 131
and annual potential evapotranspiration is ca. 500 mm. The catchment has an undulating 132
topography (mean slope of 4.6%), the slopes with a gradient between 5-10% covering less 133
than 10% of the total surface. Soils are mainly Orthic Luvisols (World Reference Base, 1998) 134
and surface horizons contain at least 60% silt and 11% clay (Le Bissonnais et al., 1998). 135
Today, main land uses in the catchment are cropland (96%) and grassland (4%).The water 136
1 2 3 4 5 6 7 8 9 10 11 12 13 14 15 16 17 18 19 20 21 22 23 24 25 26 27 28 29 30 31 32 33 34 35 36 37 38 39 40 41 42 43 44 45 46 47 48 49 50 51 52 53 54 55 56 57 58 59 60 61
table is rather deep (> 7 m) and is therefore unlikely to generate saturation-excess flow. The 137
catchment is a dry valley, and the fields are undrained. 138
139
2.2 Modelling the erosion rates over a 40 yrs-period based on 137Cs measurements
140 141
137
Cs activity was measured on 60 soil profiles sampled along 5 transects within the 142
catchment in 1998-1999 in order to characterize recent soil redistribution within the 143
catchment. These transects were selected in order to take account of the various topographic 144
settings observed within the catchment (i.e. transects carried out parallel to the principal 145
thalweg directions; transects parallel to the field boundaries and transects along the steepest 146
slope direction). Undisturbed soil cores (having 9-cm diameter) were sampled in the field up 147
to a soil depth of 70 cm. All 60 cores were immediately cut in the field. The first section 148
corresponded to the uppermost 30 cm of the core (i.e. the ploughed mixed layer). The rest of 149
the cores was then cut in 5-cm sections. All the samples were air-dried during 48 h at 40 °C, 150
weighted, sieved through a 2 mm mesh and ground to a fine powder. 151
137
Cs activity was then measured at 661 keV using Germanium gamma-ray detectors 152
(Germanium hyperpure – GeHP, N-type, coaxial model; Eurisys, Lingolsheim, France) during 153
a counting time of 104-105 s.An initial qualitative assessment was performed on successive 154
sub-samples of each core to determine the maximum depth of the 137Cs signal. Total 137Cs 155
inventory (AS ; Bq m−2) of each core was finally calculated according to Eq. (1).
156 S M A A i i i S (1) 157 where Ai is the 137
Cs concentration of each sub-sample i of the core containing 137Cs (Bq kg−1); Mi is
158
the mass (kg) of the soil fine fraction of each sub-sample i; S is the surface area (m2) of the soil core 159
cylinder. 160
161
In order to estimate whether soil deposition or erosion occurred in the investigated area, 137Cs 162
inventories were compared with the inventories obtained by sampling in a neighbouring 163
undisturbed site (i.e. an orchard). 137Cs reference value and erosion rates (t ha-1 yr-1 or mm 164
yr-1) were calculated using the Cs model developed by Walling and He (1997). The erosion 165
rates derived using the Cs model were then averaged over larger areas in order to compare 166
them with the outputs of the STREAM erosion model. 167
168
2.3. Description of the STREAM model
1 2 3 4 5 6 7 8 9 10 11 12 13 14 15 16 17 18 19 20 21 22 23 24 25 26 27 28 29 30 31 32 33 34 35 36 37 38 39 40 41 42 43 44 45 46 47 48 49 50 51 52 53 54 55 56 57 58 59 60 61
STREAM (Sealing and Transfer by Runoff and Erosion related to Agricultural 170
Management) is an expert-based runoff and erosion model at the small catchment scale (10 – 171
1000 ha). It is spatially-distributed, and lumped at the event-scale (Cerdan et al., 2002a). The 172
model assumes that the following surface characteristics are the main determinants of 173
infiltration and runoff at the field scale: soil surface crusting, surface roughness, total cover 174
(crops and residues) and antecedent moisture content (Cerdan et al., 2002a). These 175
characteristics are set for each field using classification rules developed by Le Bissonnais et 176
al. (2005). A table is then used to assign a steady-state (i.e. the constant infiltration rate that is 177
reached during prolonged rainfall) infiltration rate value to each combination of these soil 178
surface characteristics. A runoff/infiltration balance (Bα) is then computed for each pixel α
179
(Eq. 2). 180
Bα = R – IR – (Iα t) (2)
181
Where R is the rainfall depth (mm); IR the amount of rainfall needed to reach soil saturation (mm) 182
derived from rainfall depth during the 48 hours before the event; Iα is the steady-state infiltration rate
183
(mm h-1) of the pixel α and t is the rainfall duration (h). Note that negative values of Bα correspond to
184
infiltration and positive values to runoff. 185
186
For each event, the runoff flow network is then derived by combining two models: (i) a 187
standard topographic runoff model (Moore et al., 1988) based on a DEM and redirecting 188
runoff from one cell to the lowest of its eight neighbours and (ii) a tillage direction model 189
developed by Souchère et al. (1998). Based on the infiltration/runoff balance (Eq. 2) 190
calculated for each pixel, a Visual Basic Application (VBA) programme is then run in 191
ArcGIS to determine flow accumulation at the catchment scale (Cerdan et al., 2002a). 192
Interrill and concentrated erosion modules have also been integrated into STREAM. 193
Within the interrill erosion module, a table is used to assign a potential sediment 194
concentration value (SC) to each combination of surface characteristics (Cerdan et al., 2002b). 195
At the catchment scale, sediment is transported in proportion of the runoff volumes computed 196
with the STREAM runoff module, and is deposited as a function of topography (vertical 197
curvature, slope gradient), or vegetation cover (see Cerdan et al., 2002c for details). 198
The module calculating gully erosion within the catchments (Souchère et al., 2003b) is 199
based on slope gradient and parameters influencing runoff velocity or soil resistance 200
(vegetation type, crop cover, soil roughness, soil surface crusting). The performance of the 201
STREAM model to predict erosion was evaluated by Evrard et al. (2009). In this study, the 202
1 2 3 4 5 6 7 8 9 10 11 12 13 14 15 16 17 18 19 20 21 22 23 24 25 26 27 28 29 30 31 32 33 34 35 36 37 38 39 40 41 42 43 44 45 46 47 48 49 50 51 52 53 54 55 56 57 58 59 60 61
Nash-Sutcliffe efficiency criterion varied between 0.85 – 0.95 for erosion predictions. 203
Furthermore, Evrard et al. (2009) showed that errors on sediment export predictions provided 204
by the STREAM model can be estimated as ≤ 30%. 205
206
2.4. Model input dataset
207 208
STREAM requires four datasets to compute runoff and erosion at any point of the 209
catchment. First, a land cover dataset, associating each field of the catchment with the 210
appropriate soil surface characteristics, is needed. Then, the slope and the flow directions are 211
calculated by combining the DEM of the catchment and the tillage direction model. A DEM 212
with 5 m grid cells is available for the Blosseville catchment. Third, a decision table is 213
required to associate the soil surface characteristics observed in the different fields of the 214
catchment with a steady-state infiltration rate (Iα) and a single potential sediment
215
concentration (SCα) value. Finally, four parameters characterising the simulated rainfall
216
events must be introduced into the model: 217
total rainfall amount (RA; mm); 218
total rainfall effective duration (RD; h) – we therefore removed the rainfall periods 219
with an intensity lower than 2 mm h-1; 220
total rainfall amount during the 48 h before the beginning of the event (ARA48h; mm);
221
maximum 5-min rainfall intensity (Imax5min; mm h-1).
222 223
2.5. Deriving STREAM input data from local databases
224
Rainfall data
225
Rainfall has been collected between October 1992 and January 2006 by a 0.2-mm 226
resolution raingauge located at the catchment outlet. We distinguished two rainfall events 227
when there is a period without precipitation of at least 150 minutes between them. A threshold 228
of 1 mm rainfall was also applied to remove the lowest events from the database. 229
A k-means clustering was then used to classify the rainfall events that occurred within the 230
Blosseville catchment (n=1948) into several groups, based on the four parameters required by 231
STREAM (RA; RD; ARA48h; Imax5min).
232
The homogeneity of the groups created by the k-means clustering was then checked using 233
a non-parametric Kruskal-Wallis test, given the tested variables were not normal. 234
1 2 3 4 5 6 7 8 9 10 11 12 13 14 15 16 17 18 19 20 21 22 23 24 25 26 27 28 29 30 31 32 33 34 35 36 37 38 39 40 41 42 43 44 45 46 47 48 49 50 51 52 53 54 55 56 57 58 59 60 61
Finally, given Salles et al. (2002) state that rainfall kinetic energy is often used as an 235
indicator of rainfall erosivity, kinetic energy (KE; J m-2) of each rainfall event was calculated 236
using Eq. 3. This equation was selected because it was based on a raindrop size distribution 237
representative for a wide range of environments. 238 i i mm I KE 8.95 8.44 log10 (3) 239
where KEmm is the volume-specific kinetic energy (J m
-2
mm-1) and I is the rainfall intensity at the one-240
minute time step (mm h-1). 241
Thirteen hydrologic years (starting in October and ending in September) were 242
extracted from the database (October 1992 – September 2005). We checked if these data were 243
representative for the last 40 years in the region using rainfall data available for four 244
neighbouring meteorological stations operated by Météo France and located within a radius of 245
10 km around the catchment. Non-parametric Kruskal-Wallis tests were carried out to 246
compare the rainfall regimes of the different periods. 247
248
Land use and associated soil surface characteristics
249 250
The field pattern (i.e. their limits and shapes), the crop types and the soil surface 251
characteristics [soil surface crusting; surface roughness; total cover of crops and residues] 252
required by STREAM were determined each month by visual observations in the Blosseville 253
catchment and in neighbouring sites between 1992 and 2002. In total, a database of 4255 field 254
surveys has been compiled (Joannon, 2004; Le Bissonnais et al., 2005; Souchère et al., 2007). 255
This database was used to associate soil surface characteristics with the most common crops 256
in Upper Normandy. Steady-state infiltration rates (Iα) and potential sediment concentrations
257
(SCα) were attributed to these combinations of soil surface characteristics using the tables
258
proposed by Cerdan et al. (2002a, 2002b) for Normandy. A classification of runoff risk and 259
interrill erosion risk at the field scale was then applied to the common crops of Upper 260
Normandy, based on these Iα and SCα values.
261
Land consolidation in the Blosseville catchment occurred in 1965. The former field 262
pattern was mapped from a digitised aerial photograph taken on 15 September 1947 (French 263
National Geographical Institute). A visual observation of the photograph allowed the 264
recognition of most land uses at the end of summer within the catchment. The proportions of 265
the different land cover classes were then checked using the available agricultural statistics 266
(French General Agricultural Census) in the neighbouring municipalities. 267
1 2 3 4 5 6 7 8 9 10 11 12 13 14 15 16 17 18 19 20 21 22 23 24 25 26 27 28 29 30 31 32 33 34 35 36 37 38 39 40 41 42 43 44 45 46 47 48 49 50 51 52 53 54 55 56 57 58 59 60 61 268
2.6 Deriving the erosion rates from STREAM simulations
269
The relative impact of (i) rainfall seasonality, (ii) land use (e.g. land consolidation) on soil 270
erosion were investigated, by simulating two series of scenarios: 271
(i) At the annual scale, we chose to simulate all the sequence of rainfall events 272
(October 1992 – September 2005) recorded by the raingauge located in the 273
catchment. This provided us a reliable order of magnitude of annual erosion. At 274
the interannual scale, we outlined the impact of seasonality and heavier storms 275
during these years, to determine their relative contribution to the total annual 276
erosion. A single heterogeneous crop distribution representative for the crop 277
rotations implemented after the land consolidation and the associated soil surface 278
characteristics was used to perform this first set of simulations. 279
(ii) We also compared the land use situation before (a) and after (b) the land 280
consolidation of the catchment carried out in 1965, by simulating the same 13 yrs-281
rainfall sequence (October 1992- September 2005) with the land use situation 282
observed before land consolidation and by comparing the output erosion rates with 283
those obtained in (i). 284
285
3. Results and discussion 286
287 288
3.1. Modelling the erosion rates over a 40 yrs-period based on 137Cs measurements
289 290
In Blosseville, the 137Cs reference value reached 2184 128 Bq m−2 in 2000 (mean 291
activity and standard deviation derived from the analysis of 6 reference cores). The pattern of 292
soil redistribution within the catchment is highly complex and is not directly influenced by 293
slope steepness and convexity (Fig. 2a-b).Erosion within the catchment is the most intense 294
upslope or in the vicinity of the field boundaries, reaching up to - 3 mm yr-1. However, a 295
succession of erosion and accumulation areas is observed along the different hillslope 296
transects.In contrast, erosion on the footslopes as well as in the thalweg is lower (up to -1.2 297
mm yr-1), given sedimentation also takes place at those locations. An area of important soil 298
accumulation is observed in the lower part of the catchment thalweg (between 2.3 and 4 mm 299
yr-1). This accumulation is also influenced by the former land use pattern. This accumulation 300
area is located just upstream of a former field boundary between arable land and grassland 301
(Fig. 2b). Sediments settle typically in such locations. At the catchment outlet, erosion starts 302
1 2 3 4 5 6 7 8 9 10 11 12 13 14 15 16 17 18 19 20 21 22 23 24 25 26 27 28 29 30 31 32 33 34 35 36 37 38 39 40 41 42 43 44 45 46 47 48 49 50 51 52 53 54 55 56 57 58 59 60 61
again, at rather severe local rates (-2 – -3.1 mm yr-1). These high rates are explained by runoff 303
concentration in the thalweg, close to the catchment outlet. Overall, 137Cs measurements 304
outline the variability of erosion and accumulation patterns within the catchment. This 305
variability is also due to the combination of processes of interrill and rill erosion. Important 306
soil redistribution occurs within the catchment. Three areas are delineated in the vicinity of 307
the transects and a mean erosion rate is calculated for each area to compare it with the 308
STREAM model outputs (Fig. 2a). 309
310
3.2. Rainfall seasonality in the Blosseville catchment
311 312 313
In total, 1948 rainfall events (> 1 mm) occurred in the catchment between October 314
1992 and September 2005. This rainfall sequence can be considered as representative for the 315
last 40 years. No significant statistical difference (for monthly, seasonal and annual cumulated 316
rainfall) has been identified when comparing the Blosseville dataset (Table 1) to the ones 317
from the neighbouring Météo France stations using Kruskal Wallis tests. 318
Rainfall is rather evenly widespread throughout the year (Fig. 3a). There are no 319
important seasonal trends associated with the monthly rainfall depth, except a peak of rainfall 320
in October and a slightly lower rainfall depth in summer (particularly in July). When we focus 321
on rainfall erosivity, clearer seasonal differences can be outlined (Fig. 3b). October is clearly 322
the most erosive month of the year, the average kinetic energy reaching 6113 J m-2 in 323
October, compared to a monthly average of 3492 J m-2 during the rest of the year. Overall, the 324
4-months period from September to December concentrates 45% of the total annual erosivity. 325
February and March are rather dry (ca. 50 mm of monthly rainfall) and characterised by the 326
lowest rainfall erosivity of the year (ca. 2500 J m-2). 327
These trends can be refined by characterising the different types of rainfall events 328
occurring each month. The k-means classification allows differentiating three types of events 329
(Fig. 3a; Table 2): (i) rainfall on wet soils; (ii) intense thunderstorms and (iii) low-intensity 330
rainfall on dry soils. (i) Rainfall on wet soils is mostly observed between October and January 331
(33% of the total rainfall depth during this period), even though similar events are also 332
recorded in the remainder of the year (22% of the total annual rainfall). Rainfall events 333
occurring on wet soils are generally characterised by a low to moderate intensity (RA of 6.5 334
mm; Imax5min of 10.8 mm h-1; Table 2). These events, falling mostly on wet soils, are
335
associated with oceanic fronts coming from the Atlantic. (ii) Intense thunderstorms contribute 336
significantly to the cumulative rainfall depth between May and October (25% of rainfall 337
1 2 3 4 5 6 7 8 9 10 11 12 13 14 15 16 17 18 19 20 21 22 23 24 25 26 27 28 29 30 31 32 33 34 35 36 37 38 39 40 41 42 43 44 45 46 47 48 49 50 51 52 53 54 55 56 57 58 59 60 61
during this period and 15% of total annual rainfall). They can be considered as „extreme‟ in 338
numerous cases (RA of 15.4 mm; Imax5min of 48.1 mm h-1; Table 2). These storms are
339
associated with the development of convective cells at the end of spring and in summer. (iii) 340
Finally, rainfall on dry soils corresponds to the bulk of annual rainfall (63%; Fig. 3b). These 341
long-lasting events are characterised by low intensities (RA of 4.5 mm; Imax5min of 8.2 mm h
-342
1
; Table 2). They correspond in a certain way to the low “background” rainfall signal. 343
The contribution of these three classes of events to the annual erosivity is somewhat 344
different (Fig. 3b). For instance, the large contribution of thunderstorms to the average 345
monthly erosivity is particularly important between July and October (29%), even though 346
these storms are rather infrequent (only 9% of the events occurring during this period). 347
348
3.3. Land cover and associated soil surface characteristics
349 350
The risk of runoff and interrill erosion was derived from data for the period 1992-2002 351
for the common crops in Upper Normandy, based on the monthly surveys of soil surface 352
characteristics (Table 3a). For simplicity reasons, the common crops have been regrouped in 353
three classes (winter crops; early spring crops and late spring crops). The class of winter crops 354
mostly consists of winter wheat - Triticum aestivum L. (80%) and in much lower proportions 355
of oilseed rape (Brassica napus L.) and winter barley (Hordeum vulgaris L.); the class of 356
early spring crops regroups proteaginous pea (Pisum arvense L.) and textile flax (Linum 357
usitatissimum L.); and the class of late spring crops represents corn (Zea mays L.), potatoes
358
(Solanum tuberosum L.) and sugar beets (Beta vulgaris L.). 359
It must be outlined that this monthly evaluation consists in a simplification of the 360
actual situation observed in the field, given the soil surface characteristics at a given time 361
result from the interaction of the rainfall conditions and the crop system at this time. 362
Furthermore, farming operations modifying soil surface conditions are not distributed 363
randomly throughout the year. Certain farming practices are indeed concentrated during 364
certain periods of the year (e.g. succession of harvests and sowings between mid-July and 365
mid-November). They lead to important modifications of soil surface characteristics during 366
these periods. In contrast, farming operations are more limited during other periods of the 367
year (e.g. from mid-November to mid-February, because of wet and cold conditions) and 368
rainfall erosivity is therefore the driver of the degradation of the soil surface characteristics 369
during this period. 370
1 2 3 4 5 6 7 8 9 10 11 12 13 14 15 16 17 18 19 20 21 22 23 24 25 26 27 28 29 30 31 32 33 34 35 36 37 38 39 40 41 42 43 44 45 46 47 48 49 50 51 52 53 54 55 56 57 58 59 60 61
The sowing date of the different crops is a very important event, which is 371
unfortunately often undocumented in the field surveys. This date, which depends itself on the 372
local meteorological conditions (i.e. the farmer takes advantage of a dry weather to sow the 373
crops) coincides indeed with the beginning of the soil surface degradation by the action of 374
cumulative rainfall (Table 3a). Soil degradation in autumn is particularly high, given the soil 375
surface is not protected by vegetation. The sowing of wheat generally occurs early in October. 376
The rainfall depth needed for the transition of one soil crusting stage to the next has been 377
determined based on the database compiled. The transition from the initial soil fragmentary 378
structure (i.e. F0 stage) to an altered state (i.e. F11 stage) requires ca. 28 mm rainfall. The 379
local formation of depositional crusts (i.e. F12 stage) is then observed after ca. 87 mm 380
additional rainfall. Finally, reaching a continuous state with depositional crusts (i.e. F2 stage) 381
requires ca. 110 mm additional rainfall. A similar analysis has been performed for spring 382
crops, even though the documented soil surface characteristics are not as homogeneous as for 383
winter cereals (Joannon, 2004). 384
This evaluation allows outlining the periods sensitive to runoff and soil erosion 385
throughout the year (Table 3c-d). The high risk of interrill erosion is restricted to the period 386
following the crop sowing, whereas a high risk of runoff is widespread all throughout the 387
year. 388
Land use has undergone important modifications since the 1940s (Fig. 4). Land use in 389
1947, identified by a visual observation of the aerial photograph, consisted in grassland 390
(64.6%), winter cereals (28.4%) and late spring crops (7%). After the consolidation in 1965, 391
the mean size of the fields increased by 120%, from 1.0 ha in 1947 to 2.2 ha in 2000. A 392
dramatic decrease of the surface covered by grassland has rapidly occurred in the 1970s. An 393
increase in the variety of crops has also been observed at this time, with the planting of early 394
spring crops (Fig. 4). The proportion of the different land covers remained rather constant 395
between 1979-2000. 396
397
3.4. Impact of rainfall seasonality on erosion
398 399
To remain consistent with the progressive degradation of soil surface characteristics 400
after crop sowing outlined in section 3.3, we simulated the 13-yrs sequence of rainfall, 401
starting in October and ending in September, to coincide with the annual growth cycle of 402
wheat, which is commonly the most widespread crop in the Blosseville catchment. 403
1 2 3 4 5 6 7 8 9 10 11 12 13 14 15 16 17 18 19 20 21 22 23 24 25 26 27 28 29 30 31 32 33 34 35 36 37 38 39 40 41 42 43 44 45 46 47 48 49 50 51 52 53 54 55 56 57 58 59 60 61
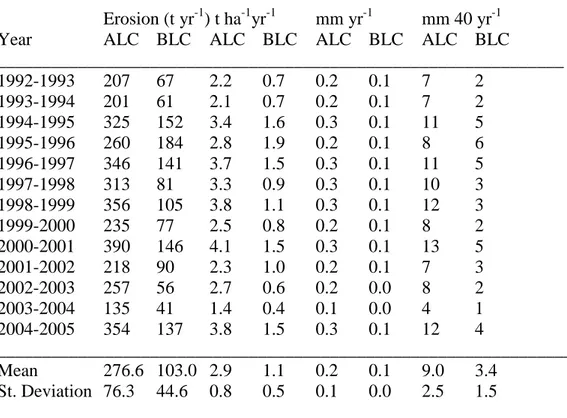
The mean erosion rate reached 276.6 t yr-1 for the heterogeneous crop pattern observed 404
after land consolidation and the 13-yrs study period (Table 4a). Summer and autumn were the 405
most erosive seasons (79% of the total annual erosion; Table 5a) and erosion was primarily 406
triggered by thunderstorms (51% of erosion; Table 5b). 407
Inter-annual variability of erosion was high (Table 6; Fig. 5). Annual erosion at the 408
catchment outlet ranged between 133 t in 2003-2004 and 389 t in 2000-2001. There was no 409
correlation between total annual rainfall and total annual erosion (R2=0.03). This was 410
illustrated by the situation observed during certain years, e.g. 1995-1996. This hydrologic 411
year was the driest of the entire study period (Fig. 5a). Winter rainfall accounted for only 21% 412
of the total annual rainfall, but generated 89% of the annual erosion (Fig. 5b). In contrast, 413
1994-1995 was the wettest year of the study period (Fig. 5a). Winter rainfall accounted for 414
45% of annual rainfall but generated only 18% of total erosion (Fig. 5b). These two examples 415
illustrate the crucial importance of simulating a sequence of events, and not only isolate 416
storms. This is particularly true in an agricultural region where erosion results from the 417
combination of soil erodibility, which strongly varies all throughout the year, and rainfall 418
erosivity. The high erosion observed in winter in 1995-1996 is due to the occurrence of 419
rainfall on very crusted soils. Such an important issue could not have been outlined if we 420
worked at the event or even at the annual scale. 421
Intra-annual variability of erosion is also important (Fig. 5a-b). When correlations are 422
calculated between cumulative rainfall and erosion for the different seasons, it is particularly 423
low during winter (R2=0.09), low in summer (R2=0.24), but higher in spring (R2=0.51) and in 424
autumn (R2=0.62). This means that cumulative rainfall is only partly relevant to describe 425
erosion extent in spring and autumn, when rain falls on a soil sparsely covered by vegetation, 426
which can directly lead to erosion. In contrast, in winter, erosion mainly depends on the 427
presence of a soil surface crust, which is formed by cumulative rainfall in autumn. In summer, 428
erosion is triggered by thunderstorms, which is badly reflected by cumulative rainfall. The 429
mean contribution to erosion per storm is indeed the highest in summer (up to 45 t per event; 430
Table 4a). It is important to note that, compared to the mean annual rate, erosion generated by 431
a single event can be very important during certain years (e.g. a single event that occurred in 432
September 1998 generated 164.4 t). Given these results, it is really questionable to envisage 433
the creation of a representative mean hydrologic year to investigate erosion in a given area. 434
435
3.5. Impact of land consolidation on erosion
436 437
1 2 3 4 5 6 7 8 9 10 11 12 13 14 15 16 17 18 19 20 21 22 23 24 25 26 27 28 29 30 31 32 33 34 35 36 37 38 39 40 41 42 43 44 45 46 47 48 49 50 51 52 53 54 55 56 57 58 59 60 61
Before land consolidation, mean erosion rate reached 103 t yr-1 (Table 4b). Overall, 438
erosion increased importantly after land consolidation (+ 168% on average; Table 6). Before 439
land consolidation, summer was already the principal contributing season to erosion (45.8%; 440
Table 4c). Winter erosion was also more important before land consolidation (23.8%). 441
The contribution of thunderstorms to total erosion was also higher before land 442
consolidation, triggering 57% of erosion (Table 5b). This result confirms that runoff and 443
sediment connectivity within a catchment characterised by a small field pattern was already 444
achieved during heavy rainfall. Muddy floods were indeed already reported in Normandy 445
before 1965 (Papy and Douyer, 1991), but they were less frequent. However, sediment export 446
during extreme events was much lower before land consolidation because of the higher 447
proportion of grassland trapping sediment (Fig. 2a). For instance, according to our model 448
simulations, a 53-mm storm occurring in 5 hours and falling on a dry soil in September 449
generates 41.2 t with the field pattern before land consolidation (vs. 152.7 t afterwards). 450
Crop pattern before land consolidation was run with the soil surface characteristics 451
observed currently. However, the farming machinery used in the 1950s (e.g. horses pulling 452
ploughshares) induced a lower compaction of the soil. Furthermore, soil loosening was less 453
pronounced at this time. Given the formation of a soil surface crust was probably less rapid 454
and less widespread in the past, the infiltration rate and the potential sediment concentration 455
were probably higher, because of a lower soil cohesion in surface. It is likely that this 456
simplification leads to an overestimation of runoff and an underestimation of interrill erosion. 457
Tillage direction was systematically determined as parallel to the longest length of the fields, 458
which appears to be reasonable. 459
This means that, even though it is probably overestimated, erosion generation was 460
much lower before the land consolidation. This is due to the very large proportion of 461
grassland within the catchment which mostly infiltrated runon and rainfall, as well as to the 462
heterogeneous pattern of small fields prevailing during this period (Fig. 2b). However, it is 463
important to note that erosion in the area was not negligible before 1965. 464
465
3.6. Comparison with Cs measurements
466 467
If we compare the erosion rates simulated by the model (taking account of 30% 468
uncertainties on erosion predictions) to the ones derived from the 137Cs measurements, we 469
observe that the erosion rates derived from the Cs measurements are in the same order of 470
magnitude, although their mean values are systematically higher than the ones derived from 471
the STREAM model outputs (Table 7). We hypothesised that water erosion dominates in 472
1 2 3 4 5 6 7 8 9 10 11 12 13 14 15 16 17 18 19 20 21 22 23 24 25 26 27 28 29 30 31 32 33 34 35 36 37 38 39 40 41 42 43 44 45 46 47 48 49 50 51 52 53 54 55 56 57 58 59 60 61
Normandy and the STREAM model simulates only this process. However, the slight 473
underestimation of erosion by modelling compared to 137Cs measurements suggests that 474
tillage erosion also needs to be taken into account if we want to reconstruct the history of 475
erosion within a catchment, at the scale of several decades. If we apply this reflection to our 476
results in the Blosseville catchment, it would mean that even though water erosion generates 477
the bulk of erosion within the catchment, tillage erosion cannot be neglected to calculate the 478
sediment budget over 40 years. Tillage erosion could even locally reach 40%. These figures 479
remain consistent with the ones reported for the whole of Europe by Van Oost et al. (2009). 480
Overall, the Cs analysis demonstrates that the soil redistribution within the catchment 481
is much higher than sediment export.Sediment delivery ratio of the catchment is indeed 482
rather low (1-10 %). Erosion rates calculated based on Cs measurements constitute local rates 483
of soil loss. In contrast, STREAM outputs provide soil losses at the outlet. This sediment is 484
exported and delivered to the river network. Local redistribution of sediment (up to 50 t ha-1 485
yr-1) exceeds by far the sediment export rate (a maximum of 4 t ha-1 yr-1 after land 486
consolidation, and even 2 t ha-1 yr-1 before the field pattern reorganisation). 487
488
3.7. General discussion and implications for landscape management
489 490
Our results clearly show that significant erosion mostly occurs when both runoff 491
potential (Table 3c) and rainfall erosivity (Fig. 3b) are the highest, which explains that 492
summer and autumn constitute the most erosive seasons in all the simulated scenarios. We 493
demonstrate the necessity to simulate entire years of rainfall (or at least a sequence of events) 494
to obtain reliable erosion predictions for a given catchment. 495
To calculate the sediment export from the catchment between 1963 (maximum of 496
radionuclide fallout due to test of thermonuclear bombs) and 2000 (period of soil coring in the 497
field), we can subdivide this period into two parts: (1) the period before land consolidation 498
(that occurred in 1965) and (2) the post-1965 period. For the first period (1963-1965), our 499
simulations give a sediment export of 206 t (given the modelled annual mean reaches 103 t 500
yr-1 and this first period covers two years; Table 6). For the second period (1965-2000), our 501
simulations give 9958 t (taking account of a mean annual erosion reaching 276.6 t yr-1). In 502
total, 10,164 t of sediment would hence have been exported from the Blosseville catchment 503
during the entire period. STREAM model outputs do not take account of tillage erosion. 504
However, even though tillage erosion mostly generates soil redistribution within the 505
catchment, it should contribute only very slightly to sediment export from the catchment. If 506
we convert the sediment export into soil loss, the mean value reaches -0.2 mm y-1 after 1965 507
1 2 3 4 5 6 7 8 9 10 11 12 13 14 15 16 17 18 19 20 21 22 23 24 25 26 27 28 29 30 31 32 33 34 35 36 37 38 39 40 41 42 43 44 45 46 47 48 49 50 51 52 53 54 55 56 57 58 59 60 61
and -0.1 mm yr-1 before this period. Over a period of 40 years, the mean soil loss would then 508
reach -9 mm (Table 6). A sediment export from a catchment corresponding to a soil layer of 509
less than 1 cm over 4 decades can seem to be low. However, when it is exported, this fertile 510
layer leads to numerous problems downstream (e.g. sedimentation in reservoirs, transport of 511
pollutants, eutrophication). Given soil cannot be regenerated at the human life scale, it is 512
important to prevent this soil loss. Consequently, on-site conservation measures should be 513
encouraged to limit soil redistribution within a catchment. 514
Furthermore, it is demonstrated that sediment exports increased by 168% after land 515
consolidation, because of the decrease in the area covered by grassland and by the increase in 516
field size (Fig. 2). Erosion is particularly important in the thalweg and close to the field 517
borders. In this context, besides on-site erosion control measures, it is important to promote 518
the installation of small-scale dams, grass buffer strips and grassed waterways along the field 519
borders or across runoff and sediment concentration pathways. These measures allow 520
buffering and releasing gradually runoff and sediment when the infiltration rates of the fields 521
are exceeded (e.g. Fiener et al., 2005; Evrard et al., 2008b). This type of mitigation measures 522
precisely allow coping with erosion during heavy rainfall, to prevent downstream damage. 523
Their installation can also be designed to protect or enhance biodiversity in areas of intensive 524
farming (e.g. Berger et al., 2003). The implementation of these measures should 525
systematically be coordinated by catchment agencies similar to the ones existing in central 526
Belgium and Normandy (e.g. Evrard et al., 2008b). 527
528
4. Conclusions 529
530
This case study in a small cultivated catchment (ca. 100 ha) of the European loess belt 531
(Normandy, France) shows that, over a period of 40 years, soil erosion is very intense within 532
the catchment. It can reach local rates of up to 50 t ha-1 yr-1. However, the bulk of erosion 533
consists of sediment redistribution within the catchment and sediment export to the river 534
network remains limited (up to 4 t ha-1 yr-1). Model simulations run for a 13-yrs rainfall 535
sequence allow outlining the increase in erosion (+ 168%) that occurred after land 536
consolidation carried out in 1965. Furthermore, the bulk of annual erosion is systematically 537
generated by thunderstorms (51-57 %) and in summer and autumn (69 – 79%). Simulations 538
also show the high variability of erosion, both throughout the year as well as from one year to 539
another. This phenomenon is due to the complex interaction between rainfall erosivity and 540
soil surface characteristics during a storm. It is hence crucial to simulate a long sequence of 541
rainfall events to investigate erosion in a catchment at the scale of several decades. 542
1 2 3 4 5 6 7 8 9 10 11 12 13 14 15 16 17 18 19 20 21 22 23 24 25 26 27 28 29 30 31 32 33 34 35 36 37 38 39 40 41 42 43 44 45 46 47 48 49 50 51 52 53 54 55 56 57 58 59 60 61
Confrontation of the model results with the erosion rates derived from Cs-137 measurements 543
suggests that water erosion may not constitute the only significant erosion process in this area. 544
Tillage erosion cannot hence be neglected to establish sediment budgets in intensively 545
cultivated catchments at the scale of several decades. An adaptation of the model to integrate 546
topographical changes due to erosion could hence be usefully envisaged. These findings 547
outline the need to apply on-site soil conservation measures to limit soil redistribution within 548
the catchment and to install buffer elements (e.g. small-scale dams, grassed waterways) 549
within the landscape to store sediment and release runoff gradually during storms to protect 550 downstream areas. 551 552 Acknowledgements 553 554
This is the LSCE contribution # X. The authors would like to thank the AREAS (Association 555
Régionale pour l’Etude et l’Amélioration des Sols) and Météo France for providing the
556
rainfall data. They also warmly thank Micheline Eimberck who introduced the LSCE 557
researchers to the erosion scientists involved in the Blosseville catchment. Stéphane Sogon 558
and Véronique Lecomte are gratefully acknowledged for the data collection in the field. 559
560
References 561
562
Auzet, A.V., Boiffin, J., Papy, F., Maucorps, J., Ouvry, J.F., 1990. An approach to the 563
assessment of erosion forms, erosion risks on agricultural land in the Northern Paris Basin, 564
France. In: Boardman J, Dearing J, Foster I (Eds.), Soil erosion on agricultural land. Wiley : 565
Chichester, pp. 384-400. 566
567
Berger, G., Pfeffer, H., Kächele, H., Andreas, S., Hoffmann, J., 2003. Nature protection in 568
agricultural landscapes by setting aside unproductive areas and ecotones within arable fields 569
(“Infield Nature Protection Spots”). Journal for Nature Conservation 11(3), 221-233. 570
571
Berger, G., Kaechele, H., Pfeffer, H. 2006. The greening of the European common 572
agricultural policy by linking the European-wide obligation of set-aside with voluntary agri-573
environmental measures on a regional scale. Environmental Science & Policy 9(6), 509-524. 574
575
Boardman, J., Evans, R., Ford, J., 2003. Muddy floods on the South Downs, southern 576
England: problem and responses. Environmental Science and Policy 6, 69-83. 577
1 2 3 4 5 6 7 8 9 10 11 12 13 14 15 16 17 18 19 20 21 22 23 24 25 26 27 28 29 30 31 32 33 34 35 36 37 38 39 40 41 42 43 44 45 46 47 48 49 50 51 52 53 54 55 56 57 58 59 60 61 578
Boardman, J., Poesen, J., 2006. Soil erosion in Europe: Major processes, causes and 579
consequences. In : Soil Erosion in Europe (ed. Boardman, J., Poesen, J.), pp. 479-487. Wiley, 580
Chichester. 581
582
Boardman, J., Verstraeten, G., Bielders, C., 2006. Muddy floods. In : Boardman, J., Poesen, J. 583
Soil Erosion in Europe. Wiley, Chichester, pp. 743-755. 584
585
Cerdan, O., Couturier, A., Le Bissonnais, Y., Lecomte, V., Souchère, V., 2002a. 586
Incorporating soil surface crusting processes in an expert-based runoff model: Sealing and 587
Transfer by Runoff and Erosion related to Agricultural Management. Catena 46, 189-205. 588
589
Cerdan, O., Le Bissonnais, Y., Souchère, V., Martin, P., Lecomte, V., 2002b. Sediment 590
concentration in interrill flow: interactions between soil surface conditions, vegetation and 591
rainfall. Earth Surface Processes Landforms 27, 193-205. 592
593
Cerdan, O., Le Bissonnais, Y., Couturier, A., Saby, N., 2002c. Modelling interrill erosion in 594
small cultivated catchments. Hydrological Processes 16(16), 3215-3226. 595
596
Evrard, O., Bielders, C.L., Vandaele, K., van Wesemael, B., 2007a. Spatial and temporal 597
variation of muddy floods in central Belgium, off-site impacts and potential control measures. 598
Catena 70, 443-454. 599
600
Evrard, O., Persoons, E., Vandaele, K., van Wesemael, B., 2007b. Effectiveness of erosion 601
mitigation measures to prevent muddy floods: A case study in the Belgian loam belt. 602
Agriculture, Ecosystems and Environment 118, 149-158. 603
604
Evrard, O., Vandaele, K., Bielders, C.L., van Wesemael, B., 2008a. Seasonal evolution of 605
runoff generation on agricultural land in the Belgian loess belt and implications for muddy 606
flood triggering. Earth Surface Processes & Landforms 33, 1285-1301. 607
608
Evrard, O., Vandaele, K., van Wesemael, B., Bielders, C.L., 2008b. A grassed waterway and 609
earthen dams to control muddy floods from a cultivated catchment of the Belgian loess belt 610
Geomorphology 100(3-4), 419-428. 611
1 2 3 4 5 6 7 8 9 10 11 12 13 14 15 16 17 18 19 20 21 22 23 24 25 26 27 28 29 30 31 32 33 34 35 36 37 38 39 40 41 42 43 44 45 46 47 48 49 50 51 52 53 54 55 56 57 58 59 60 61 612
Evrard, O., Cerdan, O., van Wesemael, B., Chauvet, M., Le Bissonnais, Y., Raclot, D., 613
Vandaele, K., Andrieux, P., Bielders, C., 2009. Reliability of an expert-based runoff and 614
erosion model: application of STREAM to different environments. Catena 78, 129-141. 615
616
Fiener, P., Auerswald, K., Weigand, S., 2005. Managing erosion and water quality in 617
agricultural watersheds by small detention ponds. Agriculture, Ecosystems & Environment 618
110(3-4), 132-142. 619
620
Gallart, F., Balasch, J.C., Regües, D., Soler, M., Castelltort, X., 2005. Catchment dynamics in 621
a Mediterranean mountain environment: the Vallcebre research basins (south eastern 622
Pyrenees) II: temporal and spatial dynamics of erosion and stream sediment transport 623
(Ch. 2). In: Garcia, C., Batalla, R. J. (Eds.), Catchment dynamics and river processes: 624
Mediterranean and other climate regions. Elsevier, pp. 17-29. 625
626
Imeson, A.C., Kirkby, M.J., 1996. Scaling up processes and models from the field plot to the 627
watershed and regional areas. Journal of Soil and Water Conservation 51(5), 391-396. 628
629
Jetten, V., Favis-Mortlock, D., 2006. Modelling soil erosion in Europe. In : Soil Erosion in 630
Europe (ed. Boardman, J., Poesen, J.), pp. 695-716. Wiley, Chichester. 631
632
Joannon, A., 2004. Coordination spatiale des systèmes de culture pour la maîtrise des 633
processus écologiques. Cas du ruissellement érosif dans les bassins versants agricoles du Pays 634
de Caux, Haute-Normandie. Unpublished PhD thesis, Institut National Agronomique Paris-635
Grignon. 636
637
Knapen, A., Poesen, J., De Baets, S., 2007a. Seasonal variations in soil erosion resistance 638
during concentrated flow for a loess-derived soil under two contrasting tillage practices. Soil 639
& Tillage Research 94(2), 425-440. 640
641
Knapen, A., Poesen, J., Govers, G., Gyssels, G., Nachtergaele, J., 2007b. Resistance of soils 642
to concentrated flow erosion: A review. Earth Science Reviews 80(1-2), 75-109. 643
644
Lana-Renault, N., Latron, J., Regues, D., 2007. Streamflow response and water-table 645
1 2 3 4 5 6 7 8 9 10 11 12 13 14 15 16 17 18 19 20 21 22 23 24 25 26 27 28 29 30 31 32 33 34 35 36 37 38 39 40 41 42 43 44 45 46 47 48 49 50 51 52 53 54 55 56 57 58 59 60 61
dynamics in a sub-Mediterranean research catchment (Central Pyrenees). Journal of 646
Hydrology 347 (3-4), 497-507. 647
648
Le Bissonnais, Y., Benkhadra, H., Chaplot, V., Fox, D., King, D., Daroussin, J., 1998. 649
Crusting, runoff and sheet erosion on silty loamy soils at various scales and upscaling from 650
m² to small catchments. Soil & Tillage Research 46, 69-80. 651
652
Le Bissonnais, Y., Cerdan, O., Lecomte, V., Benkhadra, H., Souchère, V., Martin, P., 2005. 653
Variability of soil surface characteristics influencing runoff and interrill erosion. Catena 62, 654
111-124. 655
656
Moore, I.D., Burch, B.J., Mackenzie, D.H., 1988. Topographic effects on the distribution of 657
surface soil water and the location of ephemeral gullies. Transactions of the ASAE 31(4), 658
1098-1107. 659
660
Morgan, R.P.C., 2005. Soil Erosion and Conservation. Third edition. Blackwell Publishing, 661
Oxford. 662
663
Nearing, M. A., Jetten, V., Baffaut, C., Cerdan, O., Couturier, A., Hernandez, M., Le 664
Bissonnais, Y., Nichols, M. H., Nunes, J. P., Renschler, C. S., Souchère, V., Van Oost, K., 665
2005. Modeling response of soil erosion and runoff to changes in precipitation and cover. 666
Catena 61, 131-154. 667
668
Nearing, M. A. 2006. Can soil erosion be predicted? In: Owens, P. (Ed.) Soil Erosion and 669
Sediment Redistribution in River Catchments. CABI Publishing, p. 145-152. 670
671
Papy, F., Douyer, C., 1991. Influence des états de surface du territoire agricole sur le 672
déclenchement des inondations catastrophiques. Agronomie 11, 201 – 215. 673
674
Robinson, R.A., Sutherland, W.J., 2002. Post-war changes in arable farming and biodiversity 675
in Great Britain. Journal of Applied Ecology 39 (1), 157–176. 676
1 2 3 4 5 6 7 8 9 10 11 12 13 14 15 16 17 18 19 20 21 22 23 24 25 26 27 28 29 30 31 32 33 34 35 36 37 38 39 40 41 42 43 44 45 46 47 48 49 50 51 52 53 54 55 56 57 58 59 60 61
Salles, C., Poesen, J., Sempere-Torres, D., 2002. Kinetic energy of rain and its functional 678
relationship with intensity. Journal of Hydrology 257 (1-4), 256-270. 679
680
Sogon, S., Penven, M.J., Bonté, P., Muxart, T., 1999. Estimation of sediment yield and soil 681
loss using suspended sediment load and 137Cs measurements on agricultural land, Brie 682
Plateau, France. Hydrobiologia 410, 251–61. 683
684
Souchère, V., King, D., Daroussin, J., Papy, F., Capillon, A., 1998. Effect of tillage on runoff 685
direction: consequences on runoff contributing area within agricultural catchments. Journal of 686
Hydrology 206, 256-267. 687
688
Souchère, V., King, C., Dubreuil, N., Lecomte-Morel, V., Le Bissonnais, Y., Chalat, M., 689
2003a. Grassland and crop trends: role of the European Union Common Agricultural Policy 690
and consequences for runoff and soil erosion. Environmental Science and Policy 6, 7-16. 691
692
Souchère, V., Cerdan, O., Ludwig, B., Le Bissonnais, Y., Couturier, A., Papy, F., 2003b. 693
Modelling ephemeral gully erosion in small cultivated catchments. Catena 50, 489-505. 694
695
Souchère, V., Cerdan, O., Dubreuil, N., Le Bissonnais, Y., King, C., 2005. Modelling the 696
impact of agri-environmental scenarios on runoff in a cultivated catchment (Normandy, 697
France). Catena 61 (2-3), 229-240. 698
699
Souchère, V., Sorel, L., Couturier, A., Le Bissonnais, Y., Cerdan, O., 2007. Application du 700
modèle STREAM à l‟échelle d‟un bassin versant au cours d‟un cycle hydrologique. (In 701
French). Report of the French National Institute of Agricultural Research (INRA). 702 http://www.prodinra.inra.fr/prodinra/pinra/data/2007/09/PROD2007afc2f2ca_200709070224 703 03858.pdf 704 705
Takken, I., Beuselinck, L., Nachtergaele, J., Govers, G., Poesen, J., Degraer, G., 1999. Spatial 706
evaluation of a physically based distributed erosion model (LISEM). Catena 37, 431-447. 707
1 2 3 4 5 6 7 8 9 10 11 12 13 14 15 16 17 18 19 20 21 22 23 24 25 26 27 28 29 30 31 32 33 34 35 36 37 38 39 40 41 42 43 44 45 46 47 48 49 50 51 52 53 54 55 56 57 58 59 60 61
Valentin, C., Agus, F., Alamban, R., Boosaner, A., Bricquet, J.P., Chaplot, V., de Guzman, 709
T., de Rouw, A., Janeau, J.L., Orange, D., Phachomphonh, K., Do Duy Phai, Podwojewski, 710
P., Ribolzi, O., Silvera, N., Subagyono, K., Thiébaux, J.P., Tran Duc Toan, Vadari, T., 2008. 711
Runoff and sediment losses from 27 upland catchments in Southeast Asia: Impact of rapid 712
land use changes and conservation practices. Agriculture, Ecosystems & Environment 128 713
(4), 225-238. 714
715
Van Oost, K., Govers, G., Desmet, P.J.J., 2000. Evaluating the effects of changes in landscape 716
structure on soil erosion by water and tillage. Landscape Ecology 15, 577-589. 717
718
Van Oost, K., Van Muysen, W., Govers, G., Deckers, J., Quine, T.A., 2005. From water to 719
tillage erosion dominated landform evolution. Geomorphology 72 (1-4), 193-203. 720
721
Van Oost, K., Cerdan, O., Quine, T.A., 2009. Accelerated sediment fluxes by water and 722
tillage erosion on European agricultural land. Earth Surface Processes & Landforms 34 (12), 723
1625-1634. 724
725
Walling, D.E., He, Q., 1997. Models for converting 137Cs measurements to estimates of soil 726
redistribution rates on cultivated and uncultivated soils (uncluding software for model 727
implementation). A contribution to the I.A.E.A. co-ordinated research programmes on soil 728
erosion (D1.50.05) and sedimentation (F3.10.01).
729 730
Walling, D.E., Russell, M.A., Hodgkinson, R.A., Zhang, Y., 2002.Establishing sediment 731
budgets for two small lowland agricultural catchments in the UK. Catena 47(4), 323-353. 732
733
World Reference Base, 1998. World Reference Base for Soil Resources. FAO, World 734
Resources Report n°84, Rome, Italy. 735
736 737
Table 1. Monthly characteristics of rainfall in Blosseville. Blosseville
(1992-2006)
Rain(mm) Rainy days
________________________________________________________________________________________________________________ January 70 19 February 56 17 March 53 15 April 62 16 May 58 14 June 58 12 July 50 13 August 59 14 September 74 16 October 99 19 November 81 20 December 100 20 Year 818 ± 120 193 ± 29 (mean ± SD) Table 1
Table 2. Coordinates of the gravity centres of the rainfall groups as classified by the k-means clustering.
Rainfall group RA (mm) RD (h) ARA48h (mm) Imax-5min (mm/h)
___________________________________________________________________________________________________
Low intensity rainfall on dry soils (n=1462) 4 5 3 8
Low intensity rainfall on wet soils (n=382) 6 6 21 11
Thunderstorms (n=104) 15 5 7 48
___________________________________________________________________________________________________
RA is the rainfall amount; RD is the total rainfall duration; ARA48h is the antecedent rainfall amount during the 48h before the event; Imax-5min is
the 5-min maximum rainfall intensity.
Table 2
Table 3. Classification of runoff /interrill erosion risk for the common crops in Upper Normandy, and associated STREAM input parameters (steady-state infiltration rates – Iα – and potential sediment concentration – SCα).
(a) Soil surface characteristics (*)
Crop October November December January February March April May June July August September
Winter cereals C1-F0-R2 C1-F11-R1 C1-F12-R0 C1-F2-R0 C1-F2-R0 C2-F2-R0 C3-F2-R0 C3-F2-R0 C3-F2-R0 C3-F2-R0 C2-F2-R0 C1-F2-R0
Sowing Soil crusting Soil crusting Harvest
Early spring crops C2-F2-R0 C2-F2-R0 C2-F2-R0 C1-F0-R4 C1-F11-R3 C1-F0-R2 C2-F0-R1 C3-F12-R1 C3-F12-R0 C3-F2-R0 C3-F2-R0 C2-F2-R0
Sowing Soil crusting Soil crusting Soil crusting Harvest
Late spring crops C3-F2-R0 C3-F2-R0 C3-F2-R0 C3-F2-R0 C3-F2-R0 C3-F2-R0 C1-F0-R2 C1-F0-R2 C1-F11-R1 C2-F2-R0 C3-F2-R0 C3-F2-R0
Harvest Sowing Soil crusting Soil crusting Soil crusting
(b) Risk quantification
I α (mm/h) SC α (g/l)
Very low risk > 25 1 - 10 Soil crusting depends on rainfall depth after sowing (mm)
Low risk 15 - 25 10 - 15 F0 > F11 28
Medium risk 5 - 15 15 - 25 F11 > F12 115
High risk 1 - 5 25 - 35 F12 > F2 225
(c) Runoff risk
Crop October November December January February March April May June July August September
Winter cereals
Early spring crops
Late spring crops
(d) Interrill erosion risk
Crop October November December January February March April May June July August September
Winter cereals
Early spring crops
Late spring crops
(*) The following soil surface characteristics are documented for each field:
- Soil surface roughness state (height difference between the deepest part of micro-depressions and the lowest point of their divide). R0: 0-1 cm; R1: 1-2 cm; R2: 2-5 cm; R3: 5-10 cm; R4: > 10 cm;
- Crop cover classes (defined after the soil surface percentage covered by canopy or litter). C1: 0-20%; C2: 21 – 60%; C3: 61-100%;
- Soil surface crusting stage. F0: initial fragmentary structure; F11: altered fragmentary state with structural crusts; F12: local appearance of depositional crusts; F2:
continuous state with depositional crusts.
Table 3
Table 4. Total erosion at the outlet simulated by the STREAM model for the different land use scenarios [(a) after land consolidation and (b) before land consolidation] for all the rainfall events of the period 1992-2006 (n=1948).
(a) Crop pattern after land consolidation
Month Erosion (t) % of total Mean erosion per storm ___________________________________________________ January 160 4.3 8 February 318 8.6 24 March 69 1.9 5 April 1.2 0 0 May 111 3.0 7 June 108 2.9 7 July 204 5.5 11 August 732 19.8 46 September 727 19.7 25 October 406 11.0 9 November 217 5.9 7 December 643 17.4 17 _______________________________________________________ Annual mean (t yr-1) 276.6 Standard deviation 76.3
(b) Crop pattern before land consolidation
Month Erosion (t) % of total Mean erosion per storm ___________________________________________________ January 65 4.7 4 February 219 16.0 18 March 41 3.0 5 April 1 0.0 0 May 43 3.2 11 June 57 4.2 7 July 143 10.5 10 August 262 19.2 11 September 219 16.1 8 October 38 2.8 8 November 58 4.2 7 December 217 15.9 6 _______________________________________________ Annual mean (t yr-1) 103.0 Standard deviation 44.6 Table 4