HAL Id: ird-00544302
https://hal.ird.fr/ird-00544302
Submitted on 7 Dec 2010
HAL is a multi-disciplinary open access
archive for the deposit and dissemination of sci-entific research documents, whether they are pub-lished or not. The documents may come from teaching and research institutions in France or abroad, or from public or private research centers.
L’archive ouverte pluridisciplinaire HAL, est destinée au dépôt et à la diffusion de documents scientifiques de niveau recherche, publiés ou non, émanant des établissements d’enseignement et de recherche français ou étrangers, des laboratoires publics ou privés.
Molecular insight into the population structure of
common and spotted dolphins inhabiting the pelagic
waters of the Northeast Atlantic
Sophie Quérouil, L. Freitas, I. Cascao, F. Alves, A. Dinis, J. R. Almeida, R.
Prieto, S. Borras, J. A. Matos, D. Mendonca, et al.
To cite this version:
Sophie Quérouil, L. Freitas, I. Cascao, F. Alves, A. Dinis, et al.. Molecular insight into the population structure of common and spotted dolphins inhabiting the pelagic waters of the Northeast Atlantic. Marine Biology, Springer Verlag, 2010, 157 (11), pp.2567-2580. �10.1007/s00227-010-1519-0�. �ird-00544302�
Molecular insight on the population structure of common and spotted
dolphins inhabiting the pelagic waters of the Northeast Atlantic
Running title: High gene flow in oceanic dolphins
Sophie Quérouil1,2*, Luís Freitas3, Irma Cascão1, Filipe Alves3, Ana Dinis3, Joana R. Almeida1, Rui Prieto1, Silvia Borràs2, José A. Matos2,4, Diogo Mendonça2 & Ricardo S. Santos1
1 Instituto do Mar (IMAR), Departamento de Oceanografia e Pescas da Universidade dos Açores, Cais Santa Cruz, 9901-862 Horta, Portugal.
2 Instituto Nacional de Recursos Biológicos (INRB), GBM-Grupo de Biologia Molecular, Edifício S - 1º andar, Estrada do Paço do Lumiar 22, 1649-038 Lisboa, Portugal.
3 Museu da Baleia da Madeira - Rua da Pedra d'Eira, 9200-031 Caniçal, Madeira, Portugal. 4 BioFIG - Center for Biodiversity, Functional and Integrative Genomics, Campo Grande, 1749-016 Lisboa, Portugal.
* corresponding author, present address: IRD, UR175 – CAVIAR, Gamet, 361 rue Jean-François Breton, BP5095, F-34196 Montpellier, France, Tel/Fax: +33 (0)4.67.04.63.36 /+33 (0)4.67.16.64.40, sophie.querouil@ird.fr.
Abstract
Several cetacean species exhibit fine-scale population structure despite their high dispersal capacities and the apparent continuity of the marine environment. In dolphins, most studies have focused on coastal areas and continental margins, and they revealed differentiated populations within relatively small geographic areas, sometimes in conjunction with a specialization for different habitats (ecotypes). We analysed the population genetic structure of short-beaked common dolphins (Delphinus delphis) and Atlantic spotted dolphins (Stenella frontalis) in the Azores and Madeira, the two most isolated archipelagos of the North Atlantic. The archipelago of the Azores is divided into three groups of islands and stands 900 km away from Madeira. It is not known whether individuals migrate between groups of islands and archipelagos, nor whether distinct ecotypes are present. These questions were investigated by genetic analyses of 343 biopsy samples collected on free-ranging dolphins. The analyses consisted in sequencing part of the mitochondrial hyper-variable region, screening up to 14 microsatellite loci, and molecular sexing. Results did not unravel any population structure at the scale of the study area. Lack of differentiation matches expectations for spotted dolphins, which are transient in both archipelagos, but not for common dolphins, which are present year-round in the Azores and potentially resident. Absence of genetic structure over hundreds and even thousands of kilometres implies the existence of gene flow over much larger distances than usually documented in small delphinids, which could be achieved through individual movements. This finding indicates that population structure in oceanic habitat differs from that observed in coastal habitat.
Introduction
In the face of global warming and increasing anthropological pressure, conservation of marine ecosystems has become one of the major concerns of this century. Cetaceans, as long-lived top predators, are particularly vulnerable (cf. Simmonds and Hutchinson 1996). Their conservation is considered a priority at the international level (e.g. the CITES Convention, Washington, 1973; the Bern and Bonn Conventions, 1979; the European Union Habitats Directive, 1992). The definition of conservation policies requires previous knowledge on stock structure. Nowadays, molecular genetic techniques are commonly used to identify conservation units and estimate gene flow between demes (cf. Mills and Allendorf 1996; Frankham et al. 2002). Such techniques have revealed fine-scale population structure in various cetacean species, in spite of the large size and high dispersal capacities of these animals (Hoelzel et al. 2002). Population differentiation can occur over a few dozen or hundreds of kilometres, as a result of isolation by distance (e.g. western Australian bottlenose dolphins, Tursiops sp., Krützen et al. 2004), tight social structure (e.g. South Pacific spinner dolphins, Stenella longirostris, Oremus et al. 2007) or ecological specialisation in relation with habitat features (e.g. killer-whales, Orcinus orca, Hoelzel et al. 1998a; common bottlenose dolphins, Tursiops truncatus, Hoelzel et al. 1998b; Natoli et al. 2004, pantropical spotted dolphins, Stenella attenuata, Escorza-Treviño et al. 2005). In the latter case, forms specialised for different habitats (called “ecotypes”) are often both genetically and morphologically differentiated (e.g. Hoelzel et al. 1998a,b). For instance, in common bottlenose dolphins, coastal forms tend to be resident and form small groups (Connor 2000), and populations are differentiated over small geographic distances (Sellas et al. 2005; Parsons et al. 2006). On the contrary, offshore forms of common bottlenose dolphins tend to be transient, form large groups (Connor 2000), and maintain high gene flow over wide geographic areas (Quérouil et al. 2007). It is likely that other species exhibit similar patterns, but very little information is available on the population structure of dolphins in pelagic environment, especially in distant offshore regions.
The present study focuses on the two most isolated archipelagos of the North Atlantic Ocean: the Azores and Madeira. These archipelagos are situated 1500 km and 580 km away from the mainland, respectively, and separated by 900 kilometres of deep waters. They are characterised by an absence of continental slope and the occurrence of deep waters at short distance from the coast with scattered seamounts (Santos et al. 1995; Caldeira et al. 2002; Morato et al. 2008). The existence of large stretches of deep waters between islands suggests that populations may be differentiated between groups of islands and archipelagos. Distinct ecotypes can be expected to occur in nearshore vs. offshore waters given that ecotype differentiation is widespread amongst delphinids in other parts of the world.
The archipelagos of the Azores and Madeira host more than 20 species of cetaceans (Gonçalves et al. 1996; Santos-Reis and Mathias 1996). The most abundant species are the short-beaked common dolphin, Delphinus delphis, Linnaeus 1758, the Atlantic spotted dolphin, Stenella frontalis (Cuvier 1829) and the common bottlenose dolphin (Silva et al. 2003; Freitas et al. 2004). Whilst the genetic structure of the latter species was studied recently in the Azores and Madeira (Quérouil et al. 2007); there is virtually no information available on the stock structure of the former two species in that region. Preliminary data indicate that the common dolphin is resident in the Azores, but its abundance fluctuates seasonally (Quérouil et al. 2008). In Madeira, it occurs only in winter and spring (Freitas et al. 2004). The spotted dolphin is a seasonal visitor in both archipelagos, where it is present essentially during summer months (Freitas et al. 2004; Quérouil et al. 2008). The common dolphin seems to prefer coastal waters, while the spotted dolphin tends to prefer deep offshore waters (Silva et al. 2003; Freitas et al. 2004). Little information exists on the seasonal movements and stock structure of these species in the pelagic waters of the North Atlantic,
and it is not known whether the individuals ranging in both archipelagos belong to the same stock. Further information is needed to define management and conservation policies regarding these two important cetacean species in the Macaronesian region (Azores, Madeira and Canary Islands).
In common dolphins, two species are presently recognized: the short-beaked common dolphin, D. delphis, and the long-beaked common dolphin, D. capensis (Heyning and Perrin 1994; Rosel et al. 1994). In the North Atlantic, a wide spectrum of beak lengths encompassing those of D. delphis and D. capensis is present along the northern West African coast (Pinela et al. 2008). North of the 25th parallel, all common dolphins are considered to be of the short-beaked type (Pinela et al. 2008), even though in the Azores, individuals resembling long-beaked common dolphins in colour pattern and rostrum length are occasionally sighted (Azorean team, unpublished data). The short-beaked common dolphin has a world-wide distribution and can be found in both coastal and offshore waters, from tropical to temperate latitudes. Molecular and morphological data indicate that there is at least one population of D. delphis on each side of the North Atlantic (Westgate 2005, 2007; Murphy et al. 2006; Natoli et al. 2006; Mirimin et al. 2009). Body size and rostrum robustness differ between the eastern and western North Atlantic, and a few populations of the eastern North Atlantic appear to be morphologically differentiated from the others (Murphy et al. 2006). Mitochondrial and nuclear DNA analyses indicate genetic differentiation between the eastern and western North Atlantic, and little or no population structure within each region (Natoli et al. 2006; Mirimin et al. 2009). Apart from a few common dolphin samples that were included in a large-scale mitochondrial DNA study (Natoli et al. 2006), there is no information on population structure in the mid-Atlantic.
Atlantic spotted dolphins, S. frontalis, are endemic to warm temperate and tropical waters of the Atlantic. Two morphotypes have been described within this species: a larger, more heavily spotted form occurring in continental shelf waters, and a smaller, less spotted form occurring in pelagic waters and around oceanic islands (Perrin et al. 1987). Both forms can be found in the western North Atlantic, where they appear to be genetically differentiated based on mitochondrial and nuclear DNA markers (Adams and Rosel 2006). In the Azores and Madeira, spotted dolphins are expected to belong to the smaller form, although no formal study has examined the possibility that the larger form is also present. Information is missing on the population structure of S. frontalis over most of its distributional range apart from the western North Atlantic (Adams and Rosel 2006).
We used a combination of mitochondrial DNA (mtDNA) sequences and microsatellite markers to test predictions about the population structure of common and spotted dolphins around the oceanic islands of the Azores and Madeira. We searched for genetic differentiation between groups of islands and archipelagos, as well as between potential ecotypes. We expected to find some differentiation between groups of islands and archipelagos in common dolphins, given that this species is present all year round in the Azores and tends to prefer coastal waters. In contrast, we predicted an absence of genetic structure within and between archipelagos in spotted dolphins, given that this species is a seasonal visitor in both archipelagos and tends to prefer offshore waters.
Material and methods
Study sites
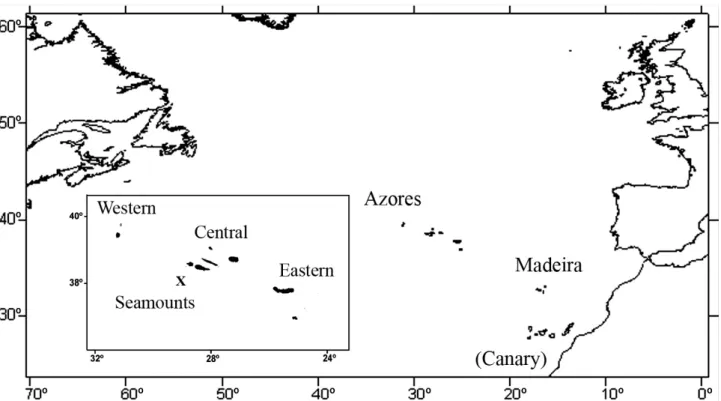
The archipelago of the Azores is located in the North Atlantic Ocean, about 1500 km away from the nearest coast (Fig. 1). It lies between the 37th and 41st northern parallels and the 25th
and 31st western meridians, extending more than 480 km along a Northwest-Southeast axis and crossing the Mid-Atlantic Ridge. It is composed of nine volcanic islands divided into three groups (the eastern, central and western groups) separated by deep waters (ca. 2000 m) with scattered seamounts (Santos et al. 1995; Morato et al. 2008). Shallow waters (< 200m) occur only at very short distances from the coast. Most field work was conducted in the central group of islands (from the harbour of Horta - 38.53°N and 28.63°W). Cruises to other islands were conducted in order to cover the entire archipelago.
The archipelago of Madeira is located in the North Atlantic Ocean, 580 km West of Morocco, Africa (Fig. 1). It is separated from the Azores by 900 km of deep waters. It is composed of two main volcanic islands, Madeira and Porto Santo, which are separated by a stretch of 35 km with a maximum depth of 3000 m. It also comprises two sub-archipelagos, Desertas Islands and Selvagens Islands, located 11 km Southeast and 300 km South of Madeira, respectively. Fieldwork was conducted on the southern coast of Madeira and West of the Desertas Islands (from the harbour of Machico - 32.73°N and 16.73°W).
Sample collection and DNA extraction
Skin samples were collected either by biopsy darting (a 125-lb Barnett crossbow, with darts and tips specially designed for small cetaceans by F. Larsen, Ceta-Dart, cf. Mathews et al. 1988) or by skin swabbing. The second method was employed in the Azores only and for a small number of samples (n = 31). Although less invasive, it generated stronger reaction by the dolphins (such as boat avoidance, jumps and leaps), especially in D. delphis. In addition, 16% of the samples obtained by this method did not contain enough tissue for DNA analyses. Most samples were from adult-size individuals, even though 10 to 30 % were probably from immature individuals. In the Azores, samples were obtained during summer 2004 to 2006 in all three groups of islands and around seamounts located 40 km south of the central group. All D. delphis samples were from individuals of the typical short-beaked type. In Madeira, samples were collected year-round between 2004 and 2006. Due to the seasonal occurrence of each species, samples of D. delphis were obtained between January and June and samples of S. frontalis between June and November. Most fieldwork was done within 10 km from the coast of the main island. Thus, the sampling scheme did not allow examining population structure within the archipelago. Four additional samples were obtained from individuals that stranded on the coast of Madeira between 1997 and 2006.
All samples were stored in 90 % ethanol. They were processed at the INETI, Lisbon, Portugal. DNA extractions were performed following the protocol of Gemmel & Akiyama (1996) or using the DNeasy tissue isolation kit (Qiagen) following the manufacturer’s recommendations. About 1-2 mm3 of skin were minced and rinsed in dd-water prior to extraction. Digestion by recombinant proteinase K was extended overnight at 56°C.
Mitochondrial DNA sequences
Acquisition of sequences
Part of the tRNA-Thr, the tRNA-Pro and the most variable part of the mitochondrial D-loop were amplified using the primers Dloop-16L (Hoelzel et al. 1991) and H00034 (Rosel et al. 1994). For 24 S. frontalis samples, a longer fragment was obtained with the primers Dloop-16L and Dloop-19H (Hoelzel et al. 1991). Longer sequences were used to assess the impact of using shorter sequences on haplotype diversity. They were truncated before subsequent analyses.
PCR reactions were carried out in a 25 µl volume using 0.75 units of Taq DNA polymerase (MBI Fermentas) and 2mM MgCl2. The number of cycles was set to 35 and the annealing temperature to 52°C. PCR products were purified with the GFX PCR DNA purification kit (Amersham Biosciences). Sequencing was done on an ABI-prism capillary sequencer (Applied Biosystems) by Macrogen, Korea. All samples were sequenced with the 16L primer, using an annealing temperature of 55°C. Four randomly chosen samples per species were also sequenced with the reverse primer and no ambiguities were found. All sequences were double-checked for errors. Sequences were deposited in GenBank, under accession numbers EF682507 to EF682840. Alignment was performed visually. Three gaps were identified in D. delphis and four in S. frontalis. Aligned sequences were 611 base pair (bp) long in both species.
Population structure
Population structure was analysed using Arlequin 3.1 (Excoffier et al. 2005). Gene diversity (H) and nucleotide diversity (π) were calculated for each archipelago. Shared haplotypes between archipelagos were identified. Genetic distances between and within archipelagos were estimated using the Tamura-Nei formula (Tamura and Nei 1993). Corrected distances accounting for intra-population variability were also calculated. In order to estimate whether the populations had undergone a size and/or range expansion, we computed the mismatch distributions within each archipelago and the intermatch distribution between archipelagos (following Excoffier 2004). We verified whether the populations from the Azores and Madeira were behaving as a single one by searching for significant correlations between the three distributions by means of Spearman’s rank tests. Two demes belonging to the same range expansion are expected to have similar mismatch distributions, which closely overlap with the intermatch (Excoffier 2004). We also performed Fu’s test of neutrality (Fu 1997), which is the most powerful test to detect population growth when sample size is large (c.a. 50 individuals or more; Ramos-Onsins and Rozas 2002). Significance was estimated using a coalescence simulation algorithm with 10,000 randomization steps. It was considered significant at P < 0.02, as recommended by the author.
Genetic differentiation among potential populations was assessed taking into account nucleotide differences between haplotypes (ΦST, Weir and Cockerham 1984), after correction by the Tamura-Nei formula (1993). Because male-biased dispersal (as often happens in cetacean species; Hoelzel et al. 2002) could obscure the geographical pattern of female-transmitted mtDNA (Tiedemann et al. 2000), ΦST was measured for all samples and for females only. Significance was assessed by a permutation procedure (10,000 permutations). A sequential Bonferroni correction was applied to compensate for multiple tests (Rice 1989). Populations with less than five samples were not considered (namely, D. delphis from the eastern group of Azorean islands, n = 2). Attempts were made to calculate asymmetric estimates of migration rates (Nm) between populations under a maximum likelihood framework using Migrate 2.0 (Beerli 2004). Despite our efforts to achieve convergence through long runs and multiple chains requiring several weeks of computation, acceptance ratios were low, mixing was poor and convergence between runs was limited. Thus, the process was abandoned.
Haplotype networks
We investigated the phyletic relationships between haplotypes using network-building methods. These methods are especially efficient for intra-specific comparisons, when genetic distances between individuals are small and the number of equally parsimonious connections
is high (Templeton et al. 1992; Crandall 1996). We used the Median Joining approach (MJ), implemented by the software Network4 (Bandelt et al. 1999). The homoplasy parameter (ε) was set to zero. Two weighting schemes were compared: 1/ equal weight for all classes of changes, and 2/ weight of 10 for transitions and 30 for transversions and gaps, as recommended by the authors for a tenfold difference in mutation rates between substitution classes.
Microsatellites and molecular sexing
Data acquisition
Fourteen polymorphic dinucleotide microsatellite loci were analysed: d08, d22 (Shinohara et al. 1997), EV14, EV37 (Valsecchi and Amos 1996), FCB1, FCB17 (Buchanan et al. 1996), Kwm2a, Kwm12a, Kwm9b (Hoelzel et al. 1998b), Mk6, Mk8 (Krützen et al. 2001), Sw10, Sw19 (Richard et al. 1996) and TexVet5 (Rooney et al. 1999). Loci TexVet5 and Kwm2a were not analysed in S. frontalis because they failed to amplify. PCR reactions were performed in multiplex whenever possible, using 25 cycles and a touch-down decrease in annealing temperatures (0.1°C per cycle): Sw10 and Sw19 (52 → 49.5°C); EV14 (56 → 53.5°C); FCB1, FCB17 and EV37 (56 → 53.5°C); d22, Mk6 and Mk8 (56 → 53.5°C); TexVet5 (49.5 → 47°C); Kwm2a (49.5 → 47°C); d08, Kwm12a and Kwm9b (57 → 54.5°C). Fragments were scanned on an ABI 310 capillary sequencer using the size marker ROX350 (Applied Biosystems). Molecular sexing was performed by co-amplification of a short fragment of the male-specific SRY gene (CSY, 157 bp, Abe et al. 2001) and a tetranucleotide microsatellite used as a PCR control for positive identification of females (GATA028, 99/103 bp, Palsbøll et al. 1997). Unsuccessful PCR reactions were repeated up to three times. DNA extraction and genotyping were repeated whenever a sample was found not to amplify or to be homozygous at more than three loci. Samples that could not be re-analysed successfully were removed from the data set. In order to make sure that samples obtained by skin swabbing were correctly genotyped, we compared the proportion of homozygous loci in both kinds of samples by means of a two-sided non parametric Mann and Whitney U-test for unpaired samples. The skin swabbing samples appeared to be no more homozygous than the biopsy samples (exact P = 0.495 for D. delphis and 0.913 for S. frontalis).
Polymorphism control
Genotypes were checked for potential errors and replicated individuals using Microsatellite Tools (MsTools, Park 2001). Five potential replicates were identified: two differing by one allele and three with identical genotypes. Otherwise, the highest matching score between distinct individuals was 64.3 % of allelic identity for D. delphis and 68.2 % for S. frontalis. Extraction and genotyping were repeated for all potential replicates, and perfect matching was found for all pairs of samples. Thus, the initial error rate was 1.5% for these ten samples. One sample per pair was removed from all datasets prior to analyses.
For each archipelago, polymorphism was estimated as the number of alleles per locus, observed heterozygosity (HO) and unbiased expected heterozygosity (HE), using Arlequin 3.1. Departure from Hardy-Weinberg frequencies was tested by an exact test using Genepop on the Web (http://genepop.curtin.edu.au/index.html; Genepop 3.3 by Raymond and Rousset 1995) with default settings. A sequential Bonferroni correction was applied to compensate for multiple tests (Rice 1989). Null allele frequencies were estimated under the hypothesis that all the deviation to Hardy-Weinberg Equilibrium (HWE) was due to null alleles, using Cervus 2.0 (Marshall et al. 1998). For loci with a high estimated frequency of null alleles, 20 randomly chosen homozygote samples were re-analysed. The second amplification confirmed
the initial diagnostic in all cases. Finally, we verified that loci were not in linkage disequilibrium using Arlequin 3.1, applying a sequential Bonferroni correction.
Population structure
Inbreeding coefficients (FIS) were calculated for each archipelago, and their significance evaluated by a randomisation procedure (10,000 permutations), using Genetix 4.03 (Belkhir et al. 2001). Global FIS was also calculated over all samples, as a means to evaluate the hypothesis that individuals from the Azores and Madeira belonged to the same population. As recent fluctuations in population size could affect genetic population structure, we tested for the existence of a significant excess or deficit of heterozygosity in each archipelago using the program Bottleneck 1.2 (Cornuet and Luikart 1996). A significant excess of heterozygosity (or "gene diversity") is expected under a situation of recent bottleneck, while a significant deficiency is expected under population expansion. Significance was evaluated by the Wilcoxon sign-rank test. Simulations were based on the Two Phase Model of evolution of microsatellites (TPM, DiRienzo et al. 1994), with default parameters. This choice was justified by the fact that only half of the loci seemed to conform to the uni- or bi-modal distribution of allele sizes expected under the Stepwise Mutation Model (SMM, Ohta and Kimura 1973). Other loci presented multimodal distributions and/or large gaps in allele sizes, more in agreement with the Infinite Allele Model (IAM, Kimura and Crow 1964) or the Two Phase Model (TPM, DiRienzo et al. 1994).
The influence of allele size on population differentiation was tested by the allele size permutation test implemented in SPAGeDi 1.2d (Hardy and Vekemans 2002). It is noteworthy that, although RST is designed especially for microsatellites and accounts for differences in allele sizes, FST is more reliable than RST when sample size is limited (Gaggiotti et al. 1999) and when gene flow is high (Balloux and Goudet 2002). As allele size did not contribute to population differentiation (P = 0.877 for D. delphis and 0.165 for S. frontalis), differentiation among potential populations was estimated based on the IAM model (FST, Weir and Cockerham 1984) using FSTAT 2.9.3 (Goudet 2001). Its significance was tested by an exact G-test (Goudet et al. 1996) and a 95% confidence interval (95% CI) was obtained by bootstrapping over loci. Because sex biased dispersal could impede detecting population structure in the phylopatric sex, we searched for a difference in FST between males and females using the randomisation procedure implemented in FSTAT 2.9.3. Finally, as for mitochondrial DNA, attempts were made to calculate asymmetric estimates of migration rates between populations using Migrate 2.0, and the process was abandoned.
We examined the possibility of an undetected population structure, potentially associated with ecotype differentiation, using the software Structure 2.1 (Pritchard et al. 2000). We carried out MCMC simulations with no prior information on the origin of samples, using the admixture model. The maximum number of populations (K) was assumed to vary between 1 and 10. For each potential value of K, five replications were performed, with a number of steps equal to 100,000 for the burnin process and 1,000,000 for the simulations. The probability that a given value of K was the best one was calculated based on mean ln Pr(X/K), following the recommendations of the authors. As simulations have shown that ln Pr(X/K) did not always peak at the actual value of K, we also determined the most likely value of K following the procedure described by Evanno and collaborators (2005). These authors recommend using the mode of the distribution of ΔK, a statistic based on the variability and rate of change of ln Pr(X/K) between successive values of K. A ΔK of at least 25 can be expected at the true K for a hierarchical island model with about 20 individuals per sub-population, under partial sampling of populations and using as little as 5 microsatellite loci
(Fig. 4F in Evanno et al. 2005). It is noteworthy that this statistic cannot be calculated for the lowest or highest value of K (here, K = 1 or 10).
We tested for the effect of geographic distances on population structure by means of a Mantel test. A significant correlation can be expected when dispersal distances are short compared to population range. Given the difficulty of defining geographic boundaries and the high mobility of dolphins, we performed the test at the individual level, using Alleles In Space 1.0 (AIS; Miller 2005). The genetic distance implemented in AIS is an analogue of Nei's distance (Nei et al. 1983) applied to pairs of individuals. Log-transformed geographic distances were used to account for the two-dimensional distribution of the sampling locations. Significance was assessed by 10,000 permutations.
Because haplotypes clustered in distinct groups separated by large genetic distances (cf. result section), we suspected that haplotype groups could represent distinct ecotypes or populations. A Molecular Analysis of Variance (AMOVA) was performed to determine how microsatellite diversity was partitioned between these haplotype groups, using Arlequin 3.1 (Excoffier et al. 2005).
Results
Duplicated samples and sex ratio
In total, 150 D. delphis and 193 S. frontalis samples were successfully analysed. Search for duplicated samples revealed five cases of perfect matching, all of which originated from the central group of islands of the Azores. In D. delphis, one female was sampled twice on successive days, 5 km away from the place where she had been sampled initially; one male was sampled twice at four days interval and 14 km of distance, and another male at one year interval and 18 km of distance. In S. frontalis, one male and one female were sampled twice during the same sighting. The final number of different individuals analysed was 147 for D. delphis and 191 for S. frontalis (Table 1).
Molecular sexing indicated a sampling bias in favour of males in both species (Table 1). Bias was very high in Madeira, where a male to female ratio of 8.3:1 was measured for D. delphis and 3.3:1 for S. frontalis. In the Azores, the male to female ratio was 1.7:1 for D. delphis and 1.3:1 for S. frontalis. The factors causing unbalanced sex-ratio were discussed in a recent paper (Quérouil et al. 2010).
Mitochondrial DNA sequences
Variability
Sequencing of short fragments (611 bp) rather than long fragments (1003 bp) of the D-loop resulted in a loss of 8.3 % in the number of distinct haplotypes identified out of 24 S. frontalis samples (19 haplotypes instead of 21).
In D. delphis, there were 36 distinct haplotypes out of 91 samples from the Azores and 31 haplotypes out of 52 samples from Madeira (four samples from Madeira could not be sequenced). There were 45 variable nucleotide positions in the Azores, 53 in Madeira, and 60 in the whole dataset. Gene diversity was 0.953 in the Azores and 0.975 in Madeira, and nucleotide diversity was 0.013 in both archipelagos.
In S. frontalis, there were 76 distinct haplotypes out of 144 samples from the Azores and 35 haplotypes out of 46 samples from Madeira (one sample from Madeira could not be
sequenced). There were 72 variable nucleotide positions in the Azores, 63 in Madeira, and 84 in the whole dataset. Gene diversity was 0.974 in the Azores and 0.990 in Madeira, and nucleotide diversity was 0.018 in both archipelagos.
Population structure within and between archipelagos
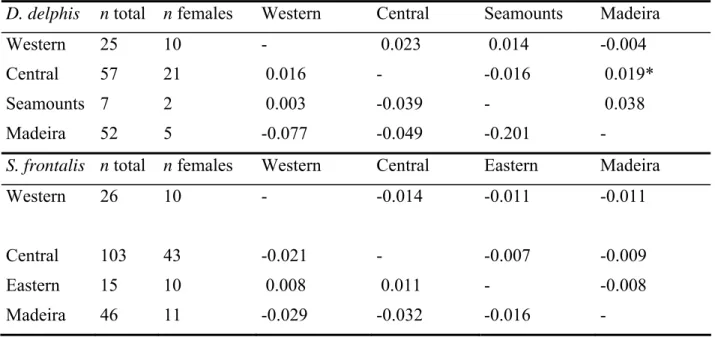
In D. delphis, 13 haplotypes were shared between the two archipelagos. Mean Tamura-Nei distances were similar within (7.78 % for the Azores and 8.07 % for Madeira) and between archipelagos (8.01 %). The mean distance between archipelagos was 0.08 % after correction for intra-population polymorphism. There was no significant differentiation between the two archipelagos both for the complete sample (ΦST = 0.010, P = 0.080) and for females only (ΦST = -0.067, P = 0.948). In S. frontalis, 19 haplotypes were shared between the two archipelagos. The mean Tamura-Nei distance was similar within (11.02 % for the Azores and 10.79 % for Madeira) and between archipelagos (10.83 %). The mean distance between archipelagos was -0.07 % after correction for intra-population polymorphism. There was no significant differentiation between the two archipelagos either for the complete sample (ΦST = -0.007, P = 0.856) or for females only (ΦST = -0.028, P = 0.918). When the Azores were subdivided into groups of islands, fixation indexes indicated a lack of population differentiation between all sampling sites in both species after application of a Bonferroni correction, both for the complete sample and for females only (Table 2).
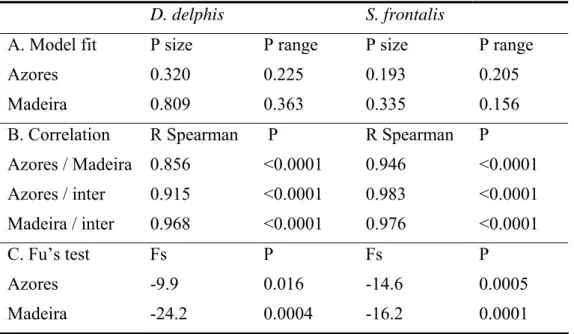
In each species and archipelago, the mismatch distribution was not significantly different from that expected following either a population size expansion or a range expansion model (Table 3). The mismatch distributions obtained for the Azores and Madeira were significantly correlated one with the other and with the intermatch between archipelagos (Fig. 2, Table 3). The three distributions were almost perfectly overlapping in S. frontalis. Fu’s test of neutrality was significant in each species and archipelago (Table 3).
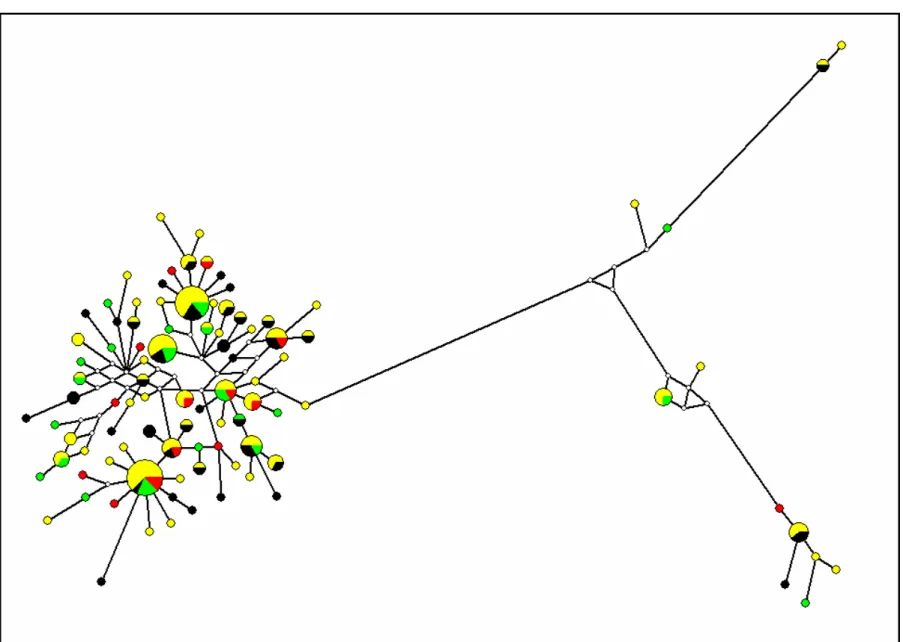
In both species, haplotypes clustered independently of sampling location in the Median Joining networks (Fig. 3A and 3B). The application of differential weights did not significantly alter the phyletic relationships between haplotypes. In D. delphis, various “satellite” haplotypes were separated by large genetic distances from the main core of closely related haplotypes. In S. frontalis, a single cluster of “satellite” haplotypes was separated from the main core by a very large genetic distance.
Microsatellites
Variability and HWE
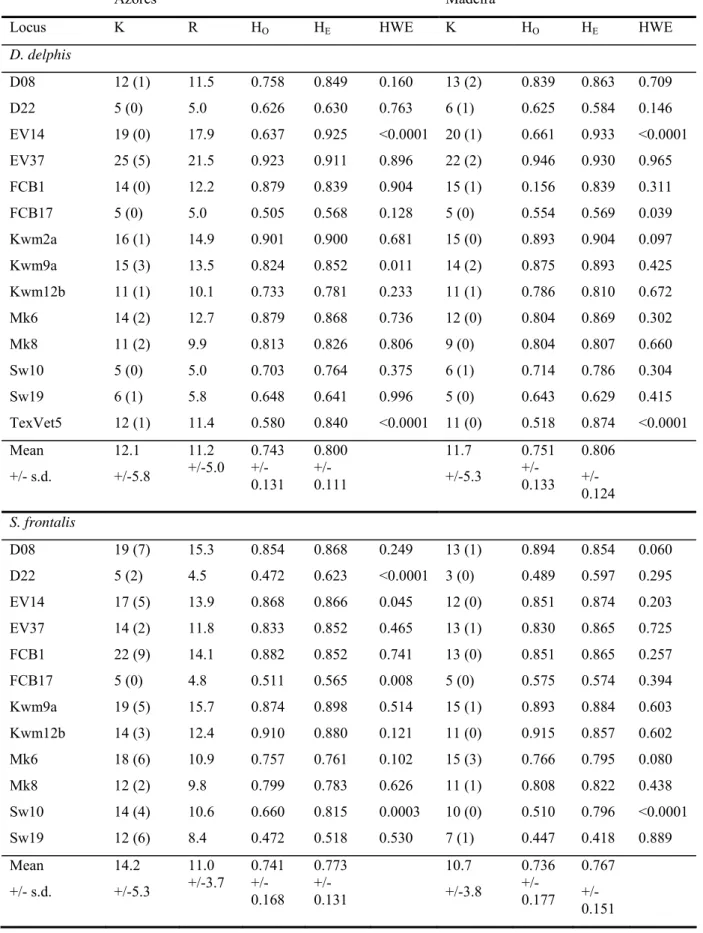
The selected loci presented high levels of allelic diversity and heterozygosity (Table 4). For the whole dataset, allelic diversity ranged between 5 and 27 in D. delphis (mean = 12.9 +/- s.d. = 6.1) and between 5 and 22 in S. frontalis (mean = 14.3 +/-5.4). Variability at each locus differed between species. After correction for sample size, allelic richness was similar in both populations. Private alleles were found in at least one of the two populations at all loci but one. In D. delphis, private alleles were scored once, twice, or exceptionally three times. In S. frontalis, most private alleles were rare, but one was scored seven times in the largest population. Two loci per species appeared not to be in HWE after application of a sequential Bonferroni correction (Table 4): EV14 and TexVet5 in D. delphis (in both archipelagos) and d22 and Sw10 in S. frontalis (in the Azores only for d22). Locus TexVet5 had already been shown not to be in HWE in D. delphis (Natoli et al. 2006). The unbalanced loci presented a high estimated proportion of null alleles, ranging from 9 to 25.3% depending on species and
location. Therefore, they were removed from the datasets for subsequent analyses. There was no linkage disequilibrium between the remaining loci in either species.
Population structure within and between archipelagos
Within each population, the inbreeding coefficients calculated over all loci were not significant, except for D. delphis in the Azores (D. delphis: FIS = 0.025, P = 0.032 for the Azores and FIS = 0.015, P = 0.175 for Madeira; S. frontalis: FIS = 0.011, P = 0.169 for the Azores and FIS < 0.001, P = 0.471 for Madeira). The global inbreeding coefficient calculated over all samples and loci was significant for D. delphis (FIS = 0.023, P = 0.013), but not for S. frontalis (FIS = 0.007, P = 0.230). In both species, there was no significant heterozygosity excess or deficit neither in the Azores nor in Madeira (Wilcoxon two-tailed test, D. delphis: P = 0.204 for the Azores and P = 0.110 for Madeira; S. frontalis: P = 0.492 for the Azores and P = 0.695 for Madeira). The allele frequency distributions were L-shaped, as expected in stable populations.
Fixation indexes revealed a lack of differentiation between the Azores and Madeira in both species (D. delphis: FST = 0.002, 95% CI = [0; 0.004], P = 0.108; S. frontalis: FST = -0.002 [-0.003; 0.002], P = 0.891). When the Azores were subdivided into groups of islands, FST-values were not significant after application of a sequential Bonferroni correction (Table 5). Furthermore, FST-values were not significantly different between males and females in either species (D. delphis: P = 0.563, S. frontalis: P = 0.084).
The AMOVA performed on haplotype groups revealed that most of the microsatellite variance was found within haplotype groups (98.96 % in D. delphis, 100 % in S. frontalis). FST-values were low and not significant (D. delphis: FST = 0.010, P = 0.084; S. frontalis: FST = -0.0004, P = 0.528), indicating that microsatellite diversity tended to be higher within than among haplotype groups.
Individual-based Mantel tests were not significant in either species (r = 0.016, P = 0.100 in D. delphis; and r = -0.016, P = 0.767 in S. frontalis).
In both species, Bayesian analyses failed to uncover any cryptic population structure. The highest values of ln Pr(X/K) were obtained for K = 1 (P almost equal to 1 in each species). The distribution curves of ΔK were bimodal, and the highest ΔK-values were obtained for K = 2 in D. delphis (ΔK = 8.28) and K = 3 in S. frontalis (ΔK = 3.17). These values were below the threshold of 25 expected for distinct populations. When population assignments were conducted with K = 2 or 3, repsectively, the proportion of samples assigned to each population was roughly symmetric (close to 1/K) and no individual was strongly assigned to any population.
Discussion Variability
Mitochondrial and nuclear DNA diversities were high and in the same range as those previously reported in short-beaked common dolphins (Natoli et al. 2006; Amaral et al. 2007b; Mirimin et al. 2009) and oceanic populations of Atlantic spotted dolphins (Adams and Rosel 2006). Such high values are typical of large panmictic populations (Frankham et al. 2002). In both species, mtDNA analyses revealed one main cluster of closely related haplotypes and some very distantly related “satellite” haplotypes (Fig. 3A and 3B). These clades were not differentiated at the nuclear-DNA level. Similarly, highly divergent clades of
haplotypes are commonly observed in large migratory fishes (e.g. blue marlins, Makaira nigricans: McDowell et al. 2007, and bigeye tunas, Thunnus obesus: Gonzalez et al. 2008) and in marine mammals (Hoelzel et al. 2002), including common dolphins of the North Atlantic (Amaral et al. 2007b; Mirimin et al. 2009). They are generally explained by inter-oceanic vicariance during the last Pleistocene maxima, followed by uni- or bi-directional dispersal. In the present case, two alternative hypotheses are also possible: incomplete lineage sorting associated with retention of past polymorphism or introgressive hybridization occurring between D. delphis and S. coeruleoalba (cf. Amaral et al. 2007a) or between the two species of spotted dolphins.
Absence of population structure within and between archipelagos
Mitochondrial and nuclear DNA analyses pointed towards a lack of genetic population structure at the scale of the study area in both species. In fact, clustering of mtDNA haplotypes was independent of the geographical origin of samples (Fig. 3A and 3B). Fixation indexes based on mitochondrial and nuclear DNA indicated a lack of population structure (Tables 2 and 5) that was not the fate of higher male dispersal. Individual-based Mantel tests performed on microsatellite data did not show any significant effect of isolation by distance. Bayesian analyses performed on unassigned individuals failed to uncover any cryptic population structure. The mismatch and intermatch mt-DNA distributions were significantly correlated in both species and almost perfectly overlapping in S. frontalis (Fig. 2), indicating that the populations of the Azores and Madeira behaved as a single population.
The star-shape mt-DNA haplotype networks, large significant negative Fs-values, and mismatch distributions were suggestive of population size and/or range expansions. On the other hand, tests of microsatellite heterozygosity excess or deficit revealed no effect of recent fluctuations in population size. These latter two results are not inconsistent since mitochondrial DNA keeps track of older events than nuclear DNA. At least, it seems that failure to identify any population structure was not caused by a recent change in population size. There was also no evidence of sex-biased dispersal that could have obscured population structure in the most phylopatric sex. Genetic differentiation was in the same order of magnitude for mt-DNA sequences (female transmission) and microsatellites (biparental inheritance) within each species. There were also no significant differences in sex-specific measures of genetic differentiation between archipelagos based on either kind of marker. In the case of D. delphis, this could have been caused by the limited number of female samples from Madeira, but results were consistent with previous studies that shown no sex-biased dispersal at the scale of the Atlantic in that species (Natoli et al. 2006; Mirimin et al. 2009). It cannot be ruled out that the analyses overlooked weak population structure associated with low allelic differentiation. However, similar studies based on the same mitochondrial gene and almost the same set of microsatellite loci were able to detect differentiation in D. delphis in other regions (Bilgmann et al. 2008; Natoli et al. 2008) or in other species (e.g. in Tursiops sp.: Hoelzel et al. 1998b; Krützen et al. 2004). Even though it was not possible to obtain reliable estimates of the amount of gene flow, our results indicated that gene flow was sufficient to prevent differentiation within and between archipelagos in common and spotted dolphins at the scale of the study area. In fact, poor mixing and lack of convergence between runs should be expected under weak differentiation.
Lack of population structure was unexpected in the short-beaked common dolphin, because this species occurs year-round in the Azores and tends to prefer nearshore waters. Notwithstanding, the observed pattern agrees with previous studies indicating high gene flow over large geographic distances at the scale of the North Atlantic in this species (Natoli et al. 2006; Mirimin et al. 2009). It cannot be ruled out that failure to detect any population
structure in D. delphis was caused by low levels of divergence associated with recent population differentiation following the last glacial maximum. Actually, the significant inbreeding coefficients obtained for the whole sample and within the Azores suggest that populations are not at the mutation-drift equilibrium, not panmictic, or undergoing selection. Deviation from panmixia could be caused by a Wahlund effect, i.e. the existence of undetected sub-populations. In the Azores, it is possible that there are resident and non-resident individuals who do not fully interbreed. It is noteworthy that genotyping revealed three cases of re-sampling of common dolphins that occurred within a small geographic range and with a time interval of up to one year. These events indicate some degree of site fidelity, and suggest that there might be resident individuals in the Azores. Residency has been shown to be associated with population differentiation in other species (e.g., bottlenose dolphins of the species T. aduncus in Australia, Möller and Beheregaray 2004; spinner dolphins in the South Pacific, Oremus et al. 2007). However, in the Azores, no population differentiation was found in T. truncatus despite the existence of known resident individuals (Quérouil et al. 2007; Silva et al. 2008). The extent of differentiation might depend on the proportion of individuals that are resident. A more detailed genetic study would possibly reveal population differentiation and seasonal variations in D. delphis population structure within the Azores. In the Atlantic spotted dolphins, lack of population structure could be expected, given that they are temporary visitors in the Azores and Madeira and tend to prefer offshore waters. Although spotted dolphins occur in both archipelagos during the same period of the year (Freitas et al. 2004; Quérouil et al. 2008), it is likely that the individuals frequenting the Azores and Madeira belong to the same population. Interestingly, the observed pattern contrasts with the population structure existing in the western Atlantic, where oceanic and coastal populations can be distinguished (Adams and Rosel 2006). This discrepancy is likely due to differences in habitat structure, related to the presence of a continental shelf in the western Atlantic.
Conclusions
Mitochondrial and nuclear DNA did not evidence any genetic structure among common and spotted dolphins of the Azores and Madeira, neither between archipelagos nor between groups of islands nor in relation with habitat features. Similar genetic patterns were observed in both species, independently of their patterns of residency and ecological preferences. Spotted dolphins are temporary visitors in the Azores and Madeira, and it can be hypothesised that they undertake large migrations within and outside the study area. Common dolphins are seasonal visitors in Madeira, but present year-round in the Azores, where some individuals may be resident. We recommend that a long-term study is conducted to investigate seasonal and local population differentiation in D. delphis, especially within the archipelago of the Azores.
Absence of genetic structure over hundreds and even thousands of kilometres implies the existence of gene flow over much larger distances than usually documented in small delphinids (e.g., Natoli et al. 2004; Escorza-Treviño et al. 2005; Parsons et al. 2006; Oremus et al. 2007). It has long been controversial whether such amounts of gene flow could be achieved through individual long-distance movements. In coastal areas, dolphin movements are usually at the scale of a few dozens kilometres (cf. Gowans et al. 2007). In common dolphins of the North Atlantic, lack of population structure within the eastern and western basins suggested that individuals might undergo long-distance migration movements (Mirimin et al. 2009). In the Azores, high levels of gene flow were found in bottlenose dolphins of the species T. truncatus (Quérouil et al. 2007), and a photo-identification study revealed that some individuals travel between groups of islands and probably come from
outside the archipelago (Silva et al. 2008). In the eastern tropical Pacific, capture-recapture data showed that dolphins of the genus Stenella can travel more than 1000 km, and seasonal shifts in distributions suggested that movements could be as wide as 2500 km (Reilly 1990). Spotted dolphins probably undergo such long-distance movements in the study area. It is likely that small delphinids have very large ranges in pelagic waters due to low productivity, variations in water surface temperatures, and their consequences on prey distribution and availability (cf. Gowans et al. 2007). Oceanic dolphin population structure seems to parallel that of other top predators, which are capable of trans-oceanic movements across the Atlantic Ocean (e.g. large migratory fishes such as blue marlins and big eyed tunas: McDowell et al. 2007; Gonzalez et al. 2008).
We recommend that common and spotted dolphins frequenting the Azores and Madeira are provisionally considered as members of one single conservation unit within each species. These conservation units, characterised by high levels of genetic diversity and large population sizes, are probably not threatened in the short term. However, it appears that long term conservation policies regarding these and other large migratory species shall be considered on a global scale. Ocean-wide international regulations are necessary in order to avoid depletion of fish stocks and other marine resources, limit pollution, and ensure sustainable conservation in the North Atlantic.
Acknowledgements
Authors are very grateful to the Portuguese Foundation for Science and Technology (FCT) and the FEDER program for funding the GOLFINICHO project (POCI/BIA-BDE/61009/2004), S.Q.'s post-doctoral grants (IMAR/FCT- PDOC-006/2001-MoleGen and
SFRH/BPD/19680/2004), I.C.'s investigation assistant grants (IMAR/FCT/GOLFINICHO/001/2005 and IMAR/FCT/GOLFINICHO/004/2006), and I.C. and R.P.’s doctoral grants (SFRH/BD/41192/2007 and SFRH/BD/32520/2006). They also acknowledge FCT for its pluri-annual funding to Research Unit #531 and the EU funded program Interreg IIIb for funding the MACETUS project (MAC/4.2/M10). They wish to thank all the students and staff who contributed to these projects, with special thanks to J. Wiszniewski and the skippers (P. Martins, V. Rosa, R. Bettencourt, N. Serpa, H. Viera and J. Viveiros), whose dexterity greatly facilitated sample collection. Thanks are also due to R. Medeiros for help with ArcGis. Samples were obtained under sampling permits 06/CN/2002, 11/CN/2003, 3/CN/2004 and 7/CN/2005 of the Environment Directorate of the Regional Government of the Azores, and Of. 668/04 Inf 711/04 DAC/DSCN, Credential nº 103-107/2006/CAPT from the Instituto de Conservação da Natureza. The experiments comply with the current Portuguese laws.
References
Abe H, Goto M, Pastene LA (2001) Practical use of multiplex fluorescent PCR for Cetacean sex identification. Mar Mamm Sci 17 (3): 657-664
Adams LD, Rosel PE (2006) Population differentiation of the Atlantic spotted dolphin (Stenella frontalis) in the western North Atlantic, including the Gulf of Mexico. Mar Biol 148: 671-681
Amaral AR, Sequeira M, Coelho MM (2007a) A first approach to the usefulness of cytochrome c oxydase I barcode in the identification of closely related delphinid cetacean species. Mar Freshw Res 58: 505-510
Amaral AR, Sequeira M, Martinez-Cedeira J, Coelho MM (2007b) New insights on population genetic structure of Delphinus delphis from the northeast Atlantic and phylogenetic relationships within the genus inferred from two mitochondrial markers. Mar Biol 151: 1967-1976
Balloux F, Goudet J (2002) Statistical properties of population differentiation estimators under stepwise mutation in a finite island model. Mol Ecol 11: 771-783
Bandelt HJ, Forster P, Röhl A (1999) Median-joining networks for inferring intraspecific phylogenies. Mol Biol Evol 16: 37-48
Beerli P (2004) Migrate Version 2.0: documentation and program, part of LAMARC, pp Distributed over the Internet: http://evolution.gs.washington.edu/lamarc.html
Belkhir K, Borsa P, Chikhi L, Raufaste N, Bonhomme F (2001) Genetix, a Windows software for population Genetics. Laboratoire Génome, Populations, Interactions, CNRS UPR 9060, Université de Montpellier II, Montpellier, France
Bilgmann K, Möller LM, Harcourt RG, Gales R, Beheregaray LB (2008) Common dolphins subject to fisheries impacts in Southern Australia are genetically differentiated: implications for conservation. Anim Conserv 11: 518-528
Buchanan F, Friesen M, Littlejohn R, Clayton J (1996) Microsatellites from the beluga whale (Delphinapterus leucas). Mol Ecol 5: 571-575
Caldeira RMA, Groom S, Miller P, Pilgrim D, Nezlin NP (2002) Sea-surface signatures of the island mass effect phenomena around Madeira Island, Northeast Atlantic. Remote Sens Environ 80: 336-360
Connor RC (2000) Group living in whales and dolphins. In: Mann J, Connor RC, Tyack PL, Whitehead H (eds) Cetacean societies Field studies of dolphins and whales. The University of Chicago Press, Chicago
Cornuet JM, Luikart G (1996) Description and power analysis of two tests for detecting recent population bottlenecks from allele frequency data. Genetics 144: 2001-2014 Crandall KA (1996) Multiple interspecies transmissions of human and simian T-cell
leukemia/lymphoma virus type I sequences. Mol Biol Evol 13: 115-131
DiRienzo A, Peterson AC, Garza JC, Valdes AM, Slatkin M, Freimer NB (1994) Mutational processes of simple-sequence repeat loci in human populations. Proc Natl Acad Sci USA 91: 3166-3170
Escorza-Treviño S, Archer FI, Rosales M, Lang A, Dizon AE (2005) Genetic differentiation and intraspecific structure of Eastern Tropical Pacific spotted dolphins, Stenella attenuata, revealed by DNA analyses. Conserv Genet 6: 587-600
Evanno G, Regnaut S, Goudet J (2005) Detecting the number of clusters of individuals using the software STRUCTURE: a simulation study. Mol Ecol 14: 2611-2620
Excoffier L (2004) Patterns of DNA sequence diversity and genetic structure after a range expansion: lessons from the infinite-island model. Mol Ecol Notes 13: 853–864
Excoffier L, Laval G, Schneider S (2005) Arlequin ver. 3.0: An integrated software package for population genetics data analysis. Evol Bioinformatics Online 1: 47-50
Frankham R, Ballou JD, Briscoe DA (2002) Introduction to conservation genetics. Cambridge University Press, Cambridge
Freitas L, Alves F, Dinis A, Nóbrega F (2004) Relatório dos resultados científicos. Projecto para a conservação dos cetáceos no Arquipélago da Madeira (Project report).
Fu Y-X (1997) Statistical tests of neutrality of mutations against population growth, hitchhiking and background selection. Genetics 147: 915–925
Gaggiotti OE, Lange O, Rassmann K, Gliddon C (1999) A comparison of two indirect methods for estimating average levels of gene flow using microsatellite data. Mol Ecol 8: 1513-1520
Gemmel NJ, Akiyama S (1996) An efficient method for the extraction of DNA from vertebrate tissues. Trends Genet 12: 338-339
Gonçalves JM, Barreiros JP, Azevedo JN, Norberto R (1996) Cetaceans stranded in the Azores during 1992-96. Arquipelago 14A: 57-65
Gonzalez EG, Beerli P, Zardoya R (2008) Genetic structuring and migration patterns of Atlantic bigeye tuna, Thunnus obesus (Lowe, 1839). BMC Evol Biol 8: 252
Goudet J (2001) FSTAT, a program to estimate and test gene diversities and fixation indices (version 2.9.3). Available from http://www.unil.ch/izea/softwares/fstat.html
Goudet J, Raymond M, Demeeus T, Rousset F (1996) Testing differentiation in diploid populations. Genetics 144: 1933-1940
Gowans S, Würsig B, Karczmarski L (2007) The social structure and strategies of Delphinids: predictions based on an ecological framework. Adv Mar Biol 53: 195-294
Hardy OJ, Vekemans X (2002) SPAGeDI: a versatile computer program to analyse spatial genetic structure at the individual or population levels. Mol Ecol Notes 2: 618-620 Heyning JE, Perrin WF (1994) Evidence for two species of common dolphins (genus
Delphinus) from the eastern North Pacific. Contrib Sci 442: 1-35
Hoelzel AR, Dahlheim M, Stern SJ (1998a) Low genetic variation among killer whales (Orcinus orca) in the Eastern North Pacific and genetic differentiation between foraging specialists. J Hered 89: 121-128
Hoelzel AR, Goldsworthy SD, Fleischer RC (2002) Population genetic structure. In: Hoelzel AR (ed) Marine mammal biology. Blackwell Science Ltd, Oxford, UK
Hoelzel AR, Hancock JM, Dover GA (1991) Evolution of the cetacean mitochondrial D-loop region. Mol Biol Evol 8: 475-493
Hoelzel AR, Potter CW, Best PB (1998b) Genetic differentiation between parapatric 'nearshore' and 'offshore' populations of the bottlenose dolphin. Proc R Soc Lond B Biol Sci 265: 1177-1183
Kimura M, Crow JF (1964) The number of alleles that can be maintained in a finite population. Genetics 61: 893-903
Krützen M, Sherwin WB, Berggren P, Gales N (2004) Population structure in an inshore cetacean revealed by microsatellite and mtDNA analysis: bottlenose dolphins (Tursiops sp.) in Shark Bay, Western Australia. Mar Mamm Sci 20: 28-47
Krützen M, Valsecchi E, Connor RC, Sherwin WB (2001) Characterization of microsatellite loci in Tursiops aduncus. Mol Ecol Notes 1: 170-172
Marshall TC, Slate J, Kruuk L, Pemberton JM (1998) Statistical confidence for likelihood-based paternity inference in natural populations. Mol Ecol 7: 639-655
Mathews EA, Keller S, Weiner DB (1988) A method to collect and process skin biopsies for cell culture from the free-ranging gray whales (Eschrichtius robustus). Mar Mamm Sci 4: 1-12
McDowell JR, Carlsson JEL, Graves JE (2007) Genetic analysis of blue marlin (Makaira nigricans) stock structure in the Atlantic Ocean. Gulf and Caribbean Research 19: 75-82
Miller MP (2005) Alleles In Space (AIS): computer software for the joint analysis of interindividual spatial and genetic information. J Hered 96: 722-724
Mills LS, Allendorf FW (1996) The one-migrant-per-generation rule in conservation and management. Conserv Biol 10: 1509-1518
Mirimin L, Westgate A, Rogan E, Rosel P, Read A, Coughlan J, Cross T (2009) Population structure of short-beaked common dolphins (Delphinus delphis) in the North Atlantic Ocean as revealed by mitochondrial and nuclear genetic markers. Mar Biol 156: 821-834
Möller LM, Beheregaray LB (2004) Genetic evidence for sex-biased dispersal in resident bottlenose dolphins (Tursiops truncatus). Mol Ecol 13: 1607-1612
Morato T, Machete M, Kitchingman A, Tempera F, Lai S, Menezes G, Pitcher TJ, Santos RS (2008) Abundance and distribution of seamounts in the Azores. Mar Ecol Prog Ser 357: 17-21
Murphy S, Herman JS, Pierce GJ, Rogan E, Kitchener AC (2006) Taxonomic status and geographical cranial variation of common dolphins (Delphinus) in the Eastern North Atlantic. Mar Mamm Sci 22: 573-599
Natoli A, Cañadas A, Vaquero C, Politi E, Fernandez-Navarro P, Hoelzel AR (2008) Conservation genetics of the short-beaked common dolphin (Delphinus delphis) in the Mediterranean Sea and in the eastern North Atlantic Ocean. Conserv Genet 9: 1479-1487
Natoli A, Peddemors VM, Aguilar A, Vaquero C, Fernàndez-Piqueras P, Hoelzel AR (2006) Phylogeography and alpha taxonomy of the common dolphin (Delphinus sp.). J Evol Biol 19: 943-954
Natoli A, Peddemors VM, Hoelzel AR (2004) Population structure and speciation in the genus Tursiops based on microsatellite and mitochondrial DNA analyses. J Evol Biol 17: 363-375
Nei M, Tajima F, Tateno Y (1983) Accuracy of estimated phylogenetic trees from molecular data. II. Gene frequency data. J Mol Evol 19: 153-170
Ohta T, Kimura M (1973) The model of mutation appropriate to estimate the number of electrophoretically detectable alleles in a genetic population. Genetic Research 22: 201-204
Oremus M, Poole MM, Steel D, Baker CS (2007) Isolation and interchange among insular spinner dolphin communities in the South Pacific revealed by individual identification and genetic diversity. Mar Ecol Prog Ser 336: 275-289
Palsbøll PJ, Bérubé M, Larsen AH, Jorgensen H (1997) Primers for the amplification of tri- and tetramer microsatellite loci in baleen whales. Mol Ecol 6: 893-895
Park SDE (2001) Trypanotolerance in West African cattle and the population genetic effects of selection. PhD dissertation. PhD dissertation, Dublin, Ireland
Parsons KM, Durban JW, Claridge DE, Herzing DL, Balcomb KC, Noble LR (2006) Population genetic structure of coastal bottlenose dolphins (Tursiops truncatus) in the Northern Bahamas. Mar Mamm Sci 22: 276-298
Perrin WF, Mitchell ED, JG M, Caldwell DK, Caldwell MC, van Bree PJH, Dawbin WH (1987) Revision of the spotted dolphins, Stenella sp. . Mar Mamm Sci 3: 99-170 Pinela AM, Aguilar A, Borrell A (2008) Occurrence of long-beaked and short-beaked forms
of Delphinus spp. off NW Africa appears to reflect differential use of habitat rather than taxonomy. IWC report
Pritchard JK, Stephens M, Donnelly P (2000) Inference of population structure using multilocus genotype data. Genetics 155
Quérouil S, Freitas L, Dinis A, Alves F, Cascão I, Prieto R, Silva MA, Magalhães S, Matos JA, Santos RS (2010) Sex bias in biopsy samples collected from free-ranging dolphins. Eur J Wildl Res 56: 151–158
Quérouil S, Silva MA, Cascão I, Magalhães S, Seabra MI, Machete MA, Santos RS (2008) Why do dolphins form mixed-species associations in the Azores? Ethology 114: 1183-1194
Quérouil S, Silva MA, Freitas L, Prieto R, Magalhães S, Dinis A, Alves F, Matos JA, Mendonça D, Hammond P, Santos RS (2007) High gene flow in oceanic bottlenose dolphins (Tursiops truncatus) of the North Atlantic. Conserv Genet 8: 1405-1419 Ramos-Onsins SE, Rozas J (2002) Statistical properties of new neutrality tests against
population growth Mol Biol Evol 19: 2092–2100
Raymond M, Rousset F (1995) Genepop (version 1.2), population genetics software for exact tests and ecumenicism. J Hered 86: 248-249
Reilly SB (1990) Seasonal changes in distribution and habitat differences among dolphins in the eastern tropical Pacific. Mar Ecol Prog Ser 66: 1-11
Rice WR (1989) Analysing tables of statistical tests. Evolution 43: 223-225
Richard KR, Whitehead H, Wright JM (1996) Polymorphic microsatellites from sperm whales and their use in the genetic identification of individuals from naturally sloughed pieces of skin. Mol Ecol 5: 313-315
Rooney AP, Merritt DB, Derr JN (1999) Microsatellite diversity in captive bottlenose dolphins (Tursiops truncatus). J Hered 90: 228-231
Rosel PE, Dizon AE, Heyning JE (1994) Genetic analysis of sympatric morphotypes of common dolphins (genus Delphinus). Mar Biol 119: 159-167
Santos-Reis M, Mathias ML (1996) The historical and recent distribution and status of mammals in Portugal. Hystrix 8: 75-89
Santos RS, Hawkins S, Monteiro LR, Alves M, Isidro EJ (1995) Case studies and reviews: Marine research, resources and conservation in the Azores. Aquat Conserv 5: 311–354 Sellas AB, Wells RS, Rosel PE (2005) Mitochondrial and nuclear DNA analyses reveal fine
scale geographic structure in bottlenose dolphins (Tursiops truncatus) in the Gulf of Mexico. Conserv Genet 6: 715-728
Shinohara M, Domingo-Roura X, Takenaka O (1997) Microsatellites in the bottlenose dolphin Tursiops truncatus. Mol Ecol 6: 695-696
Silva MA, Prieto R, Magalhães S, Cabecinhas R, Cruz A, Gonçalves JM, Santos RS (2003) Occurrence and distribution of cetaceans in the waters around the Azores (Portugal), Summer and Autumn 1999-2000. Aquat Mammal 29: 77-83
Silva MA, Prieto R, Magalhães S, Seabra MI, Santos RS (2008) Ranging patterns of bottlenose dolphins living in oceanic waters: implications for population structure. Mar Biol 156: 179–192
Simmonds MP, Hutchinson JD (1996) The conservation of whales and dolphins: Science and practice. J. Wiley & Sons, Chichester, UK
Tamura K, Nei M (1993) Estimation of the number of nucleotide substitutions in the control region of mitochondrial DNA in humans and chimpanzees. Mol Biol Evol 10: 512-526
Templeton AR, Crandall KA, Sing CF (1992) A cladistic analysis of phenotypic associations with haplotypes inferred from restriction endonuclease mapping and DNA sequence data. III. Cladogram estimation. Genetics 132: 619-633
Tiedemann R, Hardy O, Vekemans X, Milinkovitch MC (2000) Higher impact of female than male migration on population structure in large mammals. Mol Ecol 9: 1159-1163 Valsecchi E, Amos W (1996) Microsatellite markers for the study of cetacean populations.
Mol Ecol 5: 151-156
Weir BS, Cockerham CC (1984) Estimating F-statistics for the analysis of population structure. Evolution 38: 1358-1370
Westgate AJ (2005) Population structure and life history of short-beaked common dolphins (Delphinus delphis) in the North Atlantic. PhD dissertation, Durham, NC
Westgate AJ (2007) Geographic variation in cranial morphology of short-beaked common dolphins (Delphinus delphis) from the North Atlantic. J Mammal 88: 678-688
Figure 1. Map of the archipelagos of the Azores and Madeira within the North Atlantic Ocean, with enlarged map of the Azores showing the three groups of islands and the seamounts (localized by an X).
Figure 2. Mismatch distribution of pairwise differences between D-loop sequences of D. delphis (A) and S. frontalis (B) within the Azores (open triangles) and Madeira (open circles) and intermatch between archipelagos (plain diamonds).
A B 0% 2% 4% 6% 8% 10% 12% 14% 0 5 10 15 20 25 30 35 Azores Madeira Inter 0% 2% 4% 6% 8% 10% 12% 14% 0 2 4 6 8 10 12 14 16 18 20 Azores Madeira Inter
Figure 3A. Median Joining networks obtained with differential weighting of transitions, transversions and indels, for D-loop sequences of
D. delphis from the Azores (red = eastern, yellow = central, green = western, pink = seamounts) and Madeira (black). Circle size is proportional
to the number of samples and connector length is proportional to the number of substitutions. Small open circles represent potential intermediate haplotypes that were not sampled.
Figure 3B. Median Joining networks obtained with differential weighting of transitions, transversions and indels, for D-loop sequences of
Table 1. Number of distinct individuals analysed per species, sex, group of islands and archipelago.
Archipelago Azores Madeira Total
Island group Western Central Eastern Seamounts All -- -- D. delphis males females total 15 10 25 36 21 57 1 1 2 5 2 7 57 34 91 50 6* 56* 107 40 147 S. frontalis males females total 16 10 26 60 43 103 5 10 15 0 0 0 81 63 144 36* 11* 47* 117 74 191 * four samples originated from stranded animals: one female D. delphis, two males and one female S. frontalis.
Table 2. Population differentiation and gene flow between groups of islands of the archipelago of the Azores and Madeira based on 611 bp-long D-loop sequences: ΦST (above diagonal: complete dataset; below diagonal: females only) with number of sequenced individuals (n) and level of significance (*: 0.01 < P < 0.05).
D. delphis n total n females Western Central Seamounts Madeira
Western 25 10 - 0.023 0.014 -0.004
Central 57 21 0.016 - -0.016 0.019*
Seamounts 7 2 0.003 -0.039 - 0.038
Madeira 52 5 -0.077 -0.049 -0.201 -
S. frontalis n total n females Western Central Eastern Madeira
Western 26 10 - -0.014 -0.011 -0.011
Central 103 43 -0.021 - -0.007 -0.009
Eastern 15 10 0.008 0.011 - -0.008
Table 3. Test of population expansion in each species and archipelago: A. goodness of fit to a model of population size or range expansion; B. correlation between the observed mismatch distributions within the Azores and Madeira and the intermatch (inter) distribution between archipelagos (Spearman’s rank test, n = 21 for D. delphis and 39 for S. frontalis); C. Fu’s test of neutrality.
D. delphis S. frontalis
A. Model fit P size P range P size P range
Azores 0.320 0.225 0.193 0.205
Madeira 0.809 0.363 0.335 0.156
B. Correlation R Spearman P R Spearman P Azores / Madeira 0.856 <0.0001 0.946 <0.0001 Azores / inter 0.915 <0.0001 0.983 <0.0001 Madeira / inter 0.968 <0.0001 0.976 <0.0001 C. Fu’s test Fs P Fs P Azores -9.9 0.016 -14.6 0.0005 Madeira -24.2 0.0004 -16.2 0.0001
Table 4. Locus-specific information: allelic diversity (K, with number of private alleles between parentheses), allelic richness for the largest population based on sample size of the smallest population (R), observed (HO) and expected (HE) heterozygosity, and probability of departure from Hardy-Weinberg Equilibrium within each population (HWE, P-value).
Azores Madeira
Locus K R HO HE HWE K HO HE HWE
D. delphis D08 12 (1) 11.5 0.758 0.849 0.160 13 (2) 0.839 0.863 0.709 D22 5 (0) 5.0 0.626 0.630 0.763 6 (1) 0.625 0.584 0.146 EV14 19 (0) 17.9 0.637 0.925 <0.0001 20 (1) 0.661 0.933 <0.0001 EV37 25 (5) 21.5 0.923 0.911 0.896 22 (2) 0.946 0.930 0.965 FCB1 14 (0) 12.2 0.879 0.839 0.904 15 (1) 0.156 0.839 0.311 FCB17 5 (0) 5.0 0.505 0.568 0.128 5 (0) 0.554 0.569 0.039 Kwm2a 16 (1) 14.9 0.901 0.900 0.681 15 (0) 0.893 0.904 0.097 Kwm9a 15 (3) 13.5 0.824 0.852 0.011 14 (2) 0.875 0.893 0.425 Kwm12b 11 (1) 10.1 0.733 0.781 0.233 11 (1) 0.786 0.810 0.672 Mk6 14 (2) 12.7 0.879 0.868 0.736 12 (0) 0.804 0.869 0.302 Mk8 11 (2) 9.9 0.813 0.826 0.806 9 (0) 0.804 0.807 0.660 Sw10 5 (0) 5.0 0.703 0.764 0.375 6 (1) 0.714 0.786 0.304 Sw19 6 (1) 5.8 0.648 0.641 0.996 5 (0) 0.643 0.629 0.415 TexVet5 12 (1) 11.4 0.580 0.840 <0.0001 11 (0) 0.518 0.874 <0.0001 Mean +/- s.d. 12.1 +/-5.8 11.2 +/-5.0 0.743 +/-0.131 0.800 +/-0.111 11.7 +/-5.3 0.751 +/-0.133 0.806 +/-0.124 S. frontalis D08 19 (7) 15.3 0.854 0.868 0.249 13 (1) 0.894 0.854 0.060 D22 5 (2) 4.5 0.472 0.623 <0.0001 3 (0) 0.489 0.597 0.295 EV14 17 (5) 13.9 0.868 0.866 0.045 12 (0) 0.851 0.874 0.203 EV37 14 (2) 11.8 0.833 0.852 0.465 13 (1) 0.830 0.865 0.725 FCB1 22 (9) 14.1 0.882 0.852 0.741 13 (0) 0.851 0.865 0.257 FCB17 5 (0) 4.8 0.511 0.565 0.008 5 (0) 0.575 0.574 0.394 Kwm9a 19 (5) 15.7 0.874 0.898 0.514 15 (1) 0.893 0.884 0.603 Kwm12b 14 (3) 12.4 0.910 0.880 0.121 11 (0) 0.915 0.857 0.602 Mk6 18 (6) 10.9 0.757 0.761 0.102 15 (3) 0.766 0.795 0.080 Mk8 12 (2) 9.8 0.799 0.783 0.626 11 (1) 0.808 0.822 0.438 Sw10 14 (4) 10.6 0.660 0.815 0.0003 10 (0) 0.510 0.796 <0.0001 Sw19 12 (6) 8.4 0.472 0.518 0.530 7 (1) 0.447 0.418 0.889 Mean +/- s.d. 14.2 +/-5.3 11.0 +/-3.7 0.741 +/-0.168 0.773 +/-0.131 10.7 +/-3.8 0.736 +/-0.177 0.767 +/-0.151
Table 5. Population differentiation and gene flow between groups of islands of the archipelago of the Azores and Madeira based on microsatellites: FST with level of significance based on an exact G-test of population differentiation (*: 0.01 < P < 0.05, not significant after Bonferroni correction).
D. delphis n Central Seamounts Madeira Western 25 0.003* [-0.002; 0.008] 0.013 [-0.004; 0.035] 0.001 [-0.003; 0.007] Central 57 - 0.000 [-0.014; 0.016] 0.002 [-0.001; 0.004] Seamounts 7 - 0.014 [-0.002; 0.031] Madeira 56 -
S. frontalis n Central Eastern Madeira Western 26 0.002 [-0.003; 0.007] -0.003 [-0.012; 0.008] -0.001 [-0.006; 0.004] Central 103 - 0.000 [-0.007; 0.008] -0.001 [-0.003; 0.001] Eastern 15 - -0.005 [-0.010; 0.001] Madeira 47 -