Challenges Faced by a Global Team: the Case of the Tool Reuse
Program at Intel®
By
Alain Communal
Master in Engineering - Supelec, 2002
Master in Applied Science - Ecole Polytechnique de Montreal, 2002 Submitted to the Sloan School of Management and the Department of Lnglneering systems in Partial Fulillment o0 me Requirements ior the
Master of Business Administration
and
Masters of Science in Engineering Systems
OF TECHNOLOGY
JUN 2 5 2008
LIBRARIES
In conjunction with the Leaders for Manufacturing Program at the
Massachusetts Institute of Technology June 2008
C 2008 Massachusetts Institute of Technology. All rights reserved.
A
Signature of Author
May 9, 2008 Engineering Systems Division Sloan School of Management Certified by
Duane S. Boning, Thesi$Supervisor Professor & Associate Department Head, Department of Electrical Engineering and Computer Science Certified by
,W6nald B. Rosenfield, Thesis Supervisor Senior Lecturer, Sloan School of Management Director Leaders for Manufacturing Fellows Program Accepted by
Dr. Richard Larson, Professor of Engineering Systems Chair, Engineering Systems Division Education Committee Accepted by
SDebbie
BerechmanChallenges Faced by a Global Team: the Case of the Tool Reuse
Program at Intel®
By
Alain Communal
Submitted to the Sloan School of Management and the
Engineering Systems Division on May 9, 2008 in Partial Fulfillment of the Requirements for the Degrees of Master of Business Administration and
Master of Science in Engineering Systems
ABSTRACT
The semiconductor industry is characterized by a high cost of capital equipment and fast change in process technology. Therefore Intel ® Corporation as the world's largest semiconductor company has a significant advantage over its competitors in reusing its semiconductor
equipments. Not only may the financial impact be considerable, but also Intel ® Corporation can see benefits in process development, equipment reliability, and training.
However, demolishing and reusing tools do not go without major difficulties: complexity of the equipments, safety concerns because of the chemical used, reliability of the tool when reused. Consequently, in late 2004, the 6D Program was initiated to preserve Intel's assets during transfer from decontamination through deployment (reuse, resale, part harvesting, donation or scrap) using safe, effective procedure and business processes. In less than 3 years, the 6D Working Group has created procedures, checklists and trainings to assure "best-in-class" performances.
This project was set up to support the 6D Working Group's improvement strategy by analyzing gaps that may exist in the system. Especially, the thesis analyzes the challenges faced by the 6D Working Group (a global team) to influence and standardize local practices. By using game theory analysis, recommendations are made to change incentive policy. A new set of metrics is proposed to drive accountability of the sites and foster process improvements. Finally, using a system dynamics approach, the thesis offers insights to answer the question of the adequate level of standardization of processes.
Thesis Supervisor: Duane S. Boning
Title: Professor & Associate Department Head,
Department of Electrical Engineering and Computer Science
Thesis Supervisor: Donald B. Rosenfield
Title: Senior Lecturer, Sloan School of Management
Acknowledgments
I would like to acknowledge Intel® Corporation for providing me the opportunity of working in
the Rio Rancho, NM site. My sincere thanks go to Mark Miera, my supervisor, who provided me hospitality, support and insights throughout the seven months of my internship. In addition, I would like to thank the 6D Working Team, Michelle Ramacciotti, Robert Wright and Andy Giomi for their assistance and generosity.
The Leaders for Manufacturing Program at MIT is a demanding program filled with amazing people. My thesis advisors, Duane Boning and Don Rosenfield, were always there to answer my questions and challenge my ideas. I wanted to thank them for their help. Also, I could never be thankful enough to my classmates and friends at MIT: Ada, Brian, Victor, Danielle, Julie-Anna and Jerome.
This internship would not have been enjoyable without the support of my friends in New Mexico (Charlotte, David, and the Gilbert family), in France (C61ine, Coralie, Isabelle and her familly), and in Montr6al (Marie-Marine and S6bastien).
Finally, I would like to thank my parents, Michel and Th6r6se, my brother, Frangois, and my sisters, Marie-Laure and Lucie, for their encouragement throughout my life and these two years. You instilled in me the passion to learn and challenge myself.
Table of Contents
ABSTRACT ... 3 Acknowledgments ... 5 Table of Contents ... 7 Introduction ... 9 1.1 Project overview ... 9 1.2 Thesis Overview ... 92 Asset Management at Intel ... 11
2.1 Motivations ... ... ... 11
2.2 Tool Reuse Program and Allocation Process ... ... 14
2.2.1 Opportunity definition and reuse planning... ... ... 14
2.2.2 Tool allocation... 15
2.2.2.1 Allocation of reused tools ... 15
2.2.2.2 The retirement process ... 17
2.2.2.3 Proposed improvement ... 18
2.3 The 6D Program ... 21
2.3.1 Mission and Vision Statement... 22
2.3.2 6D Process Overview ... 22
2.3.2.1 Pre Demo activities ... 23
2.3.2.2 1D: Decontamination ... 24 2.3.2.3 2D: Decommission... 25 2.3.2.4 3D: Demolition ... 25 2.3.2.5 4D: Demolition of Utilities ... 26 2.3.2.6 5D: Delivery... 26 2.3.2.7 6D: Deployment ... 27
3 Leadership Challenges: Global Team vs. Local Priorities... ... 28
3.1 Three Lens analysis ... 28
3.1.1 Strategic Design Challenges... 28
3.1.2 Political Challenges ... 30
3.1.3 Cultural Challenges ... 31
3.2 From compliance to accountability ... 33
3.2.1 The measure of compliance... 33
3.2.2 The difference between compliance and accountability ... 35
3.2.3 The missing link... 37
3.2.4 How to build accountability? -Game theory analysis ... .39
3.2.4.1 Introduction to the game theory analysis ... ... .39
3.2.4.2 Case 1: Model with neither bill-back nor reward ... .41
3.2.4.3 Case 2: Model with only bill-back... 44
3.2.4.4 Case 3: Model with both bill-back and reward ... 46
4 Process improvement framework ... ... 49
4.1 Literature Review ... ... 49
4.1.1 Lean thinking... 49
4.1.2 System dynamics thinking ... 56
4.2 M etric definitions ... ... 59
4.2.1 Assessment of actual metrics ... 60
4.2.2 Characteristic of a good set of metrics ... ... 61
4.2.3 Proposed new metrics... ... 63
4.2.3.1 Internal focus metrics ... 63
4.2.3.2 Customer focus metrics... 64
4.2.3.3 Innovation and learning metrics... ... ... 64
4.2.3.4 Financial metrics ... 65
4.3 Standardization of processes ... 65
4.3.1 System dynamics model of the 2D Checklist... ... 66
4.3.2 The adequate level of standardization ... 69
5 Conclusion ... ... 72
Appendix A: Timeline of the Intel® processor introduction ... 73
Appendix B: Map of the tool allocation process ... ... 74
Appendix C: Results of a survey made in October 2007 ... 75
Appendix D: Equations related to the harvesting decision ... 81
Appendix E: Calculations in Section 3.2.4 ... ... 85
Appendix F: Interaction map ... ... 86
Appendix G: Actual set of metrics ... ... 87
Appendix H: X-M atrix... ... 88
Bibliography ... ... 89
Introduction
This thesis is the culmination of a six-month internship at Intel Corporation's Fab 11/11X located in Rio Rancho, New Mexico. The 6D Working Group sponsored this project as part of an ongoing effort to improve process efficiency.
1.1
Project overview
The present project is the third MIT-Leaders for Manufacturing (LFM) internship working on the 6D Program at Intel®. The objective of the 6D Program is to ensure that Intel's Fabs use safe, effective procedures and business processes to transfer assets from the factory to its final destination (reuse, resale, part harvesting, donation or scrap.) It involves seven steps: Pre Demo activities (audits, preparation of the procedures...), Decontamination, Decommission, Demolition, Demolition of Utilities, Delivery and Deployment.
Intel® is a multi-national company with decentralized manufacturing processes over multiple sites. On a global basis, the 6D Program is designed and coordinated by the 6D Working Group, and at a local level, tool demolitions and reinstallations are executed by dedicated teams. Therefore both the 6D Working Group and the local Fabs have to work hand-on-hand to improve the existing procedures and deliver consistent results. However, many barriers impede standardization and process sharing. These barriers may be complexity of the tools, existing local practices and misalignment of incentives. The present thesis analyzes some of these barriers and provides recommendations to build accountability of the Fabs, foster standardization of the procedures and improve communication between sites.
1.2 Thesis Overview
This thesis is divided into three main parts.
Chapter 2 discusses the asset management at Intel®. This part provides an overview of the tool allocation process and presents a decision tool to choose between harvesting and selling a tool. Finally the 6D Program and its high level work flow are detailed.
Chapter 3 describes the organization in place to implement the 6D Program. Especially this part highlights the challenges faced by a global team, the 6D Working Group, to influence and
standardize local practices. Using a game theory analysis, the author advocates that the lack of accountability of the sites and communication between sites may be attributed to the current incentive structure. A revision of the policy is proposed.
Chapter 4 explores different process improvement frameworks (Lean, 6-sigma, theory of constraints, learning organization) to improve the 6D Program. A set of metrics is proposed to measure and align process improvement toward strategic objectives. Finally the question of the adequate level of standardization is tackled with a system dynamics model.
2 Asset Management at Intel®
This Chapter discusses the asset management at Intel®. First, we discuss on the motivations of an efficient tool reuse program, and then we provide an overview of the tool allocation process. A decision tool to choose between harvesting and selling a tool is presented. Finally the 6D Program and its high level work flow are detailed.
2.1 Motivations
"The semiconductor industry and our operations are characterized by a high percentage of costs that are fixed (i.e. facility construction and equipment, research and development, and employment and training of a high skilled workforce) or otherwise difficult to reduce in the short term, and by product demand that is highly variable and subject to significant downturns that may adversely affect our business, results of operations, and financial condition." (Intel 2007)
As pointed out by the above quote from the 2006 Intel Annual Report, capturing equipment reuse opportunities may significantly impact bottom line indicators. Especially three favorable factors make this reuse program attractive and necessary: the expensive cost of capital equipment, the rapid product and technology "clockspeed" (Fine 1998, p. 6-7 & 239), and
strategic move to fast-growing markets.
With an asset turnover ratio (i.e. the amount of sales generated for every dollar's worth of assets) of 0.75, Intel®'s ratio is clearly in the lower range compared with other types of industry (see Figure 2-1). This fact is an indication that Intel® should utilize its assets in a more efficient manner and capital equipment may offer greater leverage. Indeed, in 2006, the net book value of Intel® plant, property and equipment (original cost minus depreciation and amortization) accounted for one third of its total assets (Intel 2007). Moreover, for a leading-edge factory, cost of capital equipment generally ranges between $2 and $3 billion (Jefferson Jun. 2005), which represents about 75 to 80 percent of the cost of building an integrated circuit plant (Clendenin 2007). Finally, since the cost of leading-edge equipment is only going higher, the need to support efforts in reusing equipment will result in not only higher return for every dollar spent on capital but also cost avoidance in purchasing new equipment.
2 T- -"---1.54 > 1.5 o 1.14 1.15 1.17 0.81 0.91 0.99 1 S 0.75 0.77 S0.5 -
--(p~
0Figure 2-1: Turnover Ratio by Industry - (Reuters 2007)
In 1965, Gordon Moore predicted that the number of transistors on a chip would double every two years. This law, called Moore's Law, has been verified since the introduction of the first Intel® processor, the Intel® 4004 processor, in 1971 (Intel 2007). Not only has the number of transistors increased but also the manufacturing technology dimensions (i.e. the sizes of these transistors) have decreased at an exponential rate (see appendix A). This relentless move toward miniaturization has forced Intel" to constantly innovate and modify its manufacturing capability. For instance, between 1991 and 1996, at a time where reusing tools was not part of Intel" culture, Intel® purchased $13 billion in new equipment (Weisberg and Rigoni 1999). Given that in 1997, the gross book value of Intel" plant, property and equipment (i.e. original price paid without depreciation deduction) was $18 billion, we can estimate that during this period, Intel" renewed approximately 10 percent of its equipment per year just because of technology evolution. Miniaturization is one solution to increase the number of processors produced per wafer. Another way is to increase the wafer size. In 1978, Intel® used 51mm wafers to produce its Intel® 8086 processor. Since then, the wafer size increased at approximately a rate of 50 mm every ten years. In 2001, Intel" started producing with 300mm wafers, and expects to reach 450 mm in 2012 and even 675 mm in 2021 (Kramer 2006). By the end of 2008, most Intel" Fabs will be converted to 300 mm. Even if reusing the same capital equipment over different technologies is challenging, Intel® technology group always tries to do so by the adjunction of parts and upgrades, called conversion kits.
~_~~~__~_____~___~~___~___~~____~__~~~__
'c: ,c`
\ ;Z' ~
--Finally, Intel® is progressively moving its production capacity to foreign countries because of increasing pressure on price from the personnal computer industry (Clendenin 2007) and potential for future growth (Intel 2007). In 1993, Intel® moved to Ireland with the construction of Fabl0. Over the ten first years, low corporate taxes and other incentives saved Intel® approximately $1 billion (Friedman 2006, p. 408). In 1999, Fabl8 opened in Israel in part because the state of Israel paid $600 million in grants, financing of plant infrastructure, and tax rebates (Thurow 2003, p. 282). Moreover, in March 2007, Intel® announced plans to build and operate in 2010 a $2.5 billion plant in China, Fab68 (Barboza 2007). In this case, tax rebates and incentives account for $1 billion. However, building a plant in foreign countries such as China goes with some compromises. Weak enforcement of intellectual property rights and potential military applications of Intel® products forced Intel® to commit to the United States government that Fab68 will use technology at least two generations behind the one used in the United States. Thus, in 2010, China will use the 90-nm process technology introduced in the United States in 2002. At this time, Intel® is expected to produce in the United States at 32-nm or even 22-nm (Clendenin 2007). On one hand, one may consider that such restriction may penalize Intel®, but on the other, this constraint offers a great opportunity to reuse process equipment from End-Of-Life (EOL) plants; approximately half of the equipment used in China will come from United States plants which will have moved to another technology.
To conclude, because of high cost of capital, fast change in technology and strategic move to fast-growing markets, the need for an aggressive and efficient tool reuse program has become more and more important. Not only the financial impact may be significant, but also Intel can see benefits in process development, equipment reliability and training. "In the absence of equipment reuse, each new technology would require manufacturing and process engineers to relearn a tremendous amount of additional information" (Jefferson Jun. 2005). Moreover, after the adoption of the Copy EXACTLY! factory strategy, the standardization of process configuration, equipment identification, performance metrics and definition of equipment capacity across factories has permitted the development of such a reuse program (Haney and Canter 2005). Thus, by launching in 1998 an aggressive reuse strategy, Intel® realized in excess of $6 billion of net capital investment avoidance over the first seven years of its existence (Jefferson Jun. 2005).
2.2 Tool Reuse Program and Allocation Process
From a high level prospective, a tool reuse program may be decomposed into four process steps as represented in Figure 2-2 (Weisberg and Rigoni 1999). The two first steps will be described in detail in the following two sections. A schematic representation of these steps is included in appendix B. The two remaining steps are part of the 6D Program scope and are presented in a separate chapter.
Figure 2-2: Tool reuse process flow
2.2.1
Opportunity definition and reuse planning
The first step of any tool reuse program must determine whether a specific tool may be reused and under which conditions. If the tool is from the same basic model as a tool in a new technology, it can be easily reused with or without additional parts and upgrades (conversion kits). However, technical feasibility analyses have to be done on a case-by-case basis by Intel® Technology Development (TD) specialists. Generally, for a current "N" generation technology, the only available tools are from the "N-2" generation ramp down because the "N-l" generation is at its production peak (Jefferson Jun. 2005). In addition, the current move from 200 mm to 300 mm has generated physical space constraints that prevent reusing many tools. In either case, the technical performance information and the list of conversion kits are summarized in a system called Model of Record (MOR).
By and large, the cost of reusing a specific tool is much lower than the price of a new tool. However, in cases where the cost of the conversation kits exceeds thirty percent of the cost of a new tool, the finance department verifies whether the reuse decision makes economical sense with the calculation of a return of investment' (ROI). (Bodmer 2007)
2.2.2
Tool allocation
This Section corresponds to the second step of Figure 2-2. First, we describe the process flow as it is done at Intel®. A schematic view can be seen in Appendix B. Then, we describe
the retirement process and the four possible outcomes for a tool: reuse, resale, part harvesting, donation, or scrap. Finally, a theoretical tool is derived to support decision between harvesting and selling a tool.
2.2.2.1 Allocation of reused tools
Tool allocation is a complex and large problem involving thousands of tools worth several billion dollars, and subject to many constraints including balancing the capacity load across the virtual factory, meeting technology requirements, matching expected releasing and receiving dates, and minimizing global cost.
At Intel®, several systems are involved during this process. Every quarter, depending on the long term demand (generally two years), the Long Range Planning (LRP) system determines which factories will have excess or will require additional capacity. At the same time, it forecasts when excess tools will be out of production (CFD: Capacity Free Date) and when new tools will be required to meet production targets (CND: Capacity Need Date). This forecast is then sent to a project management software tool, P3E (Primavera), which calculates the availability date of the tool (Request Dock Date). Finally, an optimizer, Strategic Tool Allocation Resource System (SuperSTARS), finds matches between Request Dock Date and Capacity Need Date for each tool type. This whole process of designation and allocation of a tool is called the Multi-Factory Push-Pull (MFPP) process and is presented in appendix B.
1 Actually, in this case, the term ROI is used improperly. Instead of calculating an ROI, expressed in percentage, the finance department uses a net present value (NPV) with an annual discount rate of 15%.
As previously mentioned, SuperSTARS is an application used to optimize the allocation of excess inventory and to provide a standard methodology for allocating tools across Intel®. From a high level prospective, it is a linear programming model that determines the allocation that minimizes global cost of reuse (Ali, et al. 2005). For each possible allocation, penalty cost based on costs of conversion kits, transportation, and demolition and installation activities, is
assigned to each assignment.
The problem can be mathematically expressed as:
m n
min
YI cixi
i=1 j=1
S= 1 xij = 1(supply constraints)
subject to the constraints: xij = 1 (demand constraints) xij binomial
with xij the decision variable representing the assignment from i to j, and cij, the associated cost.
Much emphasis is put to maximize reuse but in some cases it is not possible. The three main causes are:
* Cost: ROI is not positive for reuse tool (conversion kit cost, installation, demolition and warranty cost).
* Technical: The tool cannot be converted or may generate technical issues.
* Timing: The Request Dock Date is not early enough to meet the Capacity Need Date.
2.2.2.2 The retirement process
If the tool cannot be reused, it enters what is called the retirement process. At this stage the
tool may have four different destinations (ranked by order of priority):
1. Resale: Intel® Resale Corporation (IRC) is the organization dedicated to the sale of
Intel® surplus assets'. Indeed Intel® can be held liable for selling a tool containing hazardous material. By using a dedicated organization, Intel® can mitigate tax and legal risks. When IRC receives the list of retired tools, they assign for each tool a priority from Pl to P5 based on its fair market value, its percentage of return (ratio of the fair market value over the original price), and its market demand (see matrix in appendix B). This priority is used to help define the retirement disposition of the tool and constitutes a signal to the Fabs to schedule demolition activities.
2. Donation: For educational or research purpose, universities ask Intel® for unused tools. These demands are generally often satisfied.
3. Harvest: The harvest program is a way to maximize value extraction from a retired tool by taking its useful parts. The actual policy is to avoid harvesting consumables (gaskets, filters), and parts which have a value inferior to one hundred dollars, historical break or known EHS issues. Finally, part harvesting is critical for End-Of-Life (EOL) tools since many of these parts can no longer be purchased. In this case, harvest has priority over resale and donation. When the decision is to harvest the tool, only the useful parts are kept and the remainder of the tool discarded. This offers many advantages: a gain of inventory space, a faster response when the part is needed, and the possibility to send the part to other Intel® Fabs.
4. Scrap: As a last resort, the tool is dismantled and discarded.
Generally the decision does not draw much discussion. Indeed, if a tool has a high market value and the demand is high, it is very improbable that it will be required for harvest. On the
1 Intel Capital (ICAP) is also authorized to sell Intel® assets but historically the majority of resale tools have been done by IRC.
contrary, if a tool is EOL, it is generally synonymous with outdated technology, low demand and low market value. However, in some rare cases, an ROI is calculated to compare resale and harvest solutions. For resale, the fair market value is discounted for one year, and only incremental costs (i.e. shipping fixtures and transportation) are included. For harvest, the estimated value of the tool is based on a Bill of Material (BOM) which sums the values of the useable parts (or not already in inventory without demand), at the price they would be bought from suppliers. This value is not discounted.
One can look at the harvest-sell option in terms of the value of the parts in inventory. The literatures suggest comparable approaches for slow moving inventory. For example, as pointed out by Rosenfield, "[the] real question in the treatment of [slow-moving or obsolete] inventory is not necessarily whether to salvage or dispose of an entire [tool], but what number of each units to keep" (Rosenfield 1989). Indeed, each part constituting the tool is worth a value depending on the number already in inventory which is linked to the expected date it will be used. Therefore, to estimate the value of a tool that may be harvested, we have to discount the price of each individual part by the expected time it will be kept in inventory. The main difficulty in determining a formula lays in the fact that each part has its own expected release date, based on a stochastic demand and the already existing inventory.
2.2.2.3 Proposed improvement
The following Equation 2-1(see demonstration in appendix D) captures all the constraints previously mentioned to evaluate whether a tool should be harvested or sold. If the inequality is true, then the tool has to be harvested. If not, the tool has to be sold. Indeed, the left side of the equation if the value of the tool if sold (discounted market value minus the cost of selling the tool). The right side of the equation represents the value of the tool if harvested (sum of the discounted value of the individual parts minus the cost of harvesting).
4
A,+ J i ( j+ -Ch >4+
C
Equation 2-1: Condition to harvest a tool
With:
g : Average number of tools expected to be sold by unit of time. (unit: 1/year) 8 : Continuously compounded discount rate = 14%. (unit: 1/year)
Xi : Average number of parts of type i demanded by unit of time. (unit: 1/year)
Ai : Value of part of type i. (unit: $)
Ch : Total incremental cost of harvesting the tool. (unit: $)
Cs : Total incremental cost of selling the tool (crating, shipping fixtures...). (unit: $) Ii : Number of parts of type i already in inventory.
N: Number of part types that can be harvested for the tool.
ri : Cost per unit of time of space and other non-capital holding costs for the part of type i.
(unit: $/year)
V: Sale value of the tool. (unit: $)
The notation [x]+ means: [x]+ = Max[O; x].
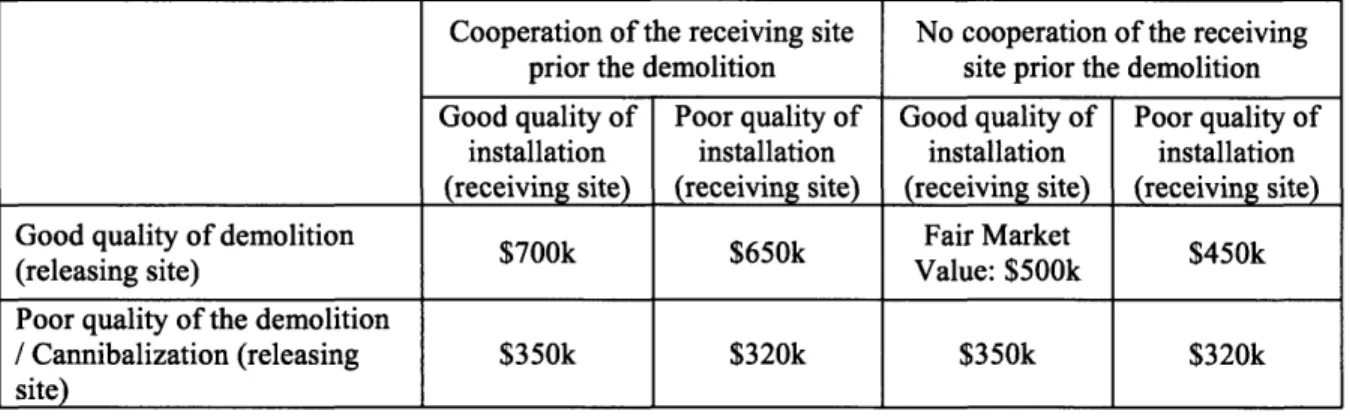
As a numerical example, we take the following case:
* Option 1: Sell the tool
The considered tool can be sold for one million dollars. To prepare the tool specifically for resale (packaging, crating, transportation, etc.), it costs an incremental one hundred thousand dollars. Finally, Intel® Resale Corporation expects selling between one and two tools during the next year. These values are summarized as follow:
Fair market value of the tool: V = $1,000,000
Expected number of tools to be sold per year: gi = 1.5
* Option 2: Harvest the tool
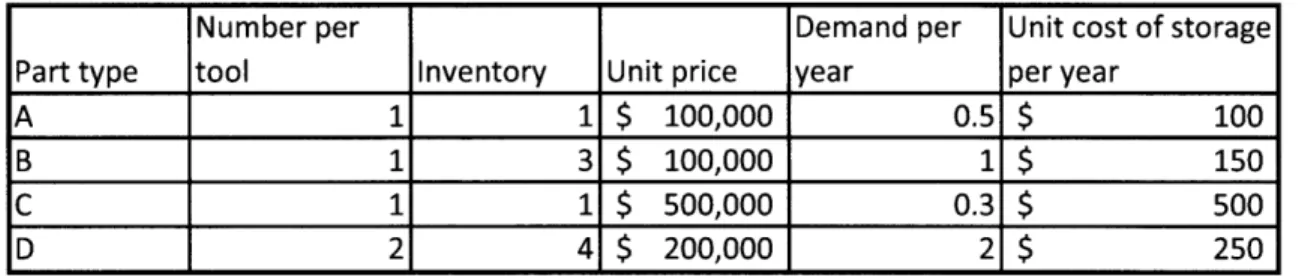
The same tool can also be harvested. Four different parts are worthwhile to consider because their market value is high (superior to one hundred thousand dollars) and the demand is significant. Additional informational in this scenario is summarized in Table 2-1. Finally, it costs an additional fifteen thousand dollars to take apart these pieces.
Cost of harvesting the tool: Ch = $15,000
Number per Demand per Unit cost of storage
Part type tool Inventory Unit price year per year
A 1 1 $ 100,000 0.5 $ 100
B 1 3 $ 100,000 1 $ 150
C 1 1 $ 500,000 0.3 $ 500
D 2 4 $ 200,000 2 $ 250
Table 2-1: Data for harvesting the tool
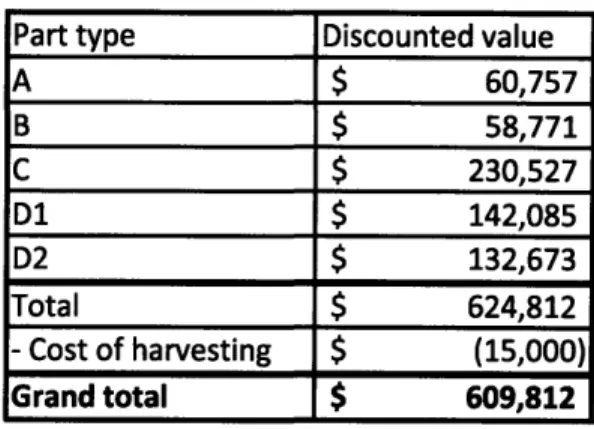
At a first glance it seems that the tool should be harvested. Indeed, the total value of the tool if harvested is worth $1.1 million with a cost of harvesting of $15k, compared with a fair market value of $1 million and at a cost of $100k to prepare it. However, a second look shows that it may not be so obvious. Indeed, part C has a high value but is not often replaced and some of the parts with a higher demand (B and D) are already in high quantity. By using the formula previously mentioned we find that the harvested tool is worth $609,812 (Table 2-2)
compared with a value if sold of $814,634'. Therefore the tool should be sold. Note that, since the tool contains two parts D, each part D has to be calculated separately by incrementing by one the existing inventory for each additional part.
15- * 1,000,000 - 100,000 = 814,634
Part type Discounted value A $ 60,757 B $ 58,771 C $ 230,527 D1 $ 142,085 D2 $ 132,673 Total $ 624,812 -Cost of harvesting $ (15,000) Grand total $ 609,812
Table 2-2: Results of the option "Harvest the tool"
To conclude, by taking into account the stochastic character of the demand, the diminishing return of additional parts in inventory and the cost of keeping these parts on stock, Equation 2-1 may be a valuable tool for the retirement process. However, availability of reliable data still remains. Indeed, the same phenomena that Gan describes in his thesis (Gan 2007) about knowledge management in the 6D Program happen in this case too. Existing information may only be available in different systems, duplicated data not coherent between multiple systems, or information may simply be missing.
2.3 The 6D Program
As defined by the framework in Figure 2-2, the last two steps of a tool reuse process are "tool audit and ordering" and "execution and delivery," which encompass the validation that the tool can in fact be reused (no major configuration issues or process problem), and the demolition, transfer and installation of the tool.
Prior to 2004, no formal process was in place to ensure that assets were transferred in a safe and timely manner. This resulted in major safety and reliability incidents that pushed the creation of the 6D Program at the end of 2004. Initially, this program contained only activities performed by the releasing site (decontamination, decommission and demolition). It is only at the beginning of 2005, that the scope was expanded to delivery and deployment. In its present form, the 6D Program is comprised of seven steps: Pre Demo activities, Decontamination, Decommission, Demolition, Demolition of Utilities, Delivery and Deployment. These steps will be studied in detail in section 2.3.2.
Two previous LFM internships studied the 6D process. The first one (Silber 2006) resulted in recommendations to improve crating reuse and warehouse inventory management with a BAP RFID system. The second internship (Gan 2007) showed gaps and opportunities in knowledge management.
2.3.1
Mission and Vision Statement
The actual mission statement of the 6D Program is:
" Preserve Intel"'s assets during transfer, from decontamination through deployment, using safe, effective procedures and business processes."
And the vision statement:
"100% on time tool transfer with zero severity 1 incident'."
Based on a survey made in October 2007 (appendix C), this mission and vision reflect the three main objectives of a demolition of a tool: safety, reliability of the tool and on-time delivery.
2.3.2
6D Process Overview
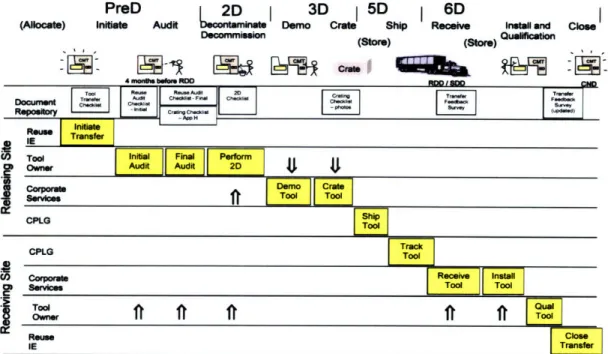
This Section describes the seven steps of the 6D Process: pre Demo activities, Decontamination, Decommission, Demolition, Demolition of Utilities, Delivery and Deployment. A schematic view of the process is presented in Figure 2-3.
Severity definition:
1. High severity: Capital loss > $200k / Missed ramp-up / Accident or injury.
2. Medium severity: Capital loss between $20k and $200k / Caused schedule compression / Unauthorized cannibalization.
PreD Audit 3D 5D I 6D
(A ) iae Audit Demo hip Rece k*ta and Clo"
Decooreision QJae) tian
e aa p(Store) (POre)
,l,
,
Figure 2-3: 6D Process Flow
2.3.2.1 Pre Demo activities
Before starting the activities of demolition of a tool, a series of tasks has to be performed. This phase is called Pre Demo. Its purpose is to document tool condition and performance, as well as to plan the activities to demolish the tool.
Several months before the planned end of production (Capacity Free Date - CFD), the Project Lead initiates the project and determines scope, schedule, budget, resources, and the expected condition of the tool. An initial audit (Tool Reuse Physical Audit) is conducted to assess the condition and functionality of the tool, the accuracy of the Bill of Material (BOM), and to identify any missing parts or critical long lead items that will be required for re-installation. Moreover, all critical tool performance data, such as utilization rate or quality results, have to be entered into a system called TRANS (Tool Reuse Audit Network System). This data will be used by the receiving site as a basis to restart the tool.
Once this initial audit is finished, the assigned Tool Owner (TO) receives the tool Installation Package from the Design Group. This document includes configuration of the tool, isometrics of the lines, electrical connection, etc. Generally this package is not accurate.
Indeed, the Sustaining Group may have improved or customized the tool without notifying the Design Group. Also, cost-benefit analyses showed that maintaining these drawings up-to-date was not justified. Therefore, during an activity called "Red Lines," the TO verifies construction drawing accuracy by "walking the tool." Even if this activity may be tedious, it offers two main advantages: an opportunity for the TO to learn about tool configuration and it provides an accurate basis for contracts with external groups that participate in the demolition.
Then, based on his findings, the TO creates a 2D Checklist. This tool type specific document describes the sequence of tasks to be performed to safely and efficiently decontaminate and decommission the tool. In many cases there are existing and proven 2D Checklists and the TO will use these checklists as a baseline.
Finally, after the CFD and just prior to the start of the 6D process, a Tool Pre Demo Audit is conducted to ensure that the tool is fully functional.
2.3.2.2
1D:
Decontamination
The first step of the 6D process is called Decontamination. It consists in purging and flushing all gases, chemicals, and liquids, as well as cleaning the tool of oils, wafer shards, and residues. Therefore the expected result is a clean and dry tool with consumables removed. Failing during this step may result in corrosion issues if the tool has to be stored for a long period, as well as environmental or personal safety concerns when the tool is uncrated. Indeed, the semiconductor fabrication process uses many toxic materials. These include poisonous elemental dopants (e.g., arsenic, boron, antinomy, or phosphorus), poisonous compounds (e.g., arsine, phosphine, or silane) or highly reactive liquids (e.g., hydrogen peroxide, fuming nitric acid, sulfuric acid, or hydrofluoric acid) (Wikipedia 2007). To be considered safe by the Environmental Health and Safety (EHS) Group, the pH must range between 6 and 8.
However, leaving a perfectly clean tool is not always possible. For instance, wet benches' typically contain twenty five different types of chemicals, and are made of polypropylene
SA fully automatic process tool used to carry out wet cleaning and etching (process of transferring the pattern to the
wafer) operations. This tool commonly includes several tanks each containing either cleaning/etching solution or de-ionized rinsing water in which wafers are immersed in predetermined rinsing sequence.
which may absorb these chemicals under certain circumstances. Therefore, even with careful wash and rinse with water, may still retain chemicals that the polypropylene will desorb one or two weeks later. In 2005, Intel® reported eight (out of twenty seven) incidents related to this issue.
Finally, since the tool cannot properly decontaminate without some decommission steps being performed, these two steps are inextricably linked and are frequently referred as "2D" (see Figure 2-3).
2.3.2.3 2D: Decommission
Tool Decommission consists of powering down the equipment, disconnecting the tool from automation systems and utilities (except exhaust, drains and electrical), and adding shipping fixtures to prevent damage during shipment.
In addition, all Intel® proprietary information must be removed per Intel® Information Security Policies. In many cases, this step is obvious but sometimes this "proprietary information" is inherently part of the tool. For instance, the hard drive containing the operating system may have been programmed by Intel® Technology Development (TD) for the specific application of the tool. Hence, selling the tool with this hard drive may divulge some proprietary information, but without it, the tool is unusable.
Finally, once tool and sub-Fab equipment decontamination and decommissioning are completed per the 2D Checklists, a walkthrough, called Demo Safety Level 1 (DSLl), is carried out to ensure that the tool is ready to begin the Demolition (3D) process.
Depending of the tool type, the duration of the two first D's ranges between one and twenty days.
2.3.2.4 3D: Demolition
The first phase of Tool Demolition consists of disconnecting the tool exhaust, drains, and
electrical connections. At this point another walkthrough, called Demo Safety Level 2 (DSL2
cables required for tool install have been pulled. Post DSL2, the tool is physically "ready to move," but will require move preparations.
Indeed, moving a tool out of the factory exposes it to a non-clean room and non climate controlled environment. In order to protect the tool from moisture and condensation and ensure a humidity level below forty percent, the tool is wrapped in an airtight seal with desiccants. Then, the tool is padded to prevent physical trauma and individual tool components are protected in crates. Packaging and crating requirements vary based on mode of transportation, destination, and eventually duration and condition of storage. For instance, some National Plant Protection Organizations require debarked or bark-free wood as a requirement for import, and China has special requirements in term of documentation attached to the tool.
Typically, the duration of the demolition step ranges between two and twenty days with one day for moving out and one day for crating.
2.3.2.5 4D: Demolition of Utilities
Demolition of Utilities is the Decommission, Decontamination, and System Demolition of Base Build / Process Specific Support Systems (PSSS). The scope generally includes mains, laterals, and other utilities to facilitate a base build project for the future. Demolition is completed on a selected basis depending on the reusability of the system and in order to leave the area in a safe and reusable condition.
2.3.2.6 5D: Delivery
The Delivery step consists of the movement of capital equipment from Intel" dock to its final destination. The final destination can be reuse by another Intel® Fab, resale by IRC, donation to educational institutions, harvest or scrap. The tool can be either directly delivered to its final destination or temporary stored in an Intel" controlled warehouse or in that of a third party logistics (3PL) provider.
Since the tool is subject to a number of stresses that would never be present during normal use, damage may occur in shipment. Another known issue is cannibalization in the warehouse.
2.3.2.7 6D: Deployment
The last step of the 6D program is Deployment of the complete capital equipment at its reuse destination. It includes uncrating, installing and qualifying the tool.
Each time a tool is deployed to another Intel® Fab, it should be a learning experience for all parties involved in the 6D Program. This is done formally through the Receiving Site Certification. Since this closed loop process was put in place, the 6D Working Group has expressed concerns about the percentage of receiving sites completing certification: less than fifty percent is filled and generally it is done only when receiving Fabs express major concerns when reusing the tool. This low response rate is therefore a major roadblock in improving the whole 6D process.
However a successful reuse of a tool is very important for Intel®. For instance, if the tool is expected during the ramp-up of a production line, failing in deploying the tool may have detrimental consequences for Intel®. Not only may it have economical, but also long-term commercial consequences, which are hard to evaluate. The main components for a successful transfer are obviously a complete and functional tool, as well as a good communication between the releasing and the receiving sites. Therefore the involvement of the receiving site at the early stage of the process to communicate its expectation, and accurate and relevant historical data from the releasing site are fundamental for a flawless transfer of the tool.
3 Leadership Challenges: Global Team vs. Local Priorities
This Chapter is about leadership challenges faced by the 6D Working Group to influence and coordinate standardization of the procedures. First, we analyze the organization through three lenses: strategic design lens, political lens and cultural lens (Carroll 2001). Based on this analysis, we explore the difference between compliance and accountability of the sites, and conclude that the program may lack figures dedicated to lead accountability of the execution of the processes. Finally, using a game theory analysis, we advocate that the lack of accountability of the sites, revealed through cannibalization of tools, is a result of the actual incentive policy and then a revision of this policy is proposed.
3.1
Three Lens analysis
The following sections describe the enterprise using the Three Lenses approach taught at the MIT - Sloan School of Management. Under this design, the organization can be viewed from three perspectives: the strategic, the political and the cultural.
3.1.1
Strategic Design Challenges
Demolishing and transferring a tool from one site to another cannot be done without the active participation and the coordination of many different groups of people: Engineering, FSM (Fab Sort Manufacturing), CSC (Corporate Services Construction), EHS (Environmental Health and Safety), CPLG (Customer Fulfillment, Planning and Logistics Group), Finance, and others. As we can see, these groups are sorted by function. Indeed, as a manufacturing company, Intel® justifies this type of organization because often specialization leads to economy of scale, efficiency, and innovation.
However, drawbacks can appear when integration between groups is required. Indeed, the company may face a situation where each group has its own information system and even some information may be inconsistent from one system to another. For instance, it may be surprising to see that each tool has four different denominations: an SAP number, an asset number, an E-Tag and a Tool Id. Another drawback of this lack of integration may be some gray areas in the transmission of tasks. Indeed, the Decontamination and Decommission steps are performed by FSM while the Demolition is executed by CSC. As pointed by these two examples, in order to
execute a tool transfer, communication channels have to be set up not only between sites but also at every level of the organization.
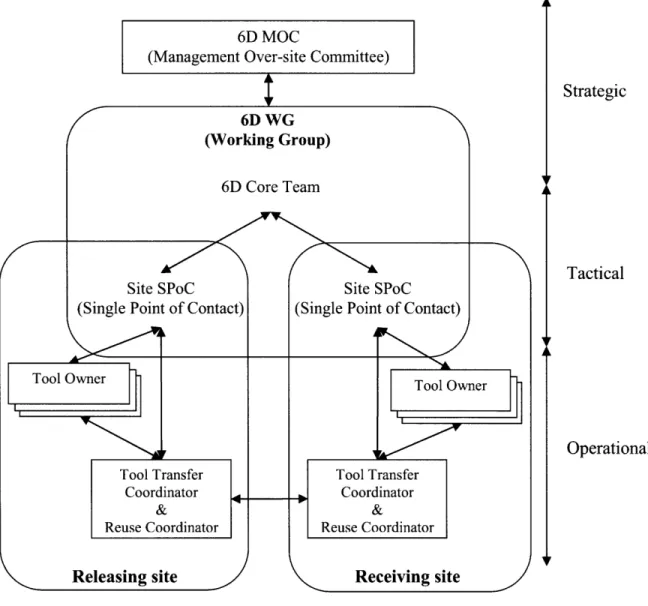
Figure 3-1 presents a simplified view of the organization in place to manage the transfer of tools. From a strategic point of view, the 6D Management Over-site Committee (MOC), composed of Fab managers, and the 6D Core Team specify the objectives, and validate policies and plans. At a tactical level, the 6D WG, composed of the 6D Core Team and the 6D SPoC of each plant, design the systems and procedures to achieve these objectives and spread them through individual sites. Finally, at a operational level, Tool Owners (TO) are in charge of following these procedures to demolish or reinstall a tool. Communication between sites is carried out by Tool Transfer Coordinators (TTC) and Reuse Coordinators. Their mission is to facilitate the transfer of tool within the Virtual Factory. Also, if an issue arises during a tool movement, they are in charge of driving its resolution.
However, at the individual level, some parts of this structure differ from site to site. For instance, specific work can be performed by Blue Badges (Intel® employees) in one site while the same step will be completed by Green Badges (contractors) in another. These differences impede standardization and are a clear barrier in the 6D WG efforts to coordinate the processes used and foster continuous improvement. This leads to a situation where only general guidelines and checkpoints are proposed and applied or not, depending on the site organizational structure.
Indeed, the 6D WG is what we call a Virtual Team, a group of individuals geographically dispersed with the mission to promote a global optimum for the corporation per opposition to local optima per factory. For the 6D Program, the 6D Core Team located in New Mexico transmits information to the Fabs through the SPoC who is in charge of training local teams and insuring that the right processes are followed. The role of the SPoC is crucial in the 6D Program success because he is the only one who can ensure that local actions are aligned with global objectives. As noted by Klein and Barrett, this mission is not easy because they "must develop a perspective that allows them to see the work for the team as part of a global strategy, even if it means a personal struggle with the fact that what is good for the entire organization might not benefit their home location." (Klein and Barrett 2001)
Figure 3-1: Simplified organizational structure
3.1.2
Political Challenges
In order to align sites with these global objectives, the 6D SPoC needs to be a senior person with wide and lateral influences and connections to many organizations. Through interviews with most of the 6D SPoC, it seems clear that this political influence is real in sites where demolition activities are significant. For instance, in New Mexico or Colorado, a whole part of the factory was shut down and hundreds of tools had to be transferred or sold. In these cases, the 6D SPoC had direct contacts with the Factory Manager. However, when only a few tools are demolished, more junior and inexperienced people are in charge. This leads to less compliance to the processes.
1 1 '1 Strategic Tactical Operational
Another challenge in reaching a global agreement is the fact that people are mainly judged for local improvements. As stated by Klein and Barrett, "if the corporation has created competition between sites for future business, local sites will be unwilling to share their knowledge and practices" (Klein and Barrett 2001). Not only does competition exists between sites but also between groups. To the individual level, incentives are aligned with local and even group objectives, not global objectives. This political power exerted by direct management is a real barrier to overcome since the 6D WG has no hierarchical authority.
Finally, the main goal of the 6D WG is to promote process sharing and collaboration between sites. However, "the application of best practices around team processes and collaborative technologies are critical but insufficient if the natural tension between global and local priorities is ignored" (Klein and Barrett 2001). For instance, in some cases, demolition of tools is linked with end of activities at a particular fab site. Therefore, it is very hard to motivate people to share best practices or improve the existing ones since it would result in earlier lay off.
In the previous two parts, we saw that significant differences in organizational structures, incentives and objectives impede alignments and commitments to the 6D Program. Moreover, in several instances, corporate and local objectives are in opposition. However, in the 90's, Intel® implemented Copy EXACTLY! with the aim to duplicate and standardize the same equipment and methodologies at all sites. The next section analyzes whether this Copy EXACTLY! culture may influence and help the 6D WG in promoting standardization and shared learning in order to reduce duplication of efforts between sites that demolish the same type of tools.
3.1.3
Cultural Challenges
Before Copy EXACTLY!, Intel®'s manufacturing Fabs were allowed to modify new process technologies. However, variations between sites resulted in significant differences in production yield and longer technology transfer times. In order to minimize these risks, Fabs started copying equipment and processes used in development sites. Once the same yields were achieved, manufacturing Fabs were allowed to make individual improvements that had to be shared and implemented in other Fabs producing the same product.
As stated by the initiator of the Copy EXACTLY! program: "The Copy EXACTLY! Method is designed to match all factors that impact the process or how it is run. Other systems might benefit from matching, but time and money should not be wasted on matching factors that have no impact on the overall process" (Donald 1998). In other words, Copy EXACTLY! focuses on standardizing equipments, process technology and parameters, and methods. By doing so, Intel® can quickly reduce qualification time (Beckman and Rosenfield 2008, p. 68-70). Copy EXACTLY! fosters standardization of processes influencing production quality and yield. Therefore, tool demolition procedures, that obviously do not directly contribute to production, do not enter into the category of Copy EXACTLY!. Moreover, the word "exactly"
is capitalized, underlined and with an exclamation point because the paradigm change was actually hard to put in place. It required a push from top management to counter natural tendencies of the organization. "The difficulties in implementing this new philosophy and system are not to be underestimated. [...] Engineers are trained and rewarded for doing improvement projects, and production re-qualification affords them such an opportunity. The natural tendency is thus to use the new start-up as an opportunity to implement improvements." (Donald 1998)
We can see that the root cause of Intel®'s difficulties to implement large scale programs may lie in its engineering culture: analytical thinking can be seen in every Power Point presentation, every layer of management is filled with engineers, and the influence of the Technology Group mainly composed of PhDs, is significant on the whole corporation. It creates a technocratic culture based on data and rational thinking. However, "the strong focus on data in technocratic firms [...] can sometimes hinder the introduction of such concepts as organizational learning, since these are less easily quantifiable." (Klein 2004, pp. 78) Employees are rewarded for creating something new with measurable impact. Therefore, sustaining activities, such as tool reuse, are not highly valued.
Finally, competition between sites and technocratic culture have fostered a "not invented here" culture. This culture is clearly visible with the extensive use of acronyms which makes Intel@ not only a unique company because people are using their own language, but also creates barriers between sites because these acronyms may mean different things depending on the site.
At the beginning of this section, we saw that one of the main constraints in implementing a large scale improvement program for 6D was the lack of common organizational structure and misalignment of incentives. These gaps result in difficulties in spreading standardized processes and creating a learning organization. Finally, the experience given by the implementation of Copy EXACTLY! taught us that the root cause of these difficulties may lay in the "not invented here" syndrome fostered by an engineering driven culture and rewards for innovative and not sustainable activities.
3.2 From compliance to accountability
This section is about compliance and accountability. By compliance we mean "accordance with established guidelines or specifications" and by accountability, we mean "being liable for the consequences of failure to perform as expected."
3.2.1 The measure of compliance
Shortly after the creation of the 6D Program, the 6D MOC expressed the need for a measure of compliance to the 6D processes. The logic was that the more compliant the Fabs are, the more reliable the reused tools will be. In late 2005, the 6D Working Group started tracking site implementation of the 6D Program. Also, in January 2007, the 6D WG created a compliance score based on, for the releasing site, the number of 2D Checklists created and completed on time, and the use of the collaborative technology in place, and for the receiving site, the completion of the Tool Transfer Certification.
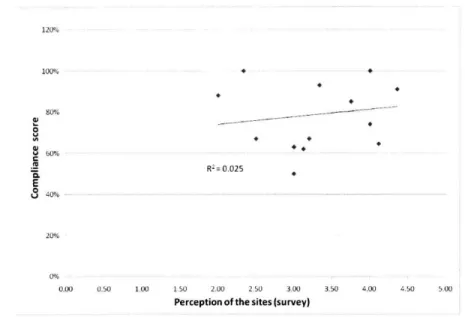
However, the results of a survey done in October 2007 (Appendix C - Question 2) showed
major discrepancies in this compliance score. For instance, if we compare the self perception of the sites with their official compliance results (Figure 3-2), we note a very weak correlation (coefficient of determination is only 2.5%).
120% 100% 80% --$60% R2= 0.025 E I 40%0 20% 0% 0.00 0.50 1.00 1.50 2.00 2.50 3.00 3.50 4.00 4.50 5.00
Perception of the sites (survey)
Figure 3-2: Correlation between the compliance score and the perception of the sites'
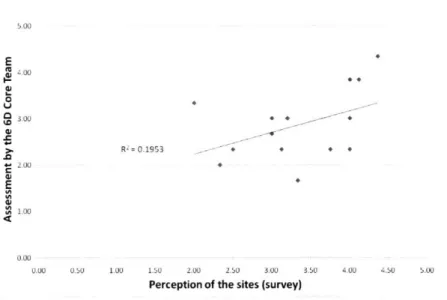
Additionally, the 6D Core Team was asked to provide their best estimate of what should be the real compliance score for each site. The result is shown in Figure 3-3. It is surprising to note that there is no correlation (even negative slope) between their perception and the compliance scores calculated and published every quarter. Finally, Figure 3-4 shows that there is an agreement between the sites and the 6D WG on what should be their level of compliance (positive correlation with a coefficient of determination of 19.5%).
120% . . EO 0 .q * * R2= 0.0007 20% 0.00 0.50 1.00 1.50 2.00 2.50 3.00 3.50 4.00 4.50 Assessment by the 6D Core Team
5.00
Figure 3-3: Correlation between the compliance score and the assessment of the 6D Core Team
1 Results based on 84 surveys for the 14 Fabs.
U
i Results based on 84 surveys for the 14 Fabs.5.00 E S.00 0 . 300 * * _ ., - " 3.0 R 0O.1953 2.00 E 1.00 0.00 0.00 0o50 1.00 1.50 2.00 2,50 3.00 3.50 4.00 4.50 5.00 Perception of the sites (survey)
Figure 3-4: Correlation between the perception of the sites and the assessment of the 6D Core Team
The main conclusion is that the actual compliance scores do not match the definition shared by the 6D WG and the Fabs. Therefore, either the compliance score does not measure the main aspects of compliance or by compliance they may mean something different. Indeed, the next part will distinguish compliance (i.e. accordance with established guidelines or specifications) from accountability (i.e. being liable for the consequences of failure to perform as expected). In either case, presenting this kind of score and then ranking the Fabs accordingly to this metric may generate frustration and lack of understanding from both parts. Ultimately, it may be damaging for the 6D WG, as the 6D WG may lose a certain form of credibility.
3.2.2 The difference between compliance and accountability
In A Reexamination of Autonomy in Light of New Manufacturing Practices (Klein 1991), Klein states that decision making can occur in three different ways:
* Centralized: A manager or centralized figure makes the decision, or the decision is based on a rule or procedure.
* Independent: Responsibility is delegated to individuals to make independent decisions.
On one hand, following a centralized decision ensures standardization and once tasks are standardized they can be improved. Indeed, by eliminating variations generated by autonomy, root causes of defects can be analyzed and solved. But to reach standardization, Fabs need to be compliant, i.e. acting in accordance with established guidelines and specifications.
On the other hand, autonomy has its virtue too. We mean by autonomy, "the degree to which the job provides substantial freedom, independence, and discretion to the individual in scheduling the work and in determining the procedures to be used in carrying it out" (Hackman and Oldham 1980). The same authors, Hackman and Oldham, emphasize the importance of this job dimension primarily because it is a basic component of human relations. On a more practical level, autonomy allows workers to shape process steps to the job that has to be done with an aim to be a more efficient and faster.
In order to measure the desired level of compliance / autonomy of the sites, the following question was asked to the sites (see appendix C - question 7): "How do you see the role of the
6D Working Group? (Rank the 2 best answers)" with the following propositions:
* Analyst - Measure performance / metrics to assess a Fab and determined room for improvement.
* Architect - Provide everything needed to manage the project: organizational structures,
process, checklists...
* Consultant - Provide suggestions that can be applied or not, depending of the situation.
* Facilitator - Help in improving the processes by sharing best practices across Fabs.
Figure 3-5 summarizes the answers obtained. By distinguishing less experienced from experienced sites1, we note that the more experienced the sites are, the more they want to be autonomous.
1 The categories "less experienced sites" and "experienced sites" were defined with the help of the 6D WG. Each of these categories is composed of 7 Fabs and approximately the same number of answers (respectively 47 and 43). The aggregate result was obtained by assigning 2 to a first rank and 1 to a second rank.
45% 40% 35% 30% 25% 20% 15% 10% 5% 0%
Facilitator Architect Consultant Analyst
0 Less experienced sites Experienced sites
Figure 3-5: Influence of the maturity level of the sites on their view of the role of the 6D Group
This type of evolution is maybe natural or at least foreseeable for companies such as Intel®. Indeed, as mentioned in the previous part, the "not invented here" syndrome is still prevalent; Fabs want to take ownership of the projects, and because of organizational and tool specificities, they recognize that a one-fit-for-all solution may not apply. Moreover, by experimenting with new ways of doing their jobs, these sites may bring more to the 6D Program than Fabs which are "only" compliant.
3.2.3
The missing link
However, the 6D WG may not be in an appropriate position to lead process accountability. While it may be fairly easy to set metrics to drive compliance to certain activities, fostering accountability requires close supervision of the execution. Indeed, the 6D WG is the designer of the 6D processes, not the owner of execution. Actually, taking a process management approach (Hammer and Champy 1993), a process must contain the five following elements (Hammer 2007):
1. A well-defined design; otherwise, the people performing it will not know what to do or when.
2. The people who execute the process, the performers, must have appropriate skills and knowledge; otherwise they won't be able to implement the design.
3. The company must align infrastructure, such as information technologies or HR systems, to support the process.
4. The company must develop and use the right metrics to assess the performance of the process over time.
5. There has to be an owner, a senior executive who has the responsibility and authority to ensure that the process delivers results.
As mentioned, the 6D WG is the designer of the processes. To ensure that the people who execute the process are performers, the 6D WG goes from site to site to provide extensive training to every actor of a tool demolition and especially to the Tool Owner, who is generally an operator specialized in using the tool. To align the infrastructure with the process, the 6D WG created a web-based tool, TRANS. This tool standardizes the exchange of information between the releasing and the receiving sites. Finally, the group started to put in place metrics to follow compliance, safety issues, etc. (see Chapter 4.2 for more information and recommendations about metrics). Therefore out of these five elements recommended by Hammer, the 6D WG covers the first four. However, this group does not have the responsibility to ensure that the process deliver results. First, the 6D WG does not have hierarchical authority to implement the changes and is not physically on-site to follow the processes. Actually, this role is more or less attributed to the 6D SPoC. However, as seen in
Section 3.1.2, the SPoC's influence is generally political, not hierarchical. Second, we also saw that, for a single tool, the process extends across functions and over two different sites. Therefore, only a senior executive may have the appropriate level of management to drive the 6D Processes. Without such a person, the process won't gain traction within the organization. On the other hand, this may not be practically realistic. The main reason being that tool transfer is only one process among many others and its relative importance is low compared with Intel®' s core competency of designing and producing semiconductors.
As a consequence, the traction has to come "naturally" through an appropriate set of incentives. Many famous business stories illustrate how inefficiencies can be seen when incentives are not aligned. For instance Hammer and Champy tell us the story of a company using multitiered distribution centers (Hammer and Champy 1993, p. 7). Before reaching customers, finishede goods are sent first to a central distribution center and then to a regional distribution center. They discovered that the process was taking eleven days because the