A Cancer Cell Program Promotes T Cell
Exclusion and Resistance to Checkpoint Blockade
The MIT Faculty has made this article openly available.
Please share
how this access benefits you. Your story matters.
Citation
Jerby-Arnon, Livnat et al. "A Cancer Cell Program Promotes T Cell
Exclusion and Resistance to Checkpoint Blockade." Cell 175, 4
(November 2018): 984-997 © 2018 Elsevier Inc
As Published
http://dx.doi.org/10.1016/j.cell.2018.09.006
Publisher
Elsevier BV
Version
Author's final manuscript
Citable link
https://hdl.handle.net/1721.1/123663
Terms of Use
Creative Commons Attribution-NonCommercial-NoDerivs License
A Cancer Cell Program Promotes T Cell Exclusion and
Resistance to Checkpoint Blockade
A full list of authors and affiliations appears at the end of the article. # These authors contributed equally to this work.
SUMMARY
Immune checkpoint inhibitors (ICIs) produce durable responses in some melanoma patients, but many patients derive no clinical benefit, and the molecular underpinnings of such resistance remain elusive. Here, we leveraged single-cell RNA sequencing (scRNA-seq) from 33 melanoma tumors and computational analyses to interrogate malignant cell states that promote immune evasion. We identified a resistance program expressed by malignant cells that is associated with T cell exclusion and immune evasion. The program is expressed prior to immunotherapy,
characterizes cold niches in situ, and predicts clinical responses to anti-PD-1 therapy in an independent cohort of 112 melanoma patients. CDK4/6-inhibition represses this program in individual malignant cells, induces senescence, and reduces melanoma tumor outgrowth in mouse models in vivo when given in combination with immunotherapy. Our study provides a high-resolution landscape of ICI-resistant cell states, identifies clinically predictive signatures, and suggests new therapeutic strategies to overcome immunotherapy resistance.
In Brief
Single-cell sequencing of checkpoint-inhibitor-resistant melanomas identifies predictive signatures to guide therapeutic approaches to overcome immunotherapy resistance.
Graphical Abstract
*Correspondence: benjamin_izar@dfci.harvard.edu.
AUTHOR CONTRIBUTIONS
A. Regev, B.I., C.H.Y., L.A.G., and L.J.-A. designed the study. A. Regev, B.I., L. A.G, O.R.-R., P.K.S., B.E.J., and K.W. obtained funding. L.J.-A., B.I., A. Regev, C.H.Y., O.R.-R., A. Rotem, P.S., M.S.C., C.R., M.-J.S., J.C.M., R.L., A.K., O.A., S. Mei, P.H., C.B., M.-A.F., J.-R.L., A.M.L., A.N.R.C., S.W., R.J.S., R.T., M. S.K., I.C., D.A.B., and B.R. conducted the research and interpreted the results. C.H.Y., D.L., G.Z., C.M., P.A.O., E.I.B., R.H., F.S.H., G.M.B., R.J.S., D.T.F., B.M., T.M., K.T.F., R.W.J., I.T., P.H., C.B., M.-A.F., M.H., B.S., A.K.S., E.M.V.A., D.S., and O.R.-R. provided profiling data or tissue for profiling. A. Regev, L.J.-A., and B.I. wrote the manuscript with input from all the authors. A. Regev, L.J.A., and B.I. performed the statistical analyses. All authors reviewed and approved the final manuscript.
DECLARATION OF INTERESTS
A. Regev is an SAB member for ThermoFisher Scientific, Syros Pharmaceuticals and Driver Group and a founder of Celsius Therapeutics. A. Regev, L.J.-A., B.I., O.R.-R., and A. Rotem are co-inventors on provisional patent application filed by the Broad Institute relating to this manuscript. L.A.G. is now an employee of Eli Lilly and company.
SUPPLEMENTAL INFORMATION
HHS Public Access
Author manuscript
Cell
. Author manuscript; available in PMC 2019 November 01.Published in final edited form as:
Cell. 2018 November 01; 175(4): 984–997.e24. doi:10.1016/j.cell.2018.09.006.
A
uthor Man
uscr
ipt
A
uthor Man
uscr
ipt
A
uthor Man
uscr
ipt
A
uthor Man
uscr
ipt
INTRODUCTION
Immune checkpoint inhibitors (ICIs) have transformed the therapeutic landscape of several cancer types (Sharma and Allison, 2015), especially melanoma. Nonetheless, many patients manifest resistance, which is often intrinsic (Sharma et al., 2017). Because ICI targets cell-cell interactions, resistance can stem from different cell-cells and their interactions in the tumor ecosystem. Recent studies illuminated ICI resistance with whole-exome sequencing (WES) and transcriptional profiles of bulk tumors (Hugo et al., 2016; Riaz et al., 2017; Van Allen et al., 2015) but had limited ability to dissect the cancer-immune interplay and generate reliable response biomarkers. Single-cell RNA sequencing (scRNA-seq) of patient tumors (Tirosh et al., 2016) can alleviate this limitation.
Infiltration of the tumor with T cells has been associated with patient survival and improved immunotherapy responses (Frid-man et al., 2012), but the determinants that dictate if a tumor will have high (“hot”) or low (“cold”) levels of T cell infiltration are only partially understood. Among multiple factors, malignant cells may play an important role in determining this phenotype. However, while current methods use bulk genomics to deconvolve the tumor’s composition (Newman et al., 2015), they cannot recover the salient intracellular programs of malignant cells. Thus, linking malignant cell states to T cell infiltration levels has been challenging.
Here, using an integrative data-driven approach (Figures 1A and 1B), we identified a malignant cell program that is associated with T cell exclusion and is predictive of ICI resistance. We demonstrated that CDK4/6 inhibitors repress this program and sensitize melanoma tumors to ICIs in mouse models. Our work provides a predictive biomarker for ICI response, suggests a new therapeutic modality that may sensitize melanoma tumors to ICIs, and provides a framework to study cell-cell interactions and drug effects in other tumor ecosystems.
A
uthor Man
uscr
ipt
A
uthor Man
uscr
ipt
A
uthor Man
uscr
ipt
A
uthor Man
uscr
ipt
RESULTS
Systematic Approach to discover Cancer-Cell-Autonomous Programs Associated with T Cell Exclusion
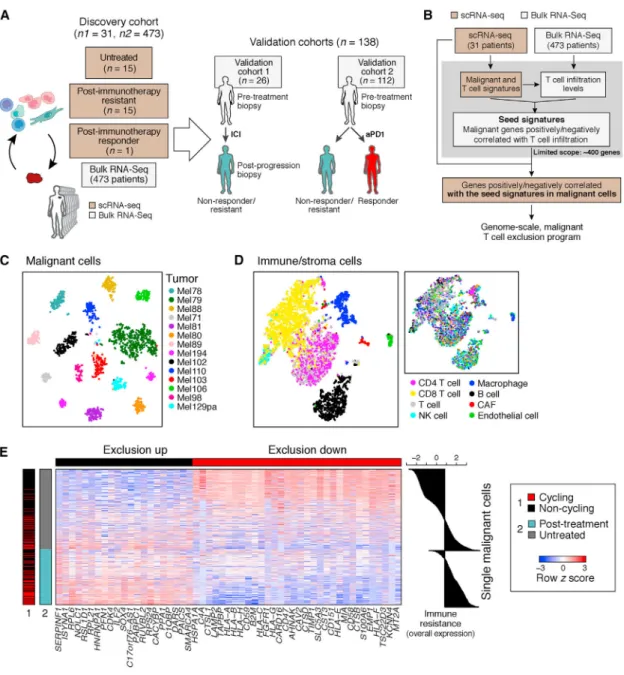
To identify malignant cell programs that characterize cold tumors, we combined scRNA-seq and bulk RNA-seq data to relate the state of one cell type to the tumor composition (Figure 1B and STAR Methods). We describe the strategy in a specific context, but it can be applied to other pairs of cell types. First, we use scRNA-seq profiles to define cell-type-specific signatures of T cells and malignant cells in melanoma. Using the T cell signature and bulk RNA-seq profiles, we infer T cell infiltration levels in hundreds of tumors. We then define a “seed exclusion program”–genes from the malignant cell signature whose expression is strongly correlated (positively or negatively) with T cell abundance across those bulk tumors. To avoid mRNA contamination by the tumor microenvironment, we restrict the seed program only to a few hundred genes that are exclusively expressed by malignant cells. To recover potentially important genes that are also expressed by non-malignant cells (e.g., major histocompatibility [MHC] class I), we search for genes that are correlated with the seed program across the malignant cells in the scRNA-seq data irrespective of their expression in other cell types. Finally, we define a genome-scale, malignant-cell exclusion program consisting of genes induced or repressed by malignant cells in cold versus hot tumors. We then score each cell or tumor based on its overall expression (OE) of the program, defined as the overexpression of its induced part and underexpression of its repressed part (STAR Methods).
Analysis of Clinical scRNA-Seq Identifies a Malignant Cell Program Associated with T Cell Exclusion
We applied our approach to 7,186 high-quality scRNA-seq profiles from 33 human melanoma tumors (from 31 patients) comprised of 2,987 cells from 17 newly collected patient tumors and 4,199 cells from 16 patient tumors that we previously reported (Tirosh et al., 2016) (Figure 1A, Tables S1A and S2, and STAR Methods; one patient overlaps), along with 473 bulk RNA-seq melanoma profiles from the Cancer Genome Atlas (TCGA) (Akbani et al., 2015). 15 of the tumors in the single-cell cohort are post-ICI-resistant tumors (Table S1A).
We distinguished different cell subsets based on their expression profiles and inferred copy-number variation (CNV) profiles (STAR Methods), identifying malignant cells, CD8+ and CD4+ T cells, B cells, natural killer (NK) cells, macrophages, cancer-associated fibroblasts (CAFs), and endothelial cells (Figures 1C, 1D, and S1 and Table S3). Malignant cells primarily grouped by their tumor of origin (Figure 1C) and non-malignant cells by their cell type (Figure 1D), as we previously observed (Tirosh et al., 2016).
We applied our approach to delineate the relationship between malignant cell states and CD8+ T cell infiltration, identifying a T cell exclusion program (Figure 1E and Table S4A). The repressed part of the program was enriched for genes involved in antigen processing and presentation (e.g., B2M, CTSB, HLA-A/B/C, and TAPBP; p = 3.26 × 10⁻¹⁰, hypergeometric test), interferon (IFN-γ) signaling pathways (p = 2.94 × 10⁻⁹), response to the complement
A
uthor Man
uscr
ipt
A
uthor Man
uscr
ipt
A
uthor Man
uscr
ipt
A
uthor Man
uscr
ipt
system (p = 1.13 × 10⁻⁸; e.g., CD59 and C4A), and immune modulation (p = 2.10 × 10⁻⁷; e.g., CD47 and CD58). The induced part included CDK4 and its downstream E2F targets (p = 3.97 × 10⁻⁵), transcriptional regulators (e.g., SOX4, SMARCA4), and numerous CDK7 and Myc targets (p < 1 × 10⁻¹⁷; Table S4A). Notably, the malignant cell programs associated with exclusion of different T cell subsets were highly overlapping (Figures S2A–S2C, Tables S3B and S4B, and STAR Methods).
The Exclusion Program Characterizes Malignant Cells from Patients who Progressed on Immunotherapy
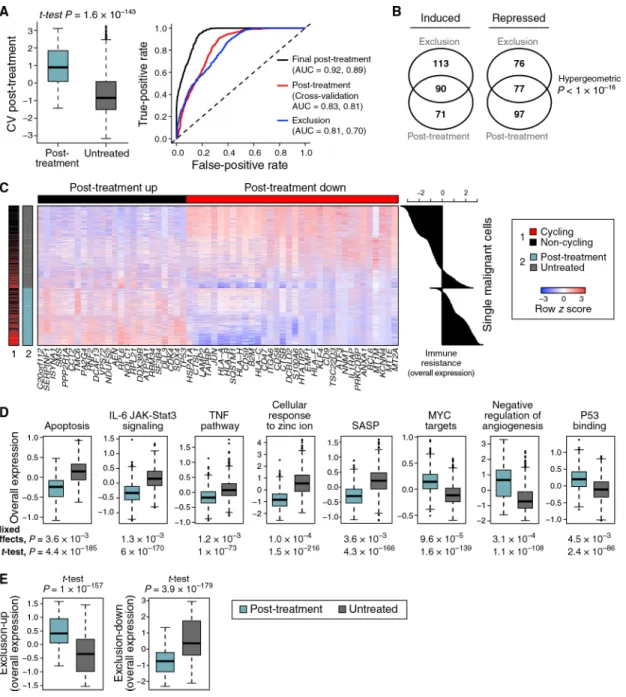
To determine whether the exclusion program is associated with ICI resistance, we tested wheter it is more pronounced in malignant cells from ICI-resistant versus untreated patients in our scRNA-seq cohort. As clinical response rates to ICI vary, with up to ~57% responders to ICI combinations (Larkin et al., 2015), the untreated tumors we profiled likely include both ICI-sensitive and ICI-resistant ones, whereas the ICI-resistant tumors likely include mostly resistant malignant cells. Comparing malignant cells from post-ICI-resistant tumors to malignant cells from untreated tumors, we found a robust and generalizable post-treatment transcriptional program (cross-validation area under the curve [AUC] = 0.83; Figure 2A, Table S4A, and STAR Methods). This program might reflect both the overall impact of ICI therapy and intrinsic ICI resistance per se, but those cannot be distinguished based on our single-cell cohort, which includes neither matched samples from the same patient nor pre-treatment tumors from responders and non-responders. We address this later in two validation cohorts (Tables S1B and S1C).
The post-treatment and exclusion programs substantially overlapped (Figures 1E, 2B, and 2C and Table S4A; p < 10−16, hypergeometric test) and highlighted similar modules and pathways (Figure 2D and Table S5). Both programs were more pronounced in the post-treatment malignant cells and robustly classified malignant cells as untreated or post treatment (AUC = 0.83 and 0.81 for cross-validation post treatment and exclusion,
respectively; Figures 2A and 2E). The upregulated components of both programs include 46 ribosomal protein (RP) genes, but their overlap remains significant even after removing RPs (p < 10−16,hyper-geometric test; Figure 2B). As Myc is a master regulator of ribosome biogenesis (Kress et al., 2015), the induced RP genes might reflect Myc activation. Indeed, the programs are enriched for Myc targets, even after removing RP genes (p < 7.18 × 10⁻¹⁰) and are predicted to be repressed by MYC knockdown according to the Connectivity Map (Subramanian et al., 2017).
In light of the congruence of the programs, we defined a unified immune resistance program as the union of the post-treatment and exclusion programs (Table S4A) and used it in all subsequent analyses unless indicated otherwise (STAR Methods).
The Immune Resistance Program Reflects a Coherent State of Immune Evasion
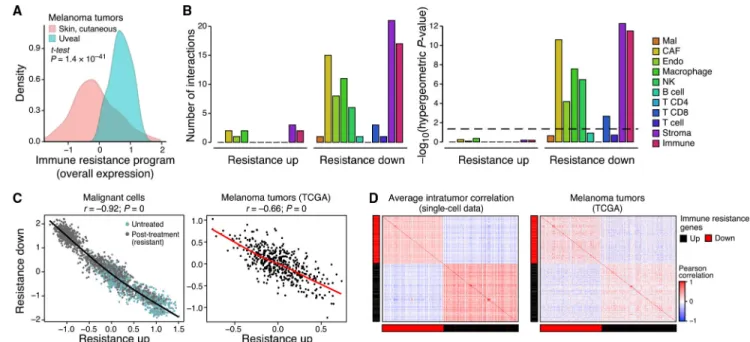
The immune resistance program manifests hallmarks of immune evasion, suppression, and exclusion. First, compared to cutaneous melanoma (where we initially identified it), the program is more pronounced in uveal melanoma (Figure 3A), which resides in an immune-privileged environment and has very low response rates to immunotherapy (Algazi et al.,
A
uthor Man
uscr
ipt
A
uthor Man
uscr
ipt
A
uthor Man
uscr
ipt
A
uthor Man
uscr
ipt
2016). Second, inhibition of genes from the repressed component of the program in malignant melanoma cells conferred resistance to CD8+ T cells in a genome-wide CRISPR screen (p =1.67 × 10⁻³, hypergeometric test) (Patel et al., 2017). Third, the program marks the suppression of physical interactions between resistant malignant cells and other cell types in the tumor microenvironment, including MHC I:TCR (T cells), CD58:CD2 (T cells), and IL1RAP:IL1B (macrophages) (Figure 3B and STAR Methods), as well as the
senescence-associated secretory phenotype (SASP) (p = 4.3 × 10−166 and 3.6 × 10⁻³, one-sided t test and mixed effects, respectively; Figure 2D), which has been shown to enhance T cell responses (Gordy et al., 2016).
The program’s genes appear to be under shared control by a few master regulators. The expression of genes within each components (induced or repressed) is positively correlated, while the induced genes are anti-correlated with the repressed genes, both across single cells in one tumor and across TCGA tumors (Figures 3C, 3D, and S3). Thus, any given aspect of the program (e.g., underexpression of antigen presentation) is coupled to the state of the entire program. Moreover, there is a significant overlap between the perturbations that reverse the expression of the program’s repressed and induced components (p = 4.35 × 10⁻⁶, hypergeometric test), including the overexpression of IFN-γ and IFN-β and the knockdown of MYC and CDK7 (Subramanian et al., 2017). The latter mirrors the significantly large number of Myc and CDK7 (direct) targets (Oki et al., 2018; Subramanian et al., 2005) in the program (p < 1 × 10⁻¹⁷, hypergeometric test). Further supporting the role of CDKs as regulators, the program is more pronounced in cycling cells, though it is present and detectable in non-cycling cells (Figures 1E and 2C; p < 8.42 × 10⁻²⁷, mixed effects). Notably, the association between cellular proliferation and the resistant program is only partial, and the two cell states can be decoupled (Figures S2D–S2H, Table S4B, and STAR Methods).
We compared the immune resistance program to 12 signatures (Table S6A) previously associated with the response to immunotherapy (Ayers et al., 2017; Hugo et al., 2016; Riaz et al., 2017) or targeted therapy (RAF and MEK inhibitors) (Hugo et al., 2015; Tirosh et al., 2016) in melanoma patients. Four of the six signatures that characterize immunotherapy-sensitive melanoma were enriched with one or more of our T cell signatures (p < 1 × 10⁻³, hypergeometric test), suggesting that they capture tumor composition and not malignant cell states. The induced component of our resistance program was not enriched in any of the previous 12 signatures. The repressed component was enriched in two signatures of immunotherapy sensitivity (p <2.65 × 10⁻³, hypergeometric test) and with signatures associated with sensitivity and resistance to targeted therapy (p <1.48 × 10⁻⁴) (Tirosh et al., 2016).
Malignant Cells in T Cell-Depleted Niches Express Features of the Resistance Program In
Situ
To test if the resistance program in malignant cells is associated with T cell exclusion in situ, we used multiplexed immunofluorescence (t-CyCIF) (Lin et al., 2018). We stained
histological sections of 19 tumors (472,771 cells per image on average) from our single-cell cohort for 14 proteins: six cell type markers (CD3, CD8, MHC-II, FOXP3, S100, and MITF)
A
uthor Man
uscr
ipt
A
uthor Man
uscr
ipt
A
uthor Man
uscr
ipt
A
uthor Man
uscr
ipt
and seven resistance program members (induced: p53, Myc, and DLL3; repressed: HLA-A, c-Jun, SQSTM1, and LAMP2). Following cell segmentation and intensity quantification (STAR Methods), we assigned malignant cells (S100+, MITF+), T cells (CD3+), and cytotoxic T cells (CD8+); the rest were defined as uncharacterized.
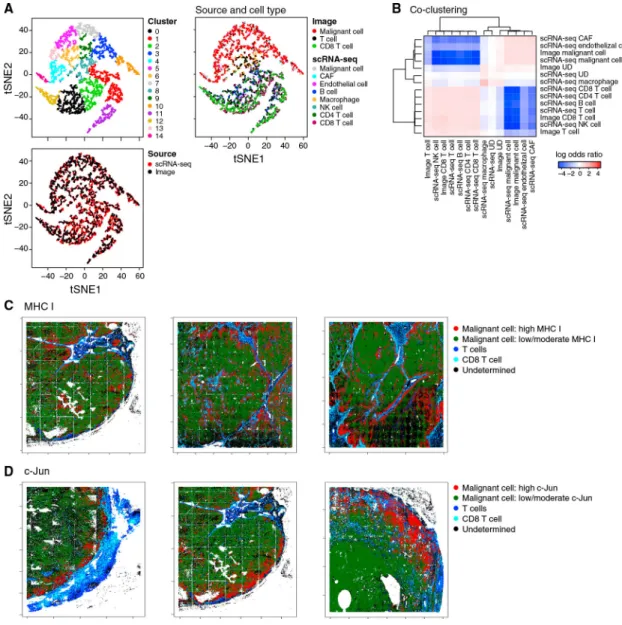
The scRNA-seq and multiplex in situ protein profiles were congruent by cell-type
assignment and by resistance program assessment. First, combining the two datasets using a variant of canonical correlation analysis (CCA) (Butler et al., 2018) (STAR Methods) successfully embedded and clustered cells primarily by type and not by method (Figures 4A, 4B, and S4). Second, the average immune resistance scores of the different tumors according to their in situ images were correlated with their scores according to scRNA-seq (R = 0.57, p = 0.041) (STAR Methods), even though the scRNA-seq and the in situ image of each tumor were obtained from separated specimens, measuring RNA versus protein, respectively. Additionally, in both cases, the inter-tumor variation of the program was significantly greater than its intra-tumor variation (p < 1 × 10⁻³⁰, ANOVA).
As predicted, the resistance score we computed from all seven program markers (STAR Methods) was significantly higher in malignant cells that reside in cold niches (p = 1.18 × 10⁻⁶, mixed effects). Aside from LAMP2, individual markers also showed the predicted trend: malignant cells in cold niches had significantly lower levels of markers repressed in the resistance program (Figures 4C and 4D; p = 1.41 × 10⁻¹³ and 8.35 × 10⁻¹⁸, mixed effects, for c-Jun and HLA-A, respectively), whereas p53 (induced in the resistance program) characterized cold niches (p = 5.25 × 10⁻³, mixed effects). Thus, our analysis validates our signature and its association with cold niches at the protein level in situ.
The Resistance Program Is Expressed Prior to Treatment and Is Enhanced following Immunotherapy in Resistant Lesions
We hypothesized that the immune resistance program, while more pronounced in the malignant cells of resistant patients after ICI, in fact reflects intrinsic resistance. Supporting this, the program is detected in untreated TCGA melanoma tumors and in a subset of malignant cells from untreated patients (Figures 1E and 2C, right plots).
To test this hypothesis, we analyzed an independent RNA-seq cohort of 90 specimens collected from 26 metastatic melanoma patients throughout the course of treatment. 14 patients received ICI therapy (anti-PD1 or anti-CTLA4) without prior targeted therapy, and 12 patients first received targeted therapy (BRAF/MEK inhibitors) followed by ICI after tumor progression (Figure 1A and Table S1B, validation cohort 1). The cohort has several partially overlapping sets (Table S1B): treatment naive (n = 18), on targeted therapy (n = 17), post targeted therapy (n = 25), on ICI (n = 35), and post ICI (n = 50). Given this composition, we used a mixed-effects model to determine the effects of the different treatments. As expected, we found a significant induction in the (inferred) T cell fraction of tumors on ICI treatment (p = 1.85 × 10⁻³, mixed-effects test), but not on targeted therapy. The program was induced in on- and post-ICI samples compared to pre-ICI samples from the same patient (p = 7.41 × 10⁻³, mixed-effect test, controlling for tumor composition; STAR Methods). However, inter-patient variation in the program’s expression was
A
uthor Man
uscr
ipt
A
uthor Man
uscr
ipt
A
uthor Man
uscr
ipt
A
uthor Man
uscr
ipt
significantly higher than these intrapatient changes (p < 4.98 × 10⁻¹⁴, ANOVA). This suggested that the major differences between the post-ICI and untreated tumors in the single-cell cohort reflect, at least in part, intrinsic differences between the two groups, which preceded the treatment.
We did not observe an induction of the program following RAF/MEK-inhibition. We confirmed this in another cohort of patient-matched melanoma tumors biopsied before MAPK-inhibition and during disease progression (Hugo et al., 2015) (p > 0.1, mixed effects).
The Resistance Program Predicts ICI Responses in Melanoma Patients
Next, we used the OE of the program (with and without an additional refinement; Table S4A and STAR Methods) to estimate the immune resistance level of a given tumor and tested its ability to predict clinical outcomes (Figures 5, S5, and S6).
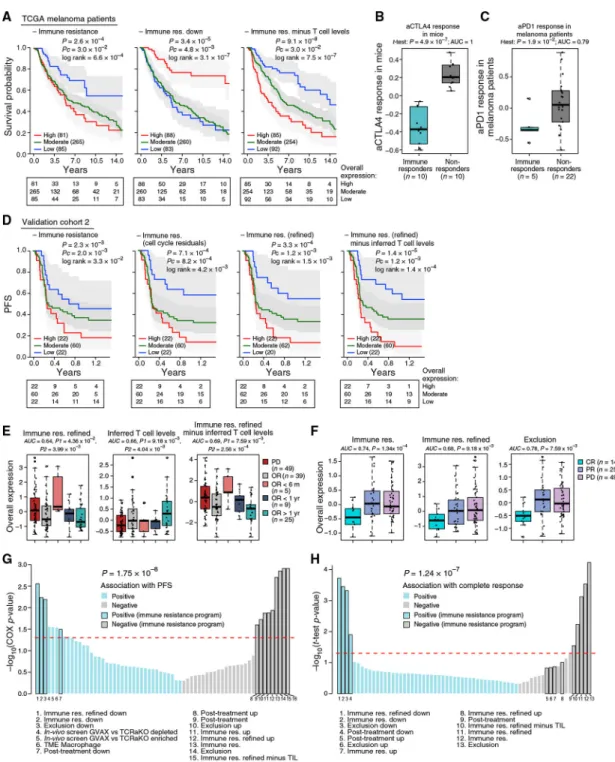
The program’s expression was associated with poor survival in 473 TCGA melanoma patients (Figures 5A and S5) and also when controlling for tumor purity and inferred T cell infiltration. Combining the program with inferred T cell infiltration levels yielded
significantly more accurate predictions than either alone (p = 9.1 × 10⁻⁸, COX regression; Figure 5A, right). Other proposed mechanisms, such as de-differentiation of melanoma cells reflected by an MITF-low state, and other malignant cell signatures (Tirosh et al., 2016) were not associated with survival, indicating that mere biological variation across malignant cells is insufficient for prognosis.
To test if the program can predict clinical responses to ICI, we analyzed five RNA-seq cohorts collected from melanoma patients prior to ICI treatment: validation cohort 2 collected by us across 112 patients (validation cohort 2; Figure 1A), validation cohort 1 (pre-ICI samples; Figure 1A), and three published cohorts of less than 50 patients each (Hugo et al., 2015; Riaz et al., 2017; Van Allen et al., 2015). We compared our predictors to 47 other gene signatures (Table S6A and STAR Methods), which we tested as alternative predictors, including commercial immune panels, the top hits of two CRISPR screens of resistance to T cells and anti-PD-1 (Manguso et al., 2017; Patel et al., 2017), and signatures generated by analyzing previous melanoma ICI cohorts (Hugo et al., 2016; Riaz et al., 2017).
The program’s expression distinguished ICI responders from non-responders (Figures 5B and 5C). In a lung cancer mouse model, its expression early on-treatment separated anti- CTLA-4 non-responders from responders (p = 4.89 × 10⁻⁷, one-sided t test; Figure 5B) (Lesterhuis et al., 2015). In 27 melanoma patients treated with pembrolizumab (anti-PD-1) (Hugo et al., 2016), underexpression of the program pre-treatment distinguished the five complete responders (p = 5.80 × 10⁻³ and 1.89 × 10⁻², one-sided t test, refined and non-refined version, respectively; Figure 5C). In 42 melanoma patients treated with CTLA-4 blockade using ipilimumab (Van Allen et al., 2015), it was lower in the two complete-responders pre-treatment. In 43 melanoma patients profiled before and early on-treatment with nivolumab (anti-PD-1) (Riaz et al., 2017), it was downregulated early on-treatment specifically in responders (p < 9.60 × 10⁻⁶, hypergeometric test). However, in this specific cohort, the pre-treatment expression of the program (and of all other alternative predictors)
A
uthor Man
uscr
ipt
A
uthor Man
uscr
ipt
A
uthor Man
uscr
ipt
A
uthor Man
uscr
ipt
was not associated with response, possibly due to the small number (three) of complete responders. In validation cohort 1, the program was underexpressed in the 7 pre-ICI samples from patients with an objective response (OR, including partial or complete response) compared to 12 pre-ICI samples from non-responders (progressive disease [PD]; p = 7.88 × 10⁻³, one-sided t test).
Finally, we tested the predictive value of the program in 112 patients with metastatic melanoma who underwent a pretreatment biopsy and RNA-seq followed by anti-PD-1 therapy (Figure 1A, validation cohort 2, and Tables S1C and S6B). We evaluated the program’s performance in predicting (1) progression-free survival (PFS, available for 104 patients; Figure 5D), (2) OR (including partial or complete response; Figure 5E), and (3) complete response (Figure 5F and STAR Methods).
The program was predictive of PFS (Figures 5D and S6), including when accounting for other potential biomarkers (T cell infiltration levels and PD-L1 expression) (Figure S6E). It outperformed all the alternative predictors we tested (Table S6A; p = 1.75 × 10⁻⁸, Wilcoxon rank-sum test), which were either not predictive or did not provide additional predictive value once accounting for T cell infiltration levels of the tested tumors (Figure 5G). Although the program was more pronounced in cycling cells, cell cycle alone was not associated with PFS (p > 0.25, COX regression), nor was a signature of malignant-specific genes that characterizes cycling malignant cells (p > 0.05, COX regression). Filtering the cell-cycle component from the resistance program score (STAR Methods) further improved PFS predictions (Figure 5D), suggesting that a tumor’s immune resistance profile should be evaluated considering its proliferation level.
The program was strongly underexpressed in patients with OR compared to those without response (PD) (Figure 5E). Moreover, patients with OR that nonetheless had high pre-treatment expression of the program were significantly more likely to rapidly (<6 months) develop PD (Figure 5E). Consistently, the program was most accurate in predicting complete responses (p =1.34 × 10⁻⁴, one-sided t test; Figure 5F), outperforming all other tested predictors (p = 1.24 × 10⁻⁷, Wilcoxon rank-sum test) (Figure 5H).
The Resistance Program Is Coherently Controlled by CDK4/6
Next, we sought to pharmacologically target the program. We first identified drugs that were significantly more toxic to cell lines intrinsically overexpressing the program in a screen of 131 drugs across 639 human cell lines (STAR Methods) (Garnett et al., 2012). The third-highest-scoring drug was the CDK4/6 inhibitor (CDK4/6i) palbociclib (p =1.01 × 10⁻⁴, mixed effects). We confirmed this in another screen of two CDK4/6i (palbociclib and abemaciclib) across hundreds of cell lines (Gong et al., 2017) (p = 3.96 × 10⁻⁵, mixed effects; Figure 6A).
We hypothesized that CDK4/6 may act as master regulators of the program. Multiple CDK target genes are members of the induced program (Table S4A), and CDK4 is a member of the induced component of both the exclusion and the post-treatment programs (Figures 1E and 2C). Three genes (CDKN2C/p18, CDKN1B/p27, and CDKN1A/p21) that inhibit CDK4 repress the program when overexpressed (Subramanian et al., 2017) (STAR Methods), and
A
uthor Man
uscr
ipt
A
uthor Man
uscr
ipt
A
uthor Man
uscr
ipt
A
uthor Man
uscr
ipt
the program is more pronounced in cycling cells (Figures 1 E, 2C, and S2E), where CDK4/6 are active. Finally, analysis of published gene expression profiles of breast cancer cell lines and mouse models (Goel et al., 2017) showed that CDK4/6i represses the resistance program (Figures 6B–6D).
CDK4/6 Inhibitors Repress the Resistance Program in Melanoma Cells
We therefore tested if CDK4/6i could shift the malignant cell population to a less immune resistant state. We selected three melanoma cell lines that strongly expressed the program (Table S7A), two of which are RB1 sufficient (IGR37 and UACC257) and one that is RB1 deficient (A2058). We profiled each cell line with scRNA-seq before and after treatment with abemaciclib, analyzing >23,000 cells (Figures 6E and 6F and Table S2). The program’s expression varied between cells within each line, despite the absence of non-malignant cells, suggesting cell-intrinsic regulation (Figures 6E and 6F, panel 4). In the RB-sufficient cell lines, IGR37 and UACC257, 10% of cells had exceptionally strong expression of the program (“immune-resistant” cells) prior to treatment. Post treatment, the relative abundance of these cells decreased to 2% and 0.6% of the total population, respectively (Figures 6E and 6F, panel 4). In the RB1-deficient cell line A2058, the treatment did not repress the resistant state, consistent with the fact that the impact of CDK4/6i isRB1 dependent (Goel et al., 2017) (Figure S7A). In the two RB-sufficient cell lines, post-treatment cells showed substantial transcriptional changes linked to the resistance program. Abemaciclib induced the MITF program (Tirosh et al., 2016) (p < 1 × 10⁻¹⁷, hypergeometric test; Figures 6E and 6F, panel 5), which is repressed in immune-resistant cells and is associated with melanocytic differentiation. Abemaciclib also repressed the expression of DNMT1 (p < 2.23 ×10−106, likelihood-ratio test; Figures 6E and 6F, panel 7), which has been shown to confer an immunogenic phenotype (Goel et al., 2017).
Expression of the SASP—a repressed component in the resistance program—was induced in abemaciclib-treated cells (p < 3.33 × 10⁻¹⁶, hypergeometric test; Figures 6E and 6F, panel 6). Abemaciclib also increased cytokine secretion (Figure 6G and Table S7B),
β-galactosidase activity, and morphological alterations that reflect cellular senescence (Figure 6H). It reduced proliferation rates compared to DMSO (0.3 versus 0.64 doublings per 24 hr, p < 1 × 10⁻⁴, t test; Figures 6E and 6F, panel 3) but was not cytotoxic.
Next, we tested abemaciclib effects on malignant cells in the presence of tumor-infiltrating T lymphocytes (TILs) in a patient-derived co-culture of melanoma cells and autologous ex vivo expanded TILs. While TIL exposure alone represses the immune resistance program in both conditions (p < 7.94 × 10⁻⁷, one-sided t test), this effect was smaller compared to the intrinsic variation between cells of the same cell line (IGR37; Figure 6E, panel 4; p < 8.17 × 10⁻¹², F test). Treatment with abemaciclib alone or with additional TIL exposure
significantly repressed the resistance program (p < 7.72 × 10⁻³, one-sided t test; Figure S7B). Overall, these results indicate that the resistance program is mostly intrinsically regulated and can be repressed by CDK4/6i.
A
uthor Man
uscr
ipt
A
uthor Man
uscr
ipt
A
uthor Man
uscr
ipt
A
uthor Man
uscr
ipt
CDK4/6 Inhibition Enhances ICI Efficacy In Vivo
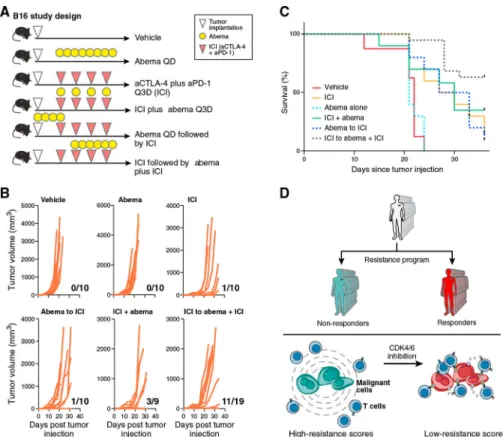
To determine abemaciclib’s efficacy in promoting anti-tumor activity in vivo, we tested its effect in the context of ICI therapy in the B16 melanoma model, which is relatively resistant to ICIs (Curran et al., 2010). scRNA-seq of B16, MC38, and CT26 cell lines in vitro showed that the resistance program is intrinsically expressed in most B16 cells but only in a portion of CT26 and MC38 cells (Figures S7C and S7D), corresponding to the responses of these models to ICI in vivo. We implanted B16 tumors in C57BL/6 mice and treated with different therapy arms (Figure 7A). Compared to vehicle, abemaciclib monotherapy had no impact on the rate of tumor outgrowth, but when used in a phased combination (ICI followed by ICI plus abemaciclib), there was a significant reduction in the rate of tumor outgrowth and improved survival (Figures 7B and 7C). Depletion of CD8+ T cells resulted in loss of the beneficial effect of phased combination therapy (Figures S7E and S7F) and the effect was at least in part RB dependent in the malignant cells (data not shown). Thus, abemaciclib may sensitize melanoma tumors to immunotherapies, even in the case of intrinsic resistance.
DISCUSSION
By leveraging clinical scRNA-seq data and multiple patient cohorts, we mapped malignant cell states associated with ICI resistance, revealing a coherent program that has a prognostic and predictive value and may be therapeutically targeted.
The program predicted ICI responses in several independent cohorts, outperforming other published signature-based biomarkers. Unlike our program, many of the existing biomarkers capture the tumor composition and do not have an additive predictive value once accounting for the inferred T cell levels. Our program predicts responses to anti-PD-1, and to some extent also to anti-CTLA-4 therapy, yet additional studies are required to dissect treatment-specific effects and predict ICI in all patients/cohorts.
The program is primarily associated with intrinsic ICI resistance. It is observed in bulk RNA-seq of untreated tumors and in a subset of ~24% of malignant cells of ~80% of untreated tumors. We predict that these malignant cells will have a selective advantage during ICI treatment. Indeed, the program is more pronounced after ICI failure, but not post targeted therapy, indicating that it does not merely reflect the impact of any therapeutic intervention.
By integrating scRNA-seq and in situ images of matched tissue slides, we showed that the program is robustly detected and consistent across data modalities and patient samples and is associated with cold niches within tumors. A key question is whether the program merely captures the response of malignant cells to immune infiltrates or marks an intrinsic mechanism that allows malignant cells to escape immunity and shape their
microenvironment. As we show, the program expression varies across malignant human cell lines, which are not exposed to cues from non-malignant cells. Such intrinsic expression in vitro across mouse cell lines is aligned with their in vivo response to ICI.
Compounds that repress the program may sensitize malignant cells to immunotherapy and T cell-mediated killing (Figure 7D). We demonstrated that a CDK4/6i reverses the resistant
A
uthor Man
uscr
ipt
A
uthor Man
uscr
ipt
A
uthor Man
uscr
ipt
A
uthor Man
uscr
ipt
cell state, induces components of SASP, and improves responses to ICI in vivo. These mechanisms are distinct from previously described immune-enhancing mechanisms of CDK4/6i (Deng et al., 2018; Goel et al., 2017) and indicate a potential role of CDK4/6, and specifically CDK4, as one of the master regulators of the program. Thus, CDK4/6i
administered in a phased fashion could potentially alleviate ICI resistance in some melanoma patients, consistent with a recent observation (Schaer et al., 2018). More generally, the program’s repression in vitro could be a readout to screen for other compounds that sensitize melanoma tumors to ICI.
The program may be relevant in other tumor types. It is lower in some of the more ICI-responsive tumors (kidney, skin, lung) and higher in tumor types that are less ICI-responsive and/or arise from immune-privileged tissues (eye, testis) (Figures S7G and S7H). Synovial sarcoma, which is driven by a single genomic aberration in the BAF complex, has the highest resistance scores. The BAF complex plays a key role in ICI resistance (Pan et al., 2018), and one of its subunits (SMARCA4) is upregulated in the resistance program. While we focused on malignant-cell-intrinsic mechanisms, we also tested for association of T cell abundance with the state of macrophages and B cells (Table S4C). We found a significant association only with macrophages: in cold niches/tumors, macrophages underexpress PD-L2, MHC class II genes (p < 1 × 10⁻¹⁷, hypergeometric test), and IFN-γ response genes (p = 9.76 × 10⁻¹⁰) and upregulate immunosuppressants, such as hypoxia genes (p = 4.55 × 10⁻⁶) and interleukin-8 (IL-8). Unlike the malignant cell program, the macrophage program was not associated with ICI resistance. Hence, it may represent the response of macrophages to T cell abundance rather than a cause of T cell exclusion. Overall, our work sheds light on the interplay between cells and their microenvironment in tumors, uncovers improved biomarkers for patient selection, and reveals principles for new therapeutics.
STAR
★
METHODS
CONTACT FOR REAGENT AND RESOURCE SHARING
Further information and requests for resources and reagents should be directed to and will be fulfilled by the Lead Contact, Benjamin Izar (benjamin_izar@dfci.harvard.edu).
EXPERIMENTAL MODEL AND SUBJECT DETAILS
Human tumor specimen collection—For the discovery scRNA-seq cohort, tissue was procured under Institutional Review Board (IRB) approved protocols at Brigham and Women’s Hospital and Dana-Farber Cancer Institute, Boston, MA. Patients were consented to these protocols (11–104) in clinic visits prior to surgery/biopsy. Patients included in our earlier study (Tirosh et al., 2016), and those specimens newly collected here are annotated in Table S1A.
For validation cohorts (bulk-RNA-Seq), patient tissue was collected under IRB protocols of the University Hospital Essen, Germany and Massachusetts General Hospital, Boston, MA
A
uthor Man
uscr
ipt
A
uthor Man
uscr
ipt
A
uthor Man
uscr
ipt
A
uthor Man
uscr
ipt
(protocol 11–181) and The Wistar Institute, Philadelphia, PA (Human subjects protocol 2802240).
Validation Cohort 1 included 90 samples from 26 patients, with multiple biopsies per patient, taken before, during, and/or after various treatment regimens, including both targeted therapies and immunotherapies. Clinical information, including the patient sex, age, and (ongoing/past) treatments when the sample was obtained are provided in Table S1B. Validation Cohort 2 included 112 samples collected before treatment with pembrolizumab. Clinical information is provided in Tables S1C, including patient sex, and response to ICI (PFS, and RECIST). Information regarding the patient age was not available to us, and hence cannot be provided. Genes expression is provided in Table S6B.
Melanoma human cell lines—Established melanoma cell lines IGR39, A2058 and UACC62 were acquired from the Cancer Cell Line Encyplopedia (CCLE) from the Broad Institute. IGR39 was obtained from a 26 years old male patient. A2058 is an established cell line derived from a 43 years old male patient, UACC62 from a male patient (age unknown). Melanoma cell line 2686 and matched TILs ( = co-culture) were derived from a male patient (age unknown) and provided by MDACC (Peng et al., 2016).
Mouse cell line cultures—B16F10, MC38 and CT26 cell line were obtained from American Type Culture Collection (ATCC). B16F10 was derived from a male mouse, MC38 and CT26 were derived from female mice.
In vivo mouse model—B16F10 cells were subcutaneously injected into 6 weeks old female C57BL/6 mice (The Jackson Laboratory). All experiments were performed in accordance with the Dana-Farber Cancer Institute (DFCI) IACUC guidelines at the DFCI Longwood Center Animal Resource Facility per protocol 08–049.
METHOD DETAILS
scRNA-seq cohort data collection
Tissue handling and tumor disaggregation: Resected tumors were transported in DMEM
(ThermoFisher Scientific, Waltham, MA) on ice immediately after surgical procurement. Tumors were rinsed with PBS (Life Technologies, Carlsbad, CA). A small fragment was stored in RNA-Protect (QIAGEN, Hilden, Germany) for bulk RNA and DNA isolation. Using scalpels, the remainder of the tumor was minced into tiny cubes < 1 mm3 and transferred into a 50 mL conical tube (BD Falcon, Franklin Lakes, NJ) containing 10 mL pre-warmed M199-media (ThermoFisher Scientific), 2 mg/mL collagenase P (Roche, Basel, Switzerland) and 10U/μl DNase I (Roche). Tumor pieces were digested in this media for 10 min at 37°C, then vortexed for 10 s and pipetted up and down for 1 min using pipettes of descending sizes (25 ml, 10 mL and 5 ml). As needed, this was repeated twice more until a single-cell suspension was obtained. This suspension was then filtered using a 70μm nylon mesh (ThermoFisher Scientific) and residual cell clumps were discarded. The suspension was supplemented with 30 mL PBS (Life Technologies) with 2% fetal calf serum (FCS) (Gemini Bioproducts, West Sacramento, CA) and immediately placed on ice. After
A
uthor Man
uscr
ipt
A
uthor Man
uscr
ipt
A
uthor Man
uscr
ipt
A
uthor Man
uscr
ipt
centrifuging at 580 g at 4°C for 6 min, the supernatant was discarded and the cell pellet was re-suspended in PBS with 1% FCS and placed on ice prior to staining for FACS.
Fluorescence-activated cell sorting: Single-cell suspensions were stained with CD45-FITC
(VWR, Radnor, PA) and live/dead stain using Zombie Aqua (BioLegend, San Diego, CA) per manufacturer recommendations. First, doublets were excluded based on forward and sideward scatter, then we gated on viable cells (Aqualow) and sorted single cells (CD45+ or CD45−) into 96-well plates chilled to 4°C, pre- prepared with 10μl TCL buffer (QIAGEN) supplemented with 1% beta- mercaptoethanol (lysis buffer). Single-cell lysates were sealed, vortexed, spun down at 3,700 rpm at 4°C for 2 min, placed on dry ice and transferred for storage at −80°C.
Library construction and sequencing: For plate-based scRNA-seq, we used a modified
SMART-Seq2 protocol, as described previously (Trombetta et al., 2014). Briefly, cell lysates were thawed on ice, and RNA was purified using SPRI beads (Beckman Coulter, Brea, CA), followed by reverse transcription (RT). For RT, RNA species are incubated with the SMART CDS Primer IIA for 3 min at 72°C and placed on ice. Next., SMARTer IIA oligonucleotide and SMARTScribe RT were used for generating cDNA, and cleaned using SPRI beads (Beckman Coulter) per manufacturers’ instructions. For Whole- transcriptome amplification (WTA), we used Advantage 2 polymerase mix and IS PCR Primer (Clontech Ultra-low Input RNA-Kit). WTA products were cleaned with Agencourt XP DNA beads and 70% ethanol (Beckman Coulter) and Illumina sequencing libraries were prepared using Nextera XT kit (Illumina, San Diego, CA) The 96 samples of a multiwell plates were pooled, and cleaned with two 0.8X DNA SPRIs (Beckman Coulter). Library quality was assessed with a high sensitivity DNA chip (Agilent) and quantified with a high sensitivity dsDNA Quant Kit (Life Technologies).
For droplet-based scRNA-seq, experiments were performed on the 10x Genomics Chromium platform, with the Chromium Single Cell 3′ Library & Gel Bead Kit v2 and Chromium Single Cell 3′ Chip kitv2 according to the manufacturer’s instructions in the Chromium Single Cell 3′ Reagents Kits V2 User Guide. Briefly, ~6,000 cells were re-suspended in PBS supplemented with 0.04% BSA and loaded to each channel. The cells were then partitioned into Gel Beads in Emulsion in the GemCode instrument, where cell lysis and barcoded reverse transcription of RNA occurred, followed by amplification, shearing and 5′ adaptor and sample index attachment.
Barcoded single cell transcriptome libraries were sequenced with 38bp paired end reads on an Illumina NextSeq 500 Instrument.
RNA-Seq of validation cohorts 1 and 2—RNA extraction from formalin-fixed, paraffin-embedded (FFPE) tissue slides was performed by the Genomics Platform of the Broad Institute (Cambridge, MA). For cDNA library construction total RNA was assessed for quality using the Caliper LabChip GX2 (Perkin Elmer). The percentage of fragments with a size greater than 200nt (DV200) was calculated and an aliquot of 200ng of RNA was used as the input for first strand cDNA synthesis using Illumina’s TruSeq RNA Access Library Prep Kit. Synthesis of the second strand of cDNA was followed by indexed adaptor
A
uthor Man
uscr
ipt
A
uthor Man
uscr
ipt
A
uthor Man
uscr
ipt
A
uthor Man
uscr
ipt
ligation. Subsequent PCR amplification enriched for adapted fragments. The amplified libraries were quantified using an automated PicoGreen assay (Thermo Fisher Scientific, Cambridge, MA). 200ng of each cDNA library, not including controls, were combined into 4- plex pools. Capture probes that target the exome were added, and hybridized for the recommended time. Following hybridization, streptavidin magnetic beads were used to capture the library-bound probes from the previous step. Two wash steps effectively remove any nonspecifically bound products. These same hybridization, capture and wash steps are repeated to assure high specificity. A second round of amplification enriches the captured libraries. After enrichment, the libraries were quantified with qPCR using the KAPA Library Quantification Kit for Illumina Sequencing Platforms (Illumina) and then pooled
equimolarly. The entire process was performed in 96-well format and all pipetting was done by either Agilent Bravo or Hamilton Starlet. Pooled libraries were normalized to 2nM and denatured using 0.1 N NaOH prior to sequencing. Flowcell cluster amplification and sequencing were performed according to the manufacturer’s protocols using Illumina HiSeq 2000 or 2500 (Illumina). Each run was a 76bp paired-end with an eight-base index barcode read. Data was analyzed using the Broad Picard Pipeline (http://broadinstitute.github.io/ picard/), which includes de-multiplexing and data aggregation.
In situ imaging—Formalin-fixed, paraffin-embedded (FFPE) tissue slides, 5 μm in thickness, were generated at the Brigham and Women’s Hospital Pathology Core Facility from tissue blocks collected from patients under IRB-approved protocols (DFCI 11–104). Multiplexed, tissue cyclic immunofluorescence (t-CyCIF) was performed as described recently (Lin et al., 2018). For direct immunofluorescence, we used the following antibodies: CEP170 (Abcam, ab84545), LAMP2 (R&D technologies, AF6228), MITF (Abcam, ab3201), DLL3 (Abcam, ab103102, Rab), MITF (Abcam, ab3201, Ms), S100α −488 (Abcam, ab207367), CD3–555 (Abcam, ab208514), CD8a-660 (eBioscience, 50– 0008-80), cJUN-488 (Abcam, ab193780), cMyc-555 (Abcam, ab201780), HLAA-647 (Abcam, ab199837), TP53–488 (Cell Signaling, 5429), SQSTM1–555 (Abcam, ab203430). Stained slides from each round of CycIF were imaged with a CyteFinder slide scanning fluorescence microscope (RareCyte Seattle WA) using either a 10X (NA = 0.3) or 40X long- working distance objective (NA = 0.6). Imager5 software (RareCyte) was used to
sequentially scan the region of interest in 4 fluorescence channels. Image processing and single-cell quantification was performed as previously described (Lin et al., 2018). Briefly, background subtraction was performed using the established rolling ball algorithm (with a 50-pixel radius) followed by registration in ImageJ. Nuclear stainings from each cycle were used to generate reference coordinates by Rigid-body transformation, and these coordinates were used to virtually hyper-stak all acquired 4-color-cycles. To obtain multiplex intensity measurements for single cells, images were first thresh-olded using the OTSU algorithm and binarized in the nuclear staining channels, and the Watershed algorithm (based on nuclear staining) was used to segment individual cells. For this purpose, the cytoplasm was captured by centripetal expansion (starting from the nucleus) of either of 3 pixels (10X objective) and 6 pixels (40X objective) toward the cells’ boundaries, defined as the cell membrane. The cytoplasm was defined as the region between defined as cell membrane and nucleus. Single-cell intensity measures were determined by projecting fluorescence-intensities to the
A
uthor Man
uscr
ipt
A
uthor Man
uscr
ipt
A
uthor Man
uscr
ipt
A
uthor Man
uscr
ipt
coordinates of segmented individual cells. Additional details, protocols and code are deposited in https://www.cycif.org/.
Abemaciclib treatment of melanoma cell lines—Established melanoma cell lines IGR39, UACC62 and A2058 were treated every 3 days with 500 nM abemacilib
(LY2835219, Med-ChemExpress) or DMSO control. The doubling time of each cell line was established and lines were seeded such that cells collected for scRNA-seq were derived from culture dishes with ~50%–60% confluency on day 7 of treatment. Cells were lifted of culture dishes using Versene solution (Life Technologies), washed twice in 1x PBS, counted and resuspended in PBS supplemented with 0.04% BSA for loading for scRNA-seq with the 10X Genomics platform.
Abemaciclib cytostatic effects—5 × 10⁴ human melanoma cells (cell line 2686) were seeded and treated with either DMSO or 500 nM abemaciclib (LY2835219,
MedChemExpress) daily for a total of 6 days. Cell number and viability were determined using the Countess II FL Automated Cell Counter (ThermoFisher) on days 2, 4 and 6. All experiments were performed in triplicates. Cell doubling per 24 hours was determined based on cell numbers comparing cells seeded and on day 6 using the following formula: duration (in days) × log(2)/log(final cell number) – log(initial cell number).
Melanoma-TIL co-culture experiments—Melanoma cell line 2686 was pre-treated with 500 nM abemaciclib or DMSO control for 7 days followed by co-culture with
autologous TILs (with an effector to target ratio of 5:1) for 48 hours. TILs were removed by pipetting of the supernatant, and the remaining melanoma cells were washed twice with PBS, lifted off the culture dish, and resuspended in PBS supplemented with 0.04% BSA for loading for scRNA-seq with the 10X Genomics platform.
Mouse cell line culture experiments—B16F10 cells were maintained in complete DMEM media (10% FBS and 50U/mL of Penicillin- Streptomycin). MC38 and CT26 were maintained in RPMI-1640 (10% FBS and 50U/mL of Penicillin-Streptomycin). For scRNA-seq, cells were washed twice with PBS, incubated with trypsin 0.05% for 2 min at 37°C, quenched with complete media, and resuspended in PBS supplemented with 0.04% BSA prior to loading onto the Chromium 10X platform and processed as described above. All cell lines were tested for Mycoplasma.
In vivo mouse experiments—5.0 * 105 B16F10 cells were subcutaneously injected into 6 weeks old female C57BL/6 mice (The Jackson Laboratory). Four or seven days after injection, animals were treated with either (1) isotype control antibody injected
intraperitoneally (2A3 and polyclonal syrian hamster IgG, 200μg/mouse and 100μg/mouse, respectively) every 3 days for a total of 4 doses; (2) abemaciclib 90 mg/kg daily
administered by oral gavage (LY2835219, MedChemExpress) for a total of 10 doses; (3) combination immune checkpoint blockade (ICI) with αPD-1 (clone 29F.1A12, 200μg/ mouse) plus αCTLA-4 (clone 9H10, #BP0131,100μg/mouse) every 3 days for a total of 4 doses; (4) abemaciclib (90mg/kg) daily for 4 days followed by ICI every 3 days for a total of 4 doses; (5) ICI for one initial dose followed 3 days later by abemaciclib (90mg/kg) daily combined with ICI every 3 days for an additional 3 doses; or (6) upfront combination of ICI
A
uthor Man
uscr
ipt
A
uthor Man
uscr
ipt
A
uthor Man
uscr
ipt
A
uthor Man
uscr
ipt
and abemaciclib (75mg/kg) every 3 days for a total of 4 doses. CD8+ T cell depletion was achieved using CD8b mAb (clone53–5.8, #BE0223, 100μg/mouse) that was administered on day-1, day 0 once a week until the end of the experiment. Tumor size was measured using digital calipers every 3 days. Tumor volume was determined by calculating (length × width2)/2. Growth curves and survival curves were generated using GraphPad Prism v8.
QUANTIFICATION AND STATISTICAL ANALYSIS scRNA-seq cohort processing
Gene expression quantification: BAM files were converted to merged, demultiplexed
FASTQ files. The paired-end reads obtained with the SMART-Seq2 protocol were mapped to the UCSC hg19 human transcriptome using Bowtie (Langmead et al., 2009), and transcript-per-million (TPM) values were calculated with RSEM v1.2.8 in paired-end mode (Li and Dewey, 2011). The paired-end reads obtained with the 10x Genomics platform were mapped to the UCSC hg19 human transcriptome using STAR (Dobin et al., 2013), and gene counts/TPM values were obtained using the 10x Genomics computational pipeline
(cellranger-2.1.0).
For bulk RNA-Seq data, expression levels of genes were quantified as Ei,j = log2(TPMi,j+1), where TPMi,j denotes the TPM value of gene i in sample j. For scRNA-seq data, expression levels were quantified as Ei,j = log2(TPMi,j/10+1), where TPMi,j denotes the TPM value of gene i in cell j. TPM values were divided by 10 because the complexity of the single-cell libraries is estimated to be within the order of 100,000 transcripts. The 10−1 factoring prevents counting each transcript ~10 times, which would have resulted in overestimating the differences between positive and zero TPM values. The average expression of a gene i across a population of N cells, denoted here as P, was defined as
Ei, p = log2 1 +∑j ∈ PTPMi, jN
For each cell, we quantified the number of genes with at least one mapped read, and the average expression level of a curated list of housekeeping genes (Tirosh et al., 2016). We excluded all cells with either fewer than 1,700 detected genes or an average housekeeping expression (E, as defined above) below 3 (Table S2). For the remaining cells, we calculated the average expression of each gene (Ep), and excluded genes with an average expression below 4, which defined a different set of genes in different analyses depending on the subset of cells included. In cases where we analyzed different cell types together, we removed genes only if they had an average Ep below 4 in each of the different cell types that were included in the analysis. When analyzing CD45+ cells, we excluded genes as described above only after the assignment of cells to cell types in order to prevent the filtering of genes that were expressed by less abundant cell types.
Imputation and normalization: In all differential expression analyses of SMART-Seq2, we
first modeled the read counts as a mixture of a negative binomial (NB) and Poisson components to estimate the expression levels, using SCDE (Fan et al., 2016) with the code provided in https://github.com/hms-dbmi/scde. The resulting normalized and imputed
A
uthor Man
uscr
ipt
A
uthor Man
uscr
ipt
A
uthor Man
uscr
ipt
A
uthor Man
uscr
ipt
expression matrix, denoted as E’, was used in the differential expression analyses. Analysis of droplet-based scRNA-seq data (10X Genomics Chromium, above) was performed with the Seurat package (https://satijalab.org/seurat), using the likelihood-ratio test for differential gene expression analyses.
Classification of malignant and stromal cells: In the non-immune compartment (CD45−
cells), we distinguished malignant and nonmalignant cells according to three criteria: (1) their inferred CNV profiles (Tirosh et al., 2016); (2) under- expression of different nonmalignant cell type signatures; and (3) higher similarity to melanoma tumors than to adjacent normal tissue, based on the comparison to bulk RNA-Seq profiles. Specifically: (1) to infer CNVs from the scRNA-seq data we used the approach described in (Tirosh et al., 2016) as implemented in the R code provided in https://github.com/broadinstitute/inferCNV with the default parameters. Cells with an average absolute CNV level that was below the 0.1 quantile of the entire CD45− cell population were considered as potentially
nonmalignant according to this criterion. (2) We used signatures of endothelial cells, stromal cells, and CAFs, as provided in Table S3A. The signatures combine well-established markers from two sources (https://www.biolegend.com/cell_markers and (Tirosh et al., 2016)). We computed the OE of these three signatures in each of the CD45− cells, while controlling for the impact of technical cell quality (as described in section Gene sets overall expression). CD45− cells that expressed any one of these three signatures above the 0.95 quantile were considered as potentially nonmalignant according to this criterion. (3) We downloaded the pan-cancer TCGA RNA-SeqV2 expression data from https://xena.ucsc.edu/, and log2-transformed the RSEM-based gene quantifications. For each cell, we computed the correlation between its profile (in TPM) and each bulk profile (in TPM) of 473 skin
cutaneous melanoma samples and 727 normal solid tissues. We then tested, for each cell, if it was more similar to the melanoma tumors compared to the normal tissues, by applying a one-sided Wilcoxon ranksum test on the correlation coefficients that were obtained for that cell. Cells that were more similar to the normal tissues (p < 0.05, Wilcoxon ranksum test) were considered as potentially nonmalignant according to this criterion.
The cell assignments that were obtained by these three different criteria were highly consistent (Figures S1A and S1B, hypergeometric p value < 10−17). Cells that were identified as potentially nonmalignant according to one or more of these three criteria were defined as nonmalignant, and were omitted from further analyses of the malignant cells. The nonmalignant CD45− cells were further classified into CAFs and endothelial cells, if they overexpressed only one of the corresponding gene signatures, and as unresolved cells otherwise.
Classification of immune cells: To classify immune cells, we first filtered CD45+ cells that were potentially malignant or doublets of immune and malignant cells based on their inferred CNV profiles. To this end, we defined the overall CNV level of a given cell as the sum of the absolute CNV estimates across all genomic windows. For each tumor, we generated its CNV profile by averaging the CNV profiles of its malignant cells, when considering only those with the highest overall CNV level (top 10%). We then evaluated each cell by two values: (1) its overall CNV level, and (2) its CNV-R-score, that is, the
A
uthor Man
uscr
ipt
A
uthor Man
uscr
ipt
A
uthor Man
uscr
ipt
A
uthor Man
uscr
ipt
Spearman correlation coefficient obtained when comparing its CNV profile to the CNV profile of its tumor. These two values were used to classify cells as malignant, nonmalignant, and unresolved cells that were excluded from further analysis (Figures S1C-S1E).
Next, we applied two different clustering approaches to assign immune (CD45+) cells into cell types. In the first approach, we clustered the CD45+ cells according to 194 well-established markers of 22 immune cell subtypes (Table S3A; assembled from https:// www.biolegend.com/cell_markers and (Tirosh et al., 2016)). The clustering was performed in three steps: (1) we computed the Principal Components (PCs) of the scRNA-seq profiles, while restricting the analysis to the 194 biomarker genes. We used the top PCs that captured more than 50% of the cell-cell variation. In the presented analyses, 10 PCs were used, but the results were robust and stable when using the first 5–15 PCs. (2) We applied t-SNE (t-Distributed Stochastic Neighbor Embedding) (van der Maaten and Hinton, 2008) to transform these first PCs to a two- dimensional embedding, using the R implementation of the t-SNE method with the default parameters, as provided in http://lvdmaaten.github.io/ tsne/. (3) We applied a density clustering method, DBscan (Ester et al., 1996), on the two-dimensional t-SNE embedding that was obtained in (2). This process resulted in four clusters for which the top preferentially expressed genes included multiple known markers of particular cell types (Figures S1F and S1G).
To map between clusters and cell types we compared each cluster to the other clusters according to the OE of the different cell type signatures (one sided t test, Table S3A). The cell type signature that was most significantly (t test p value < 10−10) overexpressed in the cluster compared to all other clusters was used to define the cluster identity. In this manner, we annotated the clusters as CD8+ and CD4+ T cells, B cells, and macrophages (Figure 1D). Cells that clustered with the CD8+ T cells and did not express CD8A or CD8B were labeled as NK cells if they overexpressed NK markers, otherwise they were considered as
unresolved T cells. T cells that were clustered together with the CD4 T cells and expressed CD8A or CD8B were also considered as unresolved T cells. Unresolved T cells were not used in further analyses.
To assess the robustness of our assignments, we applied another approach, and determined the concordance between the two assignments. In the second approach, we first made initial cell assignments based on the OE of well-established cell type markers: T cells (CD2, CD3D, CD3E, CD3G), B cells (CD19, CD79A, CD79B, BLK), and macrophages (CD163, CD14, CSF1R).
Across all the CD45+ cells, the OE levels of these signatures had bimodal distributions. We used the bimodal OE of each signature to assign cells to cell types (see Gene sets overall expression). Cells that were assigned to more than one cell type at this point were
considered as unresolved. Cells that were defined as T cells according to this measure were further classified as CD8+ or CD4+ T cells if they expressed CD8 (CD8A or CD8B) or CD4, respectively. T cells that expressed both CD4 and CD8 were considered as unresolved. As a result, 67.3% of the cells had an initial cell type assignment.
A
uthor Man
uscr
ipt
A
uthor Man
uscr
ipt
A
uthor Man
uscr
ipt
A
uthor Man
uscr
ipt
Next, we clustered the cells with the Infomap algorithm (Rosvall and Bergstrom, 2008). Infomap decomposes an input graph into modules by deriving a compressive description of random walks on the graph. The input to the algorithm was an unweighted k-NN graph (k = 50) that we generated based on the expression of the 194 biomarker genes across the CD45+ cells. Infomap produced 22 clusters, separating the different CD45+ cells not only according to cell types but also according to various cell states. For each cluster, we examined if it was enriched with cells of a specific cell type, according to the initial assignments. Nineteen clusters were enriched with only one cell type. The cells within these clusters were assigned to the cell type of their cluster, unless their initial assignment was different, and in this case, they were considered as unresolved.
The cell type assignments that were obtained by the two approaches were highly concordant: 97% of the cells had the same assignment with both approaches.
Interactive visualization of the immune cells’ tSNE plots are provided in https:// portals.broadinstitute.org/single_cell/study/melanoma-immunotherapy-resistance.
Gene sets overall expression—Gene modules are more robust to noise and provide more coherent signals than the expression of single genes. To compute the OE of a gene module or signature we used a scheme that filters technical variation and highlights biologically meaningful patterns. The procedure is based on the notion that the measured expression of a specific gene is correlated with its true expression (signal), but also contains a technical (noise) component. The latter may be due to various stochastic processes in the capture and amplification of the gene’s transcripts, sample quality, as well as variation in sequencing depth. The signal-to-noise ratio varies, depending, among other variables, on gene transcript abundance.
We therefore computed the OE of gene signatures in a way that accounts for the variation in the signal-to-noise ratio across genes and cells. Given a gene signature and a gene
expression matrix E (as defined above), we first binned the genes into 50 expression bins according to their average expression across the cells or samples. The average expression of a gene across a set of cells within a sample is Ei,p (see: scRNA-seq cohort processing) and the average expression of a gene across a set of N tumor samples was defined as:
𝔼jEij = ∑jEij/N. Given a gene signature S that consists of K genes, with kb genes in bin b, we sample random compatible signatures for normalization. A random signature is S-compatible with signature S if it consists of overall K genes, such that in each bin (b) it has exactly kb genes. The OE of signature S in cell or sample j is then defined as:
𝔼j Eij =∑j EijN
Where S is a random S-compatible signature, and Cij is the centered expression of gene i in cell or sample j, defined as CB5= EB5− 𝔼 E#0. Because the computation is based on the centered gene expression matrix C, genes that generally have a higher expression compared to other genes will not skew or dominate the signal.
A
uthor Man
uscr
ipt
A
uthor Man
uscr
ipt
A
uthor Man
uscr
ipt
A
uthor Man
uscr
ipt
We found that 1,000 random S-compatible signatures are sufficient to yield a robust estimate of the expected value 𝔼=[# ∈ =C#0]. The distribution of the OE values was normal or a mixture of normal distributions, and, unlike the expression of a single gene, fulfilled the assumptions of the mixed effects models or hierarchal linear models that we applied to study the differential expression of gene signatures (as described in the Differentially expressed gene sets section).
In cases where the OE of a given signature has a bimodal distribution across the cell population, it can be used to naturally separate the cells into two subsets. To this end, we applied the Expectation Maximization (EM) algorithm for mixtures of normal distributions to define the two underlying normal distributions. We then assigned cells to the two subsets, depending on the distribution (high or low) that they were assigned to.
We use the term a transcriptional program (e.g., the immune resistant program) to characterize cell states which are defined by a pair of signatures, such that one (S-up) is overexpressed and the other (S-down) is underexpressed. We define the OE of such cell states as the OE of S-up minus the OE of S-down.
To compute the OE of gene signatures in bulk tumors or single cell data one can apply the R code we provide via GitHub (https://github.com/livnatje/ImmuneResistance;
ImmRes_OE.R).
Cell type signatures—To identify cell type signatures we performed pairwise comparisons between the eight cell types that we identified: malignant cells, CAFs, endothelial cells, NK cells, B cells, macrophages, and CD8+ and CD4+T cells. We
performed these comparisons via one-sided Wilcoxon ranksum-tests on the normalized data E. Genes were considered as cell type specific if they were overexpressed in a particular cell type compared to all other cell types (Wilcoxon ranksum-test p value < 10−5). For T cell types (CD8+ and CD4+) we used more permissive cutoffs, as the transcriptional differences between these cell types are more subtle. To ensure that the genes are significantly higher in the specific T cell type across all pairwise comparisons, for each T cell type we: (1) computed the least significant (maximal) p value for each gene, when comparing its expression in the T cell type (CD8+ or CD4+) to its expression in each of the other cell types, (2) used the genes with the lowest maximal p values to construct the signature (at most 50 genes with maximal p < 2*10−3). To derive a Pan-T cell signature that characterizes both CD8+ and CD4+ T cells, we used genes that were overexpressed in CD8+ and CD4+ T cells (p < 10−5) compared to all other cell types, when disregarding T cells and NK cells. To derive CD8+ T cell state signatures we: (1) classified CD8+ T cells as cytotoxic, exhausted, naive, or ‘undetermined’ based on well-established markers of these cell states (Table S3A); (2) performed pairwise comparisons between the different CD8+ T cell subsets to derive initial CD8+ T cell state signatures; (3) compared each CD8+ T cell subset to all other cell types (e.g., B cells, macrophages, etc.), and (4) filtered non-specific genes from the initial CD8+ T cell state signatures. We performed the same analysis with CD4+ T cells to derive signatures of cytotoxic, exhausted, naive, and regulatory CD4+ T cells. The
A
uthor Man
uscr
ipt
A
uthor Man
uscr
ipt
A
uthor Man
uscr
ipt
A
uthor Man
uscr
ipt
cytotoxic CD4+ T cells signature included only four genes and thus was not used in subsequent analyses.
We also identified signatures of three broader cell type categories: immune cells, lymphocytes, and stromal cells. The immune cell signature includes genes that are overexpressed by all the immune cell types compared to all other non-immune cells, and likewise for the other two cell categories. The lymphocyte signature included only five genes and thus was not used in subsequent analyses.
The lists of cell subtype specific genes, which were identified as described above, are provided in Table S3B. The implementation of these analyses is provided via GitHub (https://github.com/livnatje/ImmuneResistance/wiki/Mapping-immune-resistance-in-melanoma; see ImmRes1_denovoCellTypeSig.R), and can be applied to reproduce the cell subtype signatures and generate cell subtype signatures based on other scRNA-seq cohorts.
Linking cell states to tumor composition—We combined scseq and bulk RNA-Seq data to characterize the state of a specific cell type in tumors with a specific cellular composition (Figure 1B). The method takes as input scRNA-seq data and a cohort of bulk RNA-Seq data, both collected from tumors of the same cancer type. The implementation of the approach is provided via GitHub (https://github.com/livnatje/ImmuneResistance/wiki/ Mapping-immune-resistance-in-melanoma; ImmRes2_immuneResistanceProgram.R), and can be applied to regenerate the results reported here and facilitate new discoveries.
For clarity we describe the approach for malignant cells and T cells as applied here, although it can be applied to any pair of cell types, depending on data availability.
STEP 1. Analyses of the input scRNA-seq data: (a) assign cells to cell types (see sections: Classification of malignant and stromal cells and Classification of immune cells); and (b) define a signature of malignant cells and a signature of T cells, consisting of genes which are primarily (specifically) expressed by malignant cells or T cells, respectively (see section: Cell type
signatures).
STEP 2. Analyses of the input bulk RNA-Seq data: (a) estimate the T cell infiltration level in each tumor by computing the overall expression (OE, see section: Gene sets overall expression) of the T cell signature in each bulk sample; (b) compute the Pearson correlation coefficient between the expression of the genes in the malignant signature and the OE of the T cell signature across the bulk tumors; and (c) define the seed exclusion-up (down) signature as the top 20 malignant genes that are significantly negatively (positively) correlated in (b) (adjusted p < 0.1, using Benjamini-Hochberg correction for multiple hypotheses testing (Benjamini and Hochberg, 1995)). If confounding factors in the bulk RNA-Seq data should be controlled for, partial Pearson correlation is used in (2.b).
STEP 3. Analyses of the input scRNA-seq data of the malignant cells: (a) compute the OE of the seed exclusion signatures in each of the malignant cells; (b) compute the partial Spearman correlation coefficient between the