Publisher’s version / Version de l'éditeur:
Vous avez des questions? Nous pouvons vous aider. Pour communiquer directement avec un auteur, consultez la première page de la revue dans laquelle son article a été publié afin de trouver ses coordonnées. Si vous n’arrivez pas à les repérer, communiquez avec nous à PublicationsArchive-ArchivesPublications@nrc-cnrc.gc.ca.
Questions? Contact the NRC Publications Archive team at
PublicationsArchive-ArchivesPublications@nrc-cnrc.gc.ca. If you wish to email the authors directly, please see the first page of the publication for their contact information.
https://publications-cnrc.canada.ca/fra/droits
L’accès à ce site Web et l’utilisation de son contenu sont assujettis aux conditions présentées dans le site LISEZ CES CONDITIONS ATTENTIVEMENT AVANT D’UTILISER CE SITE WEB.
CIB 2004 Triennial Congress [Proceedings], pp. 1-12, 2004-05-01
READ THESE TERMS AND CONDITIONS CAREFULLY BEFORE USING THIS WEBSITE. https://nrc-publications.canada.ca/eng/copyright
NRC Publications Archive Record / Notice des Archives des publications du CNRC : https://nrc-publications.canada.ca/eng/view/object/?id=60ccdee3-846b-4a88-b06f-813cea31973c https://publications-cnrc.canada.ca/fra/voir/objet/?id=60ccdee3-846b-4a88-b06f-813cea31973c
NRC Publications Archive
Archives des publications du CNRC
This publication could be one of several versions: author’s original, accepted manuscript or the publisher’s version. / La version de cette publication peut être l’une des suivantes : la version prépublication de l’auteur, la version acceptée du manuscrit ou la version de l’éditeur.
Access and use of this website and the material on it are subject to the Terms and Conditions set forth at
Critical issues and opportunities for managing municipal
infrastructure: preliminary survey results of municipal infrastructure
investment planning project
Critical issues and opportunities for managing
municipal infrastructure: preliminary survey results of
municipal infrastructure investment planning project
Vanier, D.; Rahman, S.
NRCC-46866
A version of this document is published in / Une version de ce document se trouve dans :
CIB 2004 Triennial Congress, Toronto, Ontario, May 2-9, 2004, pp. 1-12
(Cover Sheet)
Critical Issues and Opportunities for Managing Municipal Infrastructure: Preliminary Survey Results of Municipal Infrastructure Investment Planning Project
Theme: CIB T6S7 Information Technology in Construction Check out the web page Author: Dana J. Vanier, Ph.D., Saidur Rahman, Ph.D.
Abstract
The three-year Municipal Infrastructure Investment Planning (MIIP) Project is focused on the investigation of decision support tools for strategic asset management. This paper is the summary of a survey on: (1) the actual and sustainable "Level of Investment" expenditures for maintenance of municipal infrastructure; (2) the extent of asset management in practice today, and (3) the state of Canada's
municipal infrastructure assets. The paper presents a detailed examination of the survey results and indicates that Canadian municipal assets, in general, are rated as "good" to "fair" and the condition of the assets tends to be skewed more to the better side of the range. The survey also found that 50% of the assets are at least 30 years old and 25% of assets are between 20 and 30 years old. Life cycle costing tools, planned preventative maintenance, decision-support tools, long range planning and commitment to asset management are identified as opportunities to assist the current situation of aging and deteriorating infrastructure. In general, municipal infrastructure managers know what they own, what it is worth and
what is their deferred maintenance. However, researchers and practitioners should develop and
standardize tools and techniques to assist asset managers to determine what is the asset condition, what
Critical Issues and Opportunities for Managing Municipal Infrastructure: Preliminary Survey Results of Municipal Infrastructure Investment Planning Project
Dana J. Vanier, Ph.D.1, Saidur Rahman, Ph.D. Abstract
The three-year Municipal Infrastructure Investment Planning (MIIP) Project is focused on the investigation of decision support tools for strategic asset management. This paper is the summary of a survey on: (1) the actual and sustainable "Level of Investment" expenditures for maintenance of municipal infrastructure; (2) the extent of asset management in practice today, and (3) the state of Canada's
municipal infrastructure assets. The paper presents a detailed examination of the survey results and indicates that Canadian municipal assets, in general, are rated as "good" to "fair" and the condition of the assets tends to be skewed more to the better side of the range. The survey also found that 50% of the assets are at least 30 years old and 25% of assets are between 20 and 30 years old. Life cycle costing tools, planned preventative maintenance, decision-support tools, long range planning and commitment to asset management are identified as opportunities to assist the current situation of aging and deteriorating infrastructure. In general, municipal infrastructure managers know what they own, what it is worth and
what is their deferred maintenance. However, researchers and practitioners should develop and
standardize tools and techniques to assist asset managers to determine what is the asset condition, what
is the remaining service life and what do they fix first.
INTRODUCTION
Municipal Infrastructure Investment Planning (MIIP) is a three-year project focused on decision support tools for strategic asset management (www.nrc.ca/irc/uir/miip). One deliverable for the project is a survey report on existing levels of maintenance within the participating organizations and within Canadian municipalities. More specifically, the survey should provide input to the recommended “Level of
Investment” for maintenance activities (NRC US 1994, 1996).
The objectives of the survey are to determine: (1) the actual and sustainable "Level of
Investment" expenditures for maintenance of municipal infrastructure; (2) the extent of asset management techniques in practice today, and (3) the state of Canada's municipal infrastructure assets. The questions for the survey were divided into six sections: what they own, what it is worth and what is the deferred
maintenance, what is the asset condition, what is the remaining service life and what do they fix first.
This paper presents a summary of the results of a survey sent to over 500 Canadian
municipalities. Included in the 67 responses are those from the federal department, municipalities and regional municipalities participating in the MIIP project.
What is Actual versus Sustainable "Level of Investment" (2% to 4%)?
Governmental agencies from across North America, including the National Association of College and University Business Officers (NACUBO 1990) and the US National Research Council (NRC US 1994, 1996) recommend that 2% to 4% of the current replacement value of assets should be expended each year for maintenance. The Civil Engineering Research Foundation (CERF 1996) validated these numbers eight years ago, confirming that many organizations spend less than recommended.
Determine the Extent of Asset Management Techniques in Practice Today?
The International Infrastructure Management Manual (IIMM 2000) describes asset management as: the combination of management, financial, economic, engineering and other practices applied to
physical assets with the objective of providing the required level of service in the most cost-effective manner. Asset management is seen, correctly or incorrectly, as a universal remedy to many of the current
municipal infrastructure problems such as deteriorating assets, high levels of deferred maintenance and aging civil infrastructure.
Asset managers face a constant challenge to allocating resources between investment in new assets and the ongoing maintenance and renewal of existing assets. Asset managers need considerable data regarding what is the expected service life of any particular asset and when maintenance is required.
1
Dana J. Vanier is a Senior Research Officer, National Research Council, Ottawa, Canada and Saidur Rahman is a NSERC Postdoctoral Fellow, National Research Council Canada, Ottawa, ON, Canada.
The challenging part of asset management is to address the concerns of the administrative, technical, financial, and political facets of an organization while providing an acceptable "level of service" to clients. What is State of Canada's Existing Municipal Infrastructure Assets?
Municipal infrastructure includes those assets managed by municipalities, and these typically include buried utilities, roads, transit systems, bridges, treatment plants, and parks. Some jurisdictions are also responsible for a variety of building types (i.e. office buildings, police stations, and community
centres), but their responsibility could also extend to other building types such as social housing and schools. Numbers are available from numerous sources as to what is the condition and age of existing civil infrastructure. The same holds true for the amount or extent of deferred maintenance:
• • • • • • • • •
Mirza and Haider (2003) estimate the "total public infrastructure debt of all governments in Canada" is $125 billion.
The Office of the Auditor General indicates that Canada's Department of National Defence's has deferred approximately $1.7 billion in maintenance on an asset base of $17 billion (OAG 1994). The Canadian Society for Civil Engineers (CSCE 2003a) tag the current municipal infrastructure maintenance debt at $57 billion in 2003 and potentially $110 billion in 25 years.
The Federation of Canadian Municipalities (FCM 1996) identify that more than $44 billion is required to bring municipal infrastructure systems to an acceptable level. Many projections as to the current amount of deferred maintenance have been made based on this seminal document. Canada's National Highway System Condition and Needs Update (NHSCNU 1997) estimates that $2.75 billion is needed to repair, upgrade and modernize its highways worth $17.4 billion. The Canadian Association of University Business Officers (CAUBO 2000) indicate that there is $3.6 billion in deferred maintenance on Canada's $37 billion university asset portfolio.
More recently, the City of Edmonton published an annual report2 on the overall status of their infrastructure using their three-category classification system (Edmonton 2002):
13% ($2.3 billion) is in poor and critical physical condition;
17% ($3.1 billion) is in poor and critical condition with respect to demand/capacity, and 8% ($1.4 billion) is in poor and critical condition with respect to functionality.
Edmonton has identified their "infrastructure gap" — the difference between the projected cost of infrastructure projects and the financing available. The 2002 report indicates that the infrastructure gap is widening and that there is insufficient funding for rehabilitation of existing infrastructure and for building new infrastructure to support growth. Currently, the City’s 10-year infrastructure gap totals $3.2 billion. Roughly 40% ($1.3 billion) of this is comprised of projects required to rehabilitate existing infrastructure.
Vanier (2000) estimates Canada has civil infrastructure valued at $5.5 trillion (in 1999 constant dollars). This includes all commercial, governmental, residential and industrial facilities. Vanier also estimates that municipal infrastructure in Canada accounts for 20% of this amount, or $1.1 trillion. As can be seen, there is little consensus on numbers related to asset management and none of these numbers address the three stated objectives of this survey.
SURVEY METHODOLOGY
In order to encourage respondent participation, to minimize the response management and to reduce distribution and reply costs, it was decided to distribute the survey and collect the responses completely electronically. Alternative methods were also made available to the users to complete the survey manually and to mail or fax their responses.
Mailing List
Although email is prevalent in most professional communities and within Canadian municipalities, it is difficult to obtain reliable email addresses for Canadian municipalities. The reasons for this statement are that individuals move within organizations; they transfer within and between different organizations; their organizations restructure; the organizations merge or splinter, and email address protocols change within organizations. Attempts were made to ensure that multiple email addresses for the same person
2 The replacement values provide a snapshot of the magnitude of reinvestment in each classification
category. These values should not, however, be added together to determine total reinvestment requirements – since investing in one may resolve issues in other categories.
were eliminated and that the survey was distributed to the person at the municipality dealing with asset management. A limited number of phone calls were made to verify information.
Survey Distribution
Once the mailing database was finalized, emails were sent out sequentially from the largest municipalities to the smallest communities. It was decided not to contact municipalities with populations of less than 5000 people as this is not a target segment for the MIIP project and because these
municipalities form a small percentage of the total Canadian population. It was also discovered that email addresses are increasingly more difficult to obtain as the size of the population of the municipality
decreases. However, all the responses received are included in the results, regardless of population size. The survey was distributed, starting in early November 2002, to 545 Canadian municipalities accompanied by a request to complete the survey before 16 December 2002. The survey was sent to every city, town, and regional or municipal district with a population over 5000 people in Canada, outside of the Province of Quebec. As compensation for completing the survey, respondents were promised a copy of the survey results and were promised anonymity in the publication of results.
Survey Data Collection
All survey responses were accepted as individual surveys regardless of the originating location; however, efforts were made to coordinate responses from different individuals (or different groups) in the same organization. In cases where multiple responses were received from the same municipality, their populations are not multiplied for the final population tally. Responses were received from 67 asset managers. Based on the 545 survey requests, 13% submitted responses.
RESULTS
This paper presents a "first pass" at analyzing the results of the survey and presents only those results related to the three objectives of the survey.
What is the Actual "Level of Investment" in Municipal Infrastructure Maintenance?
It was found that many of the respondents are unaware of the 2% to 4% governmental suggestions for "Level of Investment":
• • • •
29 respondents (44%) are not aware of recommendations;
15 respondents (23%) are vaguely familiar with these recommendations;
22 respondents (33%) are aware of the recommendations; only eight of these provided a recommended figure when queried, and
seven of these eight correctly identified 2% to 4%, the last respondent was slightly lower. Figure 1 juxtaposes the "actual" and "sustainable" responses for the respondents' "Level of Investment". An interesting observation is that 14 respondents (21%) are unable to identify their actual "Level of Investment": either they do not know their budget or the current value of their assets, or both.
0% 10% 20% 30% <0.5% <1.0 % <1.5% <2.0 % <2.5% <3.0 % <4.0% >4.0% No Resp onse Unk now n Resp o n se Percen tag
e Actual Level of Investment
Desired Level of Investment
Figure 2 illustrates funding shortfall ratios. The X-axis values are calculated by dividing each respondent's desired funding by their “actual” funding. For example, “quadruple” in Figure 2 means that the respondent identified desired funding is four times higher than they currently receive. The high number of "No Response" is attributed to respondents who did not enter an "actual" and/or "sustainable" amount. Figure 2 displays these results by number of responses and by the stated value of their assets.
0% 5% 10% 15% 20% 25% 30% 35% Quadr uple Dou ble 50% increa se Little Mor e Same Little Less Half t he amo unt No Resp onse Response Pecentage By Response By Asset Value
FIGURE 2: Funding Shortfall Ratios (Sustainable Funding/Actual Funding) What is the Status of Asset Management in Canada Today?
One question in each of the six parts of the survey (the six whats) permitted the respondent to rate the confidence level of their answers. A correlation amongst the answers to these questions in the survey is observed. To create a single "Confidence Level" for the discrete responses, weighting values are assigned linearly between 4 for "Very Confident" and 1 for "Not Confident" and summed for all responses and averaged for the group. A variance envelope of +/- 20% is also calculated and displayed in Figure 3 to symbolize the variation in the respondents' answers if they had provided a 20% higher or lower value than originally selected.
Very Confident (4) Confident (3) Somewhat Confident (2) Not Confident (1) 1.00 1.50 2.00 2.50 3.00 3.50 4.00 Muni cipal statis tics What do y ou o wn? Wha t is i t worth? What is defer red? What i s condition? What i s remaini ng l ife?
Confidence Level -- - -- - -- - 20% Variance
Figure 3 also indicates that the participating municipalities are more confident about their knowledge about what they own than what is the remaining service life of assets.
A number of questions in the survey deal with what do you own and with the availability and number of computerized maintenance management systems (CMMS) in the organization. In total, 14 respondents (21%) do not use CMMS; 30% have a number of CMMS implementations in their organizations and two organizations have more than 5 CMMSs.
Even fewer numbers of respondents could answer questions related to what it is worth? A total of 28% indicated that they do not have a system to record these data; 30% indicate they save the historical value of the asset, and an additional 58% record the current replacement value. When asked: "what is the total value of the portfolio under their supervision"; 17% of respondents are not able to provide this figure. A number of questions related to: What is deferred? Deferred maintenance is defined as the cost of maintenance (and not capital renewal) to bring the asset to its original potential that has been
postponed or phased for future action. A total of 28 respondents (42%) are not familiar with Facility Condition Index (FCI); a term that has been used by government agencies for the past 15 years and represents the amount of deferred maintenance for an asset in proportion to asset's current replacement value. A total of 21 respondents (31%) are unable to provide this number when provided with a limited number of responses including: <$100,000, < $500,000, … , <$8 Million, >$8 Million. The total of 30 respondents (45%) do not have a system in place and the remainder of respondents utilize either CMMS (7), corporate databases (5), spreadsheets (12), manual systems (5), or other recording methods (7) such as pavement management systems (4) to record their deferred maintenance.
Two questions in the survey related to: What is the condition? "Besides … FCI … do you have an objective, repeatable method in use today to establish the current performance level". A total of 24 respondents (36%) indicate that they do not have a system, whereas 27 respondents (40%) indicate that they utilized more than one system. The second question attempts to classify the type of system used to determine asset condition or performance: "primary methods for evaluating your assets' performance". "Visual inspections" (43) and "operator evaluations" (29) are utilized by respondents in the study group. An additional 24 respondents use "technical audits" and 32 respondents use "condition objective criteria".
Three questions related to what is remaining service life? The first asks about the "primary criteria for evaluation your assets' remaining service life". The primary criteria identified are "age based" and "expert's knowledge" with 43 and 31 responses, respectively. Other significant criteria include non-destructive testing (12) and service life tables (11). The second and third question ask about the respondents' knowledge of national and international standards in the domain of service life prediction. The identified standards include ISO (International Organization for Standardization), ASTM (American Society for Testing and Materials), CIB (International Council for Research and Innovation in Building and Construction), CSA (Canadian Standards Association) and HAPM (Housing Association Property Mutual). A total of 35 respondents (52%) are not aware of these standards and an additional 13 (19%) are vaguely aware of standards in the field. Only one individual indicated participation on related standards activities and that individual is a consultant working in the asset management field.
Documentation of What do you fix first was performed by asking the respondents to describe their "primary criteria for evaluating your maintenance priorities". The respondents are asked to rank the 11 options (Regulatory, Budgetary, Safety, Health, etc.) in order of priority. Priority weights of 1 to 11 are assigned to each of the options and the results are presented as Tables 1 and 2. The ranking based on the sum of all the weights is shown on the first rows of Tables 1 and 2. The second rows of Tables 1 and 2 present the rankings if only the five choices from each respondent are summed. The rankings of the top five options (Table 1) are not affected by either calculation, but there are minor reversals of order in the other six (6) options, as shown in the second row of Table 2.
Table 1: What do you Fix First: Highest Ranking Options
Safety Condition Budgetary Regulatory Health
All Rankings 1 2 3 4 5
Table 2: What do you Fix First: Lower Ranking Options
Age Expert Knowledge Environment Weighted Criteria Political / Administrative Subjective All Rankings 6 7 8 9 10 11 Only Top 5 7 9 6 8 10 11What is the State of Canada's Existing Municipal Infrastructure Assets?
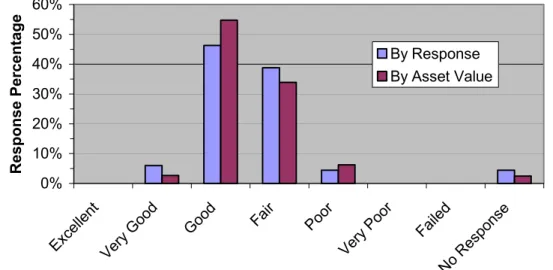
A number of questions in the survey relate to the state of Canada's infrastructure. One question asks for a quick "general perception of the physical condition of your infrastructure portfolio?". Figure 4 compares the responses from the study group “by response” to the responses “by asset value” (pro-rated to the asset value provided by each respondent).
0% 10% 20% 30% 40% 50% 60% Excel lent Very G ood Goo d Fair Poor Very Poor Failed No Re spo nse Response Percentage By Response By Asset Value
FIGURE 4: General Perception of Infrastructure Condition
The second question related to asset condition sub-classifies the percentage of infrastructure in the condition states of excellent, very good, good, fair, poor, very poor and failed. Figure 5 presents these condition states “by response” as well as pro-rated “by asset value”.
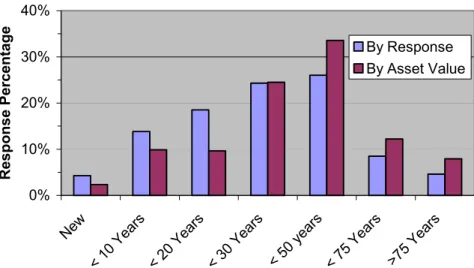
The last question in this series asks for the percentage of the respondents' infrastructure portfolio in the age classes listed in Figure 6. This figure presents the responses from the study group “by
response” as well as pro-rated “by asset value”.
0% 10% 20% 30% 40% Excell ent Very Good Good Fair Po or Very Poo r Faile d No R espo nse Response Percentage By Response By Asset Value
0% 10% 20% 30% 40% New < 10 Ye ars < 20 Year s < 30 Yea rs < 50 year s < 75 Year s >75 Ye ars Response Percentage By Response By Asset Value
FIGURE 6: Portfolio Age Classes
One general question about infrastructure attempts to identify "what factors contributed to the increase of your deferred maintenance" by soliciting respondents to select multiple choices from a list of 11 factors (and space for additional comments):
• • • • • • • • • • •
aging of assets (45 responses); increased number of assets (41); political inaction (22);
expanded need for facilities (17), and inflation (15).
The respondents were also asked to select from the list of the 15 options which "opportunities can improve your current situation":
adequate funding for maintenance (51); life cycle costing methods (50);
planned preventative maintenance (46); strategic decision support tools (46), long range planning (40), and
political/administrative commitment to asset management (39). DISCUSSION
Actual "Level of Investment"
The answers related to this question indicate that approximately half (44%) of the sample group are not familiar with recommended maintenance levels of 2% to 4% of current replacement value. This is surprisingly high as many of these reports (NACUBO 1990; NRC US 1994, 1996; CERF 1996) were published over 15 years ago. However, it is difficult to calculate the "Level of Investment" as it requires the organization to know both their deferred maintenance (e.g. difficult for buried utilities) and their portfolio value (few are using comprehensive methods to collect these data).
Figure 1 clearly indicates that Canadian municipalities wish to spend more on maintenance than they are currently receiving. In fact, although 77% of those surveyed (by number of responses) desire the recommended 2% to 4% "Level of Investment", 70% are spending less than 2%. Averaging the "Level of Investment" from Figure 1 is not scientifically sound, but it does indicate that the actual "Level of
Investment" is 1.7% and the desired sustainable level is 2.6% (when based on number of responses). When the "Level of Investment" is calculated based on asset values the "actual" average is 1.4% and the "sustainable" is 2.3%.
Figure 2 confirms that in some instances (10%) the respondents require funds at least four times as much as they currently receive and therefore are grossly under-funded. Figure 2 clearly indicate that the majority of Canadian asset managers want at least the same, and in many instances, considerably more money for maintenance than they are currently receiving. Clearly, more maintenance funds are required to cover this discrepancy; however, the respondents provide other examples of opportunities to
meet this challenge including life cycle costing tools, planned preventative maintenance, decision-support tools, long range planning and commitment to asset management techniques.
The high number "No Responses" reflects those individual who did not indicate (or know): (1) their asset value, (2) their actual "Level of Investment", or (3) a sustainable "Level of Investment". In fact, comparing the "By Response" to the "By Asset Value" results in Figure 10 for the "No Response"
indicates that many smaller municipalities (i.e. are not able to supply these data). Status of Asset Management in Canada
Figure 3 illustrates the respondents' confidence levels about their knowledge of asset
management. Clearly, the participants' confidence about the first 3 items drops off quickly, whereas their levels of confidence for the last three items remain both constant and lower than the first three.
Although most municipalities save inventory data and the majority do (77%) have CMMS to record asset data, 19 municipalities (33% of the municipal responses) do not have a system to record asset value However, only 17% of respondents are not able to estimate the value of their assets.
Determination of the amount of deferred maintenance is another issue: half of the respondents are not familiar with the term FCI; 21 respondents are not able to identify the extent of their deferred maintenance, and 18 (27%) can not identify what percentage is deemed "urgent". It could be said that approximately one-third of the respondents is not able to itemize the extent of their deferred maintenance.
Condition-based assessment is used by approximately half of the Canadian municipalities. Although 36% of respondents do not have a system to record what is the condition of their assets, many use technical audits (24 responses) and objective condition criteria (43 responses). On the negative side, roughly the same number relies on subjective criteria such as visual inspection (43 responses) and operator evaluations (29 responses).
The answers to questions about calculating the remaining service life indicate that many decisions are made on subjective criteria such as age or expert opinion. In addition, a total of 35 respondents (52%) are unaware of any type of standards work in this domain (ISO, CSA, etc.). Tables 1 and 2 in this paper indicate that decisions about maintenance prioritization are based on concerns regarding safety, condition, budget, regulations and health, in that order. However, few respondents indicate that sophisticated techniques such as multi-objective optimization or weighting criteria are employed to assist setting these maintenance priorities.
State of Canada's Existing Municipal Infrastructure Assets
It must be kept in mind that this survey received data from a wide selection of respondents and a wide selection of asset managers. In most cases, senior staff members of the municipality forwarded the responses but these individuals may be answering the survey regarding only one technical discipline (i.e. water/wastewater, roads) or they may be attempting to represent a general flavour of the state of their entire infrastructure. As a result, the results presented in this paper should be evaluated accordingly.
The condition data presented in Figures 4 and 5 illustrates that the majority of Canadian municipal assets are in "good" to "fair" condition and that the condition of the assets is skewed more to the better side of the range. Regarding asset age, over 50% of the assets are at least 30 years old. However, an additional 25% of the assets are between 20 and 30 years old: in 10 years (without renewal) these will bring the proportion of +30 year assets to a significant 75%. The main contributors to the current situation include age of assets, political inaction, expanded need for facilities, and inflation. Any asset portfolio includes a full distribution of different asset conditions or asset ages. Not every asset in every portfolio can be in excellent condition, be performing optimally, or be brand new because infrastructure budgets are limited, assets deteriorate, and systems fail prematurely. Figures 4, 5 and 6 provide a view of this distribution for the condition/age of assets in Canada. Using the weighting criteria described earlier (excellent =1 and failed = 7) then the average condition of Canadian assets is estimated as 2.9 or good. This rating should be used cautiously because it is only a slice of the current situation and may be a reflection of a decreasing trend because of the aging infrastructure.
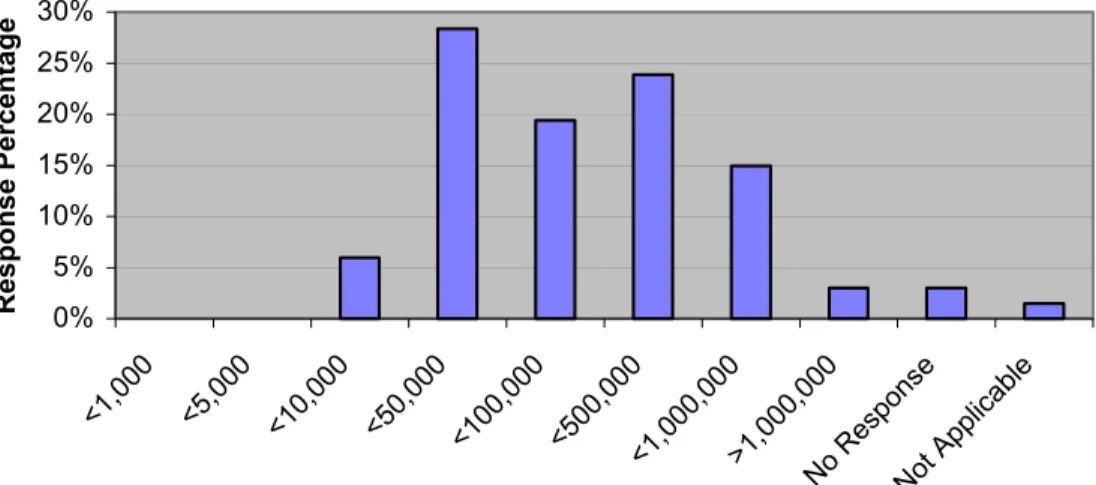
Figure 7 illustrates the population breakdown from the survey. If the populations of all the participating municipalities are summed, the survey represents a population base of 10.3 million
Canadians (Scott's 2003). These classes were selected to provide good representation in each class and to emulate existing municipal classes in Canada (village: small large, town: small medium large, city: small medium large, megacity).
0% 5% 10% 15% 20% 25% 30% <1,000 <5,00 0 <10,0 00 <50,000 <100 ,000 <500 ,000 <1,0 00,000 >1,000 ,000 No Res pon se Not Appl icab le Response Percent a ge
FIGURE 7: Population Size Distribution for Survey Respondents
The number of municipalities in Canada is displayed in Figure 8 for the nine population size classes (Scott's 2003). 1016 760 1133 270 278 66 50 10 3 1 10 100 1000 10000 <50 0 <1,0 00 <5,0 00 <10,00 0 <50,0 00 <10 0,000 <50 0,000 <1,00 0,000 >1,00 0,00 0 Numbe r of V illa ge s /Tow n/Citie s
FIGURE 8: Municipality Population Size Classes in Canada
0% 10% 20% 30% <500 <1,000 <5,000 <10 ,000 <50 ,000 <100 ,000 <500 ,000 <1,00 0,00 0 >1,00 0,00 0 Percentage of Population
Alternatively, Figure 9 shows the percentage of Canada’s population in these nine population classes. As can be seen in Figure 9, Canada is truly an urban society with over 90% of its population living in towns or cities larger than 5,000 and over 50% of the population living in cities (63) greater than 100,000. On the other hand, Figure 8 shows that we have over 3,500 municipal, county or regional organizations managing infrastructure assets in Canada.
In general, municipal infrastructure managers should know more about asset management and should be able to provide reliable answers to the first three "whats": what do you own, what it is worth and
what is the deferred maintenance. Efforts should be made at a national level to ensure that municipalities
can benchmark themselves against national norms. Regarding the last three "whats", researchers and practitioners should develop and standardize tools and techniques to determine asset condition, to predict remaining service life and to prioritize both maintenance management and capital renewal.
Many organizations ask: "what is the state of Canadian municipal infrastructure?" or "What is the Gap". In fact they are asking, how much addition money is required to bring the existing infrastructure to an acceptable state? Further investigation of the numbers provided above show that the CAUBO (2000) calculates the deferred maintenance in Canadian universities as approximately 10%. The Auditor General's report (OAG 1994) on the Department of National Defence's infrastructure base of $17 billion has deferred maintenance totaling $1.7 billion, or 10%. The Canadian National Highway System estimates (NHSCNU 1997) that the required resources to repair, upgrade and modernize the national highway system are approximately $2.75 billion on an asset base of $17.4 billion, or 15.8% (modernize means to bring many roads up to newer standards). Edmonton (2002) indicates that 8% to 13% of their infrastructure base is in need of repair, replacement or upgrading. However, the amount of deferred infrastructure maintenance by municipalities is estimated to be between $57 billion (CSCE 2003a) and $125 billion (Mirza and Haider 2003). The authors of this paper feel that these numbers are in the lower end of the potential range: a number of other major asset owners in Canada are estimating deferred maintenance between 10% and 15.8% and the value of municipal assets is estimated as $1.1 trillion (Vanier 2000). The important issue is not the amount of deferred maintenance, but rather is this amount sustainable within a specific jurisdiction? Surely, the higher "Levels of Investment" desired by the majority of respondents is indicative of a requirement for increased funding for maintenance.
CONCLUSIONS
All sizes of Canadian municipalities are well represented in this survey. In terms of unsolicited surveys, the response percentage (67 out of 545 cities polled) is viewed as extremely good.
The survey found that many Canadian asset managers are not aware of the suggested levels of maintenance expenditures from government agencies. The survey also found that the actual "Level of Investment" in Canadian municipalities falls short of their desired sustainable "Levels of Investment".
Asset management in Canadian municipalities is maturing: three-quarters of respondents have systems in place to record their asset inventory; over half record and save asset value and approximately three-quarters maintain data on the amount of deferred maintenance. Condition-based assessment is used by approximately half of the Canadian municipalities. Although one-third of respondents do not have a system in place, the others use technical audits, objective condition criteria, visual inspections or operator evaluations. The primary criteria for determining remaining service life of assets are subjective rather than objective. The survey identifies that maintenance priorities are determined based on concerns regarding safety, condition, budget, regulations and health, in that order. However, few respondents indicate that sophisticated techniques such as multi-objective optimization or weighting criteria are employed to assist setting these maintenance priorities.
The state of Canadian municipal infrastructure can be summarized as "good" to "fair", the condition of assets tends to be skewed more to the better side of the range. The survey found that approximately 50% of the assets are at least 30 years old, and 25% of assets are between 20 and 30 years old. In 10 years (without renewal) the proportion of +30 year old assets will be a significant 75%. The identified contributors to the current situation of deteriorated assets include the age of assets, political inaction, and expanded need for facilities and inflation. Life cycle costing tools, planned preventative maintenance, decision-support tools, long range planning and commitment to asset management are identified as opportunities to assist the current situation.
In general, municipal infrastructure managers know what they own, what it is worth and what is
their deferred maintenance. However, researchers and practitioners should develop and standardize tools
they fix first. Although some numbers are available from authoritative sources regarding what is the infrastructure gap, the important issue is not deferred maintenance, but rather can the municipality
sustain both the existing deferred maintenance along with maintenance that will be deferred in the future? ACKNOWLEDGEMENTS
The authors would like to thank the MIIP Consortium for their support of this research. More specifically, we would like to thank the Cities of Calgary, Edmonton, Hamilton, Ottawa and Prince George, the Regional Municipalities of Durham, Halton and Niagara and the Department of National Defence.
The authors would also like to thank Jowen Yeo for his implementation of the electronic version of the survey and the successful distribution of the survey to the participants.
REFERENCES
CAUBO 2000. A Point of No Return: The Urgent Need for Infrastructure Renewal at Canadian
Universities. Canadian Association of University Business Officers, Ottawa, ON, Summary Report at <http://www.caubo.ca/English/Publications/pointofnoreturntable.html> (23 April 2003).
CERF 1996. Level of Investment Study: Facility and Infrastructure Maintenance and Repair. Civil Engineering Research Foundation, Washington, D.C.
CSCE 2003. Civil Infrastructure Systems: Technology Road Map. Canadian Society for Civil Engineering, Montreal, PQ, <http://www.csce.ca/TRM/> (14 July 2003).
CSCE 2003a. Critical Condition: Canada's Infrastructure at the Crossroads. Canadian Society for Civil Engineering, Montreal, <http://www.cpwa.net/Documents/TRM_Ministerial_Brief.pdf > (14 July 2003). Edmonton 2002. Infrastructure Strategy: 2002 Update. <www.edmonton.ca/infrastructure/new.html> (14
July 2003).
FCM 1996. Report on the State of Municipal Infrastructure in Canada, Available from: Federation of Canadian Municipalities and McGill University.
IIMM 2000. International Infrastructure Management Manual. Institute for Public Works Engineering Australian, <www.ipwea.org.au> (14 July 2003).
Mirza, S. and M. Haider 2003. DRAFT, The State of Infrastructure in Canada: Implications for Infrastructure Planning and Policies. McGill University, Montreal, QC, 56p,
<www.regionomics.com/infra/Draft-July03.pdf> (16 Oct, 2003).
NACUBO 1990. Managing the Facilities Portfolio. National Association of College and University Business Officers, Washington, DC, 100p.
NHSCNU 1997. National Highway System Condition and Needs Update. <www.comt.ca/reports/ sumrep.pdf> (14 July 2003).
NRC US 1994. Toward Infrastructure Improvement: An Agenda for Research, Building Research Board, National Research Council, National Academy Press, Washington, D.C.
NRC US 1996. Budgeting for Facilities Maintenance and Repair Activities. Report 131, National Research Council, National Academy Press, Washington, D.C.
OAG 1994. Office of the Auditor General of Canada Annual Report, Chapter 27, <http://www.oag-bvg.gc.ca/domino/reports.nsf/html/9427ce.html> (14 July 2003).
Scott's 2003. Scott's Directory of Canadian Municipalities. <(www.scottsinfo.com> (14 July 2003). Statistics Canada 1994. Fixed Capital Flows and Stocks. 1961-1994 Historical, Statistics Canada,
Ottawa, Canada.
Vanier D.J. 2000. Advanced asset management: tools and techniques. Innovations in Urban Infrastructure, APWA Congress (Louisville, 9/9/2000), September, pp. 39-56, <irc.nrc-cnrc.gc.ca/fulltext/nrcc44299.pdf> (14 July 2003).
Vanier D.J. and S. Rahman 2003. MIIP Report: Survey on Municipal Infrastructure Assets. National Research Council Canada, Ottawa, Internal Report, 56p.