Publisher’s version / Version de l'éditeur:
Vous avez des questions? Nous pouvons vous aider. Pour communiquer directement avec un auteur, consultez la première page de la revue dans laquelle son article a été publié afin de trouver ses coordonnées. Si vous n’arrivez Questions? Contact the NRC Publications Archive team at
PublicationsArchive-ArchivesPublications@nrc-cnrc.gc.ca. If you wish to email the authors directly, please see the first page of the publication for their contact information.
https://publications-cnrc.canada.ca/fra/droits
L’accès à ce site Web et l’utilisation de son contenu sont assujettis aux conditions présentées dans le site LISEZ CES CONDITIONS ATTENTIVEMENT AVANT D’UTILISER CE SITE WEB.
Internal Report (National Research Council of Canada. Institute for Research in Construction), 1997-02-26
READ THESE TERMS AND CONDITIONS CAREFULLY BEFORE USING THIS WEBSITE.
https://nrc-publications.canada.ca/eng/copyright
NRC Publications Archive Record / Notice des Archives des publications du CNRC :
https://nrc-publications.canada.ca/eng/view/object/?id=9c2b0fd5-16e0-4603-9769-5d4823762d6e https://publications-cnrc.canada.ca/fra/voir/objet/?id=9c2b0fd5-16e0-4603-9769-5d4823762d6e
NRC Publications Archive
Archives des publications du CNRC
For the publisher’s version, please access the DOI link below./ Pour consulter la version de l’éditeur, utilisez le lien DOI ci-dessous.
https://doi.org/10.4224/20337970
Access and use of this website and the material on it are subject to the Terms and Conditions set forth at Rehabilitation Planning of Water Distribution Networks - The Component and the System Perspective
http://irc.nrc-cnrc.gc.ca
Re ha bilit at ion Pla nning of Wat e r
Dist ribut ion N e t w ork s : T he Com pone nt
a nd t he Syst e m Pe rspe c t ive
I R C - I R - 7 3 5
K l e i n e r , Y .
Abstract
This report describes the issues of water distribution network rehabilitation from the (global) system perspective. Three areas of pipe deterioration are identified as structural integrity, hydraulic capacity and effect on water quality, and a decription of pertinent research is provided. Models and methodologies that are available to facilitate the planning of water distribution networks are described and compared. Future research needs are identified and discussed.
Acknowledgement
I wish to extend my appreciation to Dr. Balvant Rajani for his valuable advice and insightful comments. Special thanks to Gerald Franche for helping with the graphical presentation.
Table of Contents
1. Introduction...1
2. Problem Scope ...2
3. The Pipe and the Distribution Network ...4
4. Pipe Deterioration ...7
5. Pipe Breakage ...8
6. Deterioration of Pipe Hydraulic Capacity ...11
7. Water Quality in the Distribution System...13
8. Reliability of the Water Distribution System ...15
9. Decision Making – Selecting and Scheduling Rehabilitation Alternatives...21
10. Summary ...26
References List of Figures Figure 1. Major issues in the evaluation framework ...5
Figure 2. Detailed outline of the evaluation framework ...6
Figure 3. Deterioration of CHW with time ...12
List of Tables Table 1. Summary of models addressing the selection and/or scheduling of pipe rehabilitation alternatives ...25
1. Introduction
A safe, reliable and efficient water supply system is essential to any community - urban or rural. In a water supply system that includes the supply source works, treatment plant,
distribution system (water mains) and storage facilities, the most expensive component is the distribution system. In North America, the first piped water supply system was built in Boston, in 1652 (Mays, in the ASCE - Task Committee on Risk and Reliability Analysis of Water Distribution Systems, 1989). Since then, millions of kilometers of pipes have been laid, and it is not uncommon (especially in older cities) to have pipes 100 years and older still in service. The aging of water supply infrastructure systems, coupled with the continuous stress placed on these systems by operational and environmental conditions, have led to their deterioration which manifests itself in the following:
• Increased rate of pipe breakage due to deterioration in pipe structural integrity. This in turn causes increased operation and maintenance costs, increased loss of (treated) water and social costs such as loss of service, disruption of traffic, disruption of business and industrial processes, disruption of residential life and loss of landscape vegetation. In addition, special provisions (e.g. backup tanks) associated with low-reliability water distribution systems may be required.
• Decreased hydraulic capacity of pipes in the systems, which results in increased energy consumption and disrupts the quality of service to the public (Adams and Heinke, 1987). • Deterioration of water quality in the distribution system due to the condition of inner
surfaces of pipes which may result in taste, odour and aesthetic problems in the supply water and even public health problems in extreme cases.
It has been reported that the distribution system often involves 80% of the total expenditure in drinking water supply systems (Clark and Gillian, 1977). Given the reality of scarce capital resources, it is imperative that a comprehensive methodology be developed to assist planners and decision makers in finding the best (most cost-effective) rehabilitation strategy
that exploits the full extent of the useful life of the individual pipe, while addressing the issues of safety, reliability, quality and economical efficiency.
The amount of research effort dedicated to water distribution system rehabilitation and renewal has increased substantially in the last twenty years. Most of this research effort has focused on narrow aspects of pipe performance, e.g., pipe breakage modelling, water distribution system reliability, hydraulic deterioration, etc. The objective of this report is to present a comprehensive view of the problem, within which the various research topics may fit towards the ultimate goal of devising an optimal rehabilitation strategy. It is posited that the useful life of a pipe in a water distribution system is not a characteristic that is intrinsic to the individual pipe and its surroundings, but rather must be assessed in the framework of the entire system. The usefulness of a pipe is measured in the extent to which the pipe
contributes to the distribution system in achieving its objectives, and the cost associated with this contribution. Consequently, the useful life of the individual pipe should essentially be an economical outcome of an evaluation procedure, in which the condition and costs of the pipes in the system are compared to form an efficient prioratization scheme for pipe rehabilitation.
2. Problem Scope
In the present context, to optimize a system means to maximize its net benefits to society. In order to measure net benefits, one has to evaluate the benefits and costs associated with the system. The benefits of a water distribution system are vast since modern urban centers could not exist without them; thus, the fundamental need for a water distribution system has been taken for granted. Consequently, the benefits are measured by the performance and quality of service that the system provides. The performance of a water distribution system may be measured by the degree to which the following objectives are accomplished:
• The system should be economically efficient.
• The system should provide the demand for water at an acceptable residual pressure during an acceptable portion of the time. The exact specification of acceptable levels of
pressure and time (e.g., provide demand flow at a minimum 30 meters pressure head for 99% of the time) are often subject to regulations and may vary with locale.
• The system should be capable of providing emergency flows (e.g., for fire fighting) at an acceptable pressure.
• The system should have an acceptable level of reliability. • The system should provide safe drinking water.
• The system should provide water that is acceptable to the consumer in terms of aesthetics, odour and taste.
The cost of a water distribution system is comprised of all direct, indirect and social costs that are associated with:
• Capital investment in system design, installation and upgrading. • System operation – energy cost, materials, labour, monitoring, etc. • System maintenance – inspection, breakage repair, rehabilitation, etc.
Thus, a water distribution system has multiple objectives, of which all but one (economic efficiency) are either difficult to quantify (e.g., reliability, water quality and aesthetics) or difficult to evaluate in monetary terms (e.g., level of service) or both. The situation is somewhat simpler concerning the cost aspects, where direct and indirect costs can be evaluated with relative ease, and social costs can (with some effort) be assessed, albeit with less certainty.
There are various methods to handle multiple objectives and criteria which generally are non-commensurable and are expressed in different units. However, some of these techniques involve explicit (or implicit) assignment of monetary values to all objectives (e.g., linear scoring method, goal programming) which may introduce biases (e.g., trying to assign a monetary value to reliability or to water quality). On the other hand, other multi-objective evaluation techniques are suitable for only a moderate number of alternatives (e.g., surrogate worth tradeoff method, utility matrices) which makes them unsuitable for handling the vast number of rehabilitation measures and scheduling alternatives involved in a typical water distribution system. An alternative approach is to formulate the problem as a “traditional”
optimization problem in which the optimization criterion is minimum cost, while all the components that cannot be assigned monetary values are taken into consideration as
constraints. A general formulation for the full scope of the problem could then be expressed as follows:
Minimize: {capital investment + operation costs + maintenance costs + rehabilitation costs} Subject to:
• physical/hydraulic constraints (e.g., mass conservation, continuity equations, etc.) • network topology constraints (e.g., layout of water sources, streets, tanks, etc.) • supply pressure head boundaries (i.e., minimum and maximum residual pressure
head)
• minimal level of reliability constraints • minimal level of water quality constraints
• available equipment constraints (e.g., treatment plants, pumps, pipes, appurtenances, etc.) • available supply water constraints (quality, quantity, source location, etc.)
All costs and constraints are considered for the entire life of the system. (The “life of a system” is a somewhat illusive idea which is further discussed later.)
It appears at present that any attempt to handle the full scope of the problem would be overly ambitious in light of current knowledge, and computational tools available. Consequently, this report deals only with rehabilitation of pipes in a water distribution network.
3. The Pipe and the Distribution Network
Contemporary research in the area of rehabilitation and renewal of urban infrastructure systems reveals a clear trend of making decisions on the basis of system performance versus system cost. In a water distribution network, the performance of an individual pipe is often a meaningless concept because an single pipe cannot fulfill any useful function on its own. Consequently, the single pipe can be investigated, tested and analyzed for all the factors that affect its integrity, but it should ultimately not be evaluated on its own but rather in the
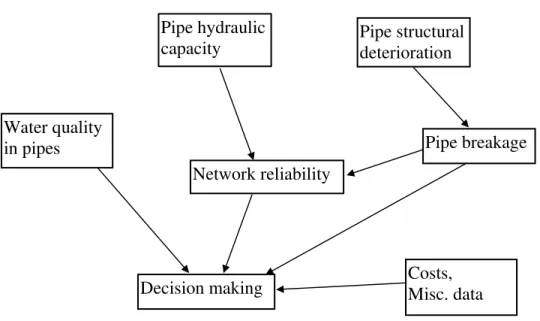
framework of the distribution network and its objectives, and the environment within which the network operates including physical and economical conditions. This framework is illustrated in Figures 1and 2. Figure 1 outlines the major issues that are encopassed in the evaluation framework, while Figure 2 presents in more detail the specific topics comprised in each issue, and the functional relationships between the various topics. The details are
subsequently discussed and a description of the pertinent research is provided. The
discussion is organized so that a section is dedicated to each of the issues outlined in Figure 1. Pipe hydraulic capacity Pipe structural deterioration Water quality
in pipes Pipe breakage
Network reliability
Decision making Costs, Misc. data
Deterioration of water quality Deterioration of hydraulic capacity Predicted future demand changes
Assessment of pipe effect on water quality
Physical environment
External corrosion (metal pipes). Physial/chemical degradation (plastic pipes) Pipe resiliency assessment Internal stress (transients) Pipe: Type Quality Installation External stress Breakage potential. Breakage frequency Data collection
and analysis Assessment of pipedeterioration rate
Mitigation: Insulation Thermal backfill Cathode protection Protective coating Predicting future network reliability Decision making
With what Replace
When Reline With what Costs: Repair Replace Reline Other scheduled infrastructure works Performance and costs of rehabilitation alternatives Ground movement Frost heave 3rd party Characteristics of supply water
Internal corrosion (metal pipes) Predicting future breakage frequency Predicted future network hydraulics Descision making Costs, Misc. data Pipe breakage Network reliability Water quality in pipes Pipe hydraulic capacity Pipe structural deterioration
4. Pipe Deterioration
The deterioration of pipes may be classified into two categories, (1) structural deterioration which diminishes the pipes structural resiliency and its ability to withstand the various types of stress imposed upon it, and (2) deterioration of pipe inner surfaces, resulting in
diminishing hydraulic capacity, degradation of water quality and even diminishing structural resiliency in cases of severe internal corrosion. Kirmeyer et al. (1994) estimated that in 1992, in the United States, more than two thirds of all existing water pipes were metallic (about 48% cast iron and 19% ductile iron), about 15% were asbestos-cement and the remaining 18% were plastic, concrete and others. In contrast, of the new pipes being installed about 48% are ductile iron, 39% PVC and 12.5% concrete pressure. Rajani and McDonald (1995), in a survey encompassing 21 Canadian cities (about 11% of the population of Canada) reveal a similar distribution of pipe material types.
The predominant deterioration mechanism on the exterior of metallic pipes is
electro-chemical corrosion (pitting and graphitization) which causes loss of wall thickness resulting in structural weakening of the pipe. The physical environment of the pipe has a significant impact on the deterioration rate. Factors that accelerate corrosion of metallic pipes are stray electrical currents, chemical and microbiological contents of the soil solution, soil electrical resistivity and the degree of soil moisture. The interior of a metal pipe may be subject to tuberculation, erosion and crevice corrosion resulting in a reduced effective inside diameter, as well as providing breeding ground for bacteria and in cases of severe internal corrosion, even structural deterioration. The supply water affects the internal corrosion in pipes through its chemical properties (e.g., pH, dissolved oxygen, free chlorine residual, alkalinity, etc.), temperature and microbiological activity (further details and references are provided in a later section discussing water quality issues in pipes).
The long-term deterioration mechanisms in PVC pipes are not as well documented mainly because they are typically slower than in metallic pipes and also because PVC pipes have been used commercially only in the last 35 - 40 years. These deterioration mechanisms may however include chemical and mechanical degradation, oxidation and biodegradation of plasticisers and solvents (Dorn et al., 1996).
Asbestos-cement and concrete pipes are subject to deterioration due to various chemical processes that either leach out the cementing material or penetrate the cement to form products that weaken the cement matrix. Presence of inorganic or organic acids, alkalis or sulphates in the soil is directly responsible for concrete corrosion. In reinforced and pre-stressed concrete, low pH values in the soil may lower the pH of the cement mortar to a point where corrosion of the pre-stressing or reinforcing wire will occur, resulting in substantial weakening of the pipe (Dorn et al., 1996).
Manufacturing practices, quality control and installation practices may also contribute to the variability in the deterioration rate of pipes. In a project that encompassed the water
distribution systems in New Haven, Connecticut and Cincinnati, Ohio, Markes et al. (1985) observe that cast iron pipes installed in different time periods, especially in the 20th century, display substantially different deterioration rates. The authors attribute this variability in deterioration rates to differences in material, manufacturing technologies and construction practices of pipelines, that were prevalent at the respective periods.
5. Pipe Breakage
Pipe breakage is likely to occur when the environmental and operational stresses act upon pipes whose structural integrity has been compromised by corrosion, degradation, inadequate installation and manufacturing defects. Pipe breakage types are classified by O’Day et al. (1986) into three categories: (1) Circumferential breaks, caused by longitudinal stress; (2) longitudinal breaks, caused by transverse stress (hoop stress); and (3) split bell, caused by transverse stress on the pipe joint1. This classification may be complemented by an additional breakage type i.e., holes due to corrosion.
1
Typical to cast iron pipes installed between the 1920s and the 1950s, with iron based lead substitutes compound for sealing the bell and spigot joints. These substitutes tend to expand in cold and wet conditions, causing many bell joints to break (O’Day et al., 1986).
Circumferential breaks due to longitudinal stress are typically the result of one or more of the following occurrences: thermal contraction (due to low temperature of the water in the pipe and the pipe surroundings) acting on a restrained pipe, bending stress (beam failure) due to soil differential movement (especially clay soils) or large voids in the bedding near the pipe (resulting from leaks), inadequate trench and bedding practices, and third party interference (e.g., accidental breaks, etc.). The contribution of internal pressure in the pipe to longitudinal stress, although small, may increase the risk of circumferential breaks when occurring
simultaneously with one or more of the other sources of stress.
Longitudinal breaks due to transverse stress are typically the result of one or more of the following factors: hoop stress due to pressure in the pipe, ring stress due to soil cover load, ring stress due to live loads caused by traffic, and increase in ring loads when penetrating frost causes the expansion of frozen moisture in the ground (Smith, 1976 ; Rajani and Zhan, 1996).
The physical mechanisms that lead to pipe breakage may be very complex and are often not completely understood. The facts that most pipes are buried and are out of sight, and that relatively little data is available about the breakage modes of pipes (due to historical unawareness of water utilities of the importance of collecting such data) also contribute to the incomplete knowledge. Extensive research has been done in modeling the physical processes leading to pipe breakage. Doleac et al. (1980) have developed a model for
predicting the remaining service life of watermains. They modeled the increase in the depth of corrosion pits in the pipe as an exponential function of time, soil pH and resistivity, and pipe surface area. They considered a pipe to have failed if its wall thikness was reduced below a threshold value that corresponded to a minimum accepted resiliency. Kumar et al. (1984) proposed the concept of corrosion status index (CSI) to characterize the condition of a pipe. To calculate CSI, the average corrosion pit in the pipe has to be estimated by either direct measurement, remote non-destructive testing (NDT) techniques (e.g., electrical polarization, sonar, ultra-sound, etc.) or using a mathematical model. Ahamed and Melchers (1995) proposed a method to analyze the probability of pipe failure during its service life due to transverse stress (hoop and bending) acting upon it. The corrosion in the pipe is assumed to uniformly reduce its wall thickness at an exponential rate and the mean and variance of all
the parameters in the model are assumed to be known. Rajani et al. (1996) proposed a simplified Winkler model to explain the response and failure of a pipe that is restrained by the surrounding soil and is subject to differential temperature change and water pressure. In this model, both longitudinal stress and transverse stress are considered.
The complexity of the physical processes that affect pipe deterioration and breakage, combined with the availability of very little pertinent data, motivated researchers to use statistical methods to explain and predict pipe breakage rates (or break frequency). Shamir and Howard (1979) applied regression analysis techniques to obtain an exponential
relationship between the breakage rate of a pipe and its age. This relationship was
subsequently used to find the timing of pipe replacement at which the total cost of repair and replacement is minimized. Walski and Pelliccia (1982) proposed a similar exponential relationship but added two other factors that account for known previous breaks in the pipe and for (observed) differences in breakage rates in larger diameter pipes. Clark et al. (1982) proposed a model that combines two equations, one to predict the time elapsed until the first break occurred and the second to predict the number of subsequent breaks which were assumed to grow exponentially over time. Marks et al. (1985) used multiple regression techniques to establish that the variables affecting pipe breakage rate were pipe diameter, length of pipe section, age, pressure, type, soil corrosivity, intensity of land development (which may be viewed as a surrogate measure for external loads on pipes), number of previous breaks, time to the second break and period of installation. Prioritizing pipe
rehabilitation considerations was subsequently discussed. Andreou et al. (1987a and 1987b) proposed “Proportional Hazards” model to predict failure probabilities of pipes in the early stages of deterioration, and a Poisson-type model for the later stages of pipe deterioration. Goulter, together with various co-authors (Goulter and Kazemi, 1988; Goulter et al. 1993) observed temporal and spatial clustering of water main failures. A non-homogeneous Poisson distribution model was proposed to predict the probability of subsequent breaks in a pipe (given that the first break already occurred). Herz (1996) has applied a cohort survival model to an entire stock of underground pipes in a distribution system. The pipes are treated as an aggregate whose service life is a random variable with a known probability density function.
The procedure forecasts the expected pipe renewal rate over the life of the water distribution system.
It appears that while the physical modeling may be scientifically more robust, it is, to date, limited by existing knowledge and available data, whereas the statistically derived models are more manageable and therefore more applicable in decision support systems (DSS). The inevitable conclusion is therefore that current usage of statistical models should be gradually enhanced by incorporating physical models as more research is done and more data becomes available.
6. Deterioration of Pipe Hydraulic Capacity
The deterioration of pipes inner surfaces result in a diminishing hydraulic capacity of the pipes. The head loss h in any pipe i may be calculated by the Hazen-Williams Equation (which is the most widely used for this purpose):
h Q C D L i i iHW i =10 653. ( )1 852. −4 87. i (1)
where Qi = flow rate in pipe i (m3/s)
CiHW = Hazen Williams hydraulic conductivity coefficient in pipe i
Di = diameter of pipe i (m)
Li = length of pipe i (m)
The diminishing hydraulic capacity of a pipe may be expressed as the deterioration of its conductivity coefficient over time. The rate of deterioration will vary according to the type of pipe, the quality of supply water and operation and maintenance practices. Colebrook and White (1937) were among the first to address the issue of pipe roughness changing over time. They found a near linear growth rate of pipe roughness with time. Hudson (1966) investigated the variations of CHW with time in seven distribution networks in the United States. Hudson’s results are presented in Figure 3.
Lamont (1981) tied the roughness growth rate to the degree of calcium carbonate saturation of the supply water. Sharp and Walski (1988) proposed a logarithmic deterioration model that was essentially based on the Colebrook and White findings, in which roughness values were converted to equivalent CHW values. It should be noted that all these models were derived for metallic pipes.
It should be remembered that the hydraulic capacity of a water distribution network depends not only on the carrying capacity of its components but also on the demand flows that the network must supply. Thus, the long-term planning of the system’s rehabilitation and renewal, requires the prediction of both the diminishing hydraulic capacity of the system and future changes in demand due to anticipated population growth, rezoning, changes in consumption habits, etc.
7. Water Quality in the Distribution System
Several researchers (e.g., LeChevallier et al., 1990 and 1993; Herson et al. ,1991; Clark et al., 1993 and 1994) have observed the phenomenon of water quality deterioration in the
distribution system. Although some of the underlying causes have been identified, no attempt has been made to model the degree of water quality deterioration as a function of system age although the pipe condition which is a function of age can have significant impacts on water quality.
LeChevallier et al. (1990) conducted research in which they found that coliforms in the distribution system originated from pipeline biofilm. They observed that coliform levels increased as the water moved from the treatment plant through the distribution system at a rate that was higher than the coliforms’ ability to naturally reproduce. This observation indicated transfer of populations from biofilm on the pipe inner surfaces to the water column.
In addition, they observed that free chlorine at 1–2 mg/L was not sufficient to eliminate or even reduce these occurrences of coliform bacteria. In some of the trunk lines, free chlorine levels as high as 4.3 mg/L did not eliminate the coliforms1. The authors noted that
continuously maintaining high chlorine residuals in the distribution system would have adverse effects on the consumer, including excessive trihalomethane (THM) formation2, taste and odour problems and increased corrosion. In comparing different disinfection agents, the authors found that monochloramine was the most effective in controlling biofilm growth on iron pipes; however, doses of 4 mg/L were required. The authors further observed that pipe internal corrosion has a distinct impact on the disinfection efficiency. It was observed that rough inner pipe surfaces protected attached bacteria from inactivation by a free chlorine residual. It was subsequently hypothesized that corrosion by-products interfere with the efficiency of biofilm disinfection. Application of corrosion inhibitors (e.g. polyphosphate, zinc orthophosphate) resulted in a substantial improvement in biofilm disinfection. In a later publication by LeChevallier et al. (1993), this phenomenon was further investigated and corroborated.
LeChevallier (1990) reported that tubercules formed on pipes’ inner surfaces (both iron and cement-lined iron with damaged lining) were composed predominantly of iron. The surface of the tubercules was covered with crevices, which provided increased surface area and protection for microorganism growth. Another factor the author lists in affecting bacterial regrowth is the hydraulics of the system. Increased flow velocities cause a greater flux of nutrients across the pipe surface, greater transport of disinfectants and greater shearing of biofilm from the pipe’s inner surface. Stagnant water in pipes cause increased microbial growth as a result of loss of disinfectant residual.
Herson et al. (1991) conducted studies that proved that coliform and indigenous noncoliform organisms are able to accumulate on the inner surfaces of pipelines. Consequently, large
1
The authors recite the well known incidents at Muncie and Seymour in which chlorine levels were boosted to 15 mg/L in some instances to control the coliforms.
2
Some THM are proven carcinogenic substances (e.g. chloroform) while others are suspected as carcinogenic substances.
differences in microbial numbers may exist between the pipe inner surfaces and the bulk water phase. The high densities of bacteria on the inner surfaces cannot be detected by standard water quality determination procedures which are based on samples taken from the bulk phase only. As hydraulic conditions change (e.g., transient pressures, increased flow velocities), these bacterial accumulations may shear off the surfaces thus increasing their concentrations in the bulk phase. These findings support the conclusions LeChevallier (1990) and LeChevallier et al. (1993) reported previously.
Clark et al. (1993) and Clark et al. (1994) report on an experiment conducted to verify mathematical models of contaminant and chlorine propagation in distribution systems. One of their findings is evidence that the chlorine demand of pipes was much higher than the chlorine decay in the bulk water phase (assuming first order decay). This led them to
conclude that the distribution system components exert chlorine demand due to the existence of biofilm on their inner surfaces. Another finding pertains to the adverse impact of
distribution storage on water quality.
8. Reliability of the Water Distribution System
The reliability of a water distribution system is a complex issue which has received
researchers attention only in the last ten years. In general, the reliability models to date can be classified into two types, (1) models that focused on the probability that one or more of the demand nodes in a network are physically connected to a source node through a path of operational pipes and, (2) models that attempt to consider both the physical connectivity and the hydraulic performance of the distribution system. One of the results of the complexity of this issue is the fact that water utilities typically invest little effort in trying to quantify the reliability of their systems. To date, only one model (Ofsted and Shamir, 1996) incorporated water quality into a reliability model, however, only the propagation of source contaminants through the distribution system was considered and not the deterioration of the water quality due to the condition of the pipes.
A discussion concerning distribution system reliability must start with a definition of failure of the system and its causes. Bouchart and Goulter (1991) define failure as the inability of the network to supply demand at minimum pressure. They observe two types of events that can contribute to failure occurrence: (a) the demand is greater than that for which the system was designed, and (b) a component (pipe, pump, valve, etc.) that leads to inadequate
hydraulic capacity. If the above definition of failure is accepted, it seems that a third
contributor to failure should be considered, namely the deterioration in the hydraulic capacity of pipes in the network. This phenomenon occurs in all pipes simultaneously and if
appropriate measures are not taken, failure (as defined above) will occur.
The following short glossary of terms (extracted from the various references cited later in this section) is useful to understand the subsequent discussion:
Reliability of a component – the probability that the component will not fail during a given
time interval.
Availability of a component – the probability that a component is in an operating condition at
time t, given that the component was as good as new at time 0. This measure is more appropriate than reliability, for
components that are repairable.
Path-set – a set of elements (pipes, pumps, valves, etc.) that connect (any) two nodes in a
network.
Minimal path-set – if a path-set Pi does not contain a sub-set Si which by itself is a path-set, Pi
is called a minimum path-set.
Cut-set – a set of elements which, if it fails, causes the system to fail regardless of the
condition of the other elements in the system.
Minimal cut-set – if a cut-set Ci does not contain a sub-set Si which by itself is a cut-set, Ci is
called a minimal cut-set.
Distribution system redundancy – a measure of the number of independent alternatives that
exist to perform a task. In a water distribution system this may be expressed in terms of the number of independent hydraulic
paths (no common nodes beside initial and final nodes) that exist between a source node and every demand node and have sufficient capacity to provide the demand flow at the required pressure.
Wagner et al. (1988a) introduced two terms: (a) “reachability of a demand node” – a demand node is reachable if it is connected (through a continuous set of pipe links) to at least one source node; (b) “connectivity” – the situation in which every demand node in the network is connected to at least one source node. After assuming a known probability of failure for each link (pipe) in the network, they define the reliability of a distribution system in terms of its reachability and connectivity. In addition, they propose an algorithm to reduced the network by a series-parallel scheme to a tree structure. The authors acknowledge that since this model relies on some simplifying assumptions (e.g., independent probabilities of pipe failure) that may not be realistic, it is best suited for preliminary analysis and screening purposes. Wagner et al. (1988b) introduced a simulation based method for evaluating system reliability. Recognizing the limitations of the analytical approach presented in their companion paper (Wagner et al., 1988a), this method is said to be capable of evaluating a much broader range of reliability measures, at the expense of greater computer resources and results that are more difficult to generalize. The authors defined three operating states for each node – normal, in which demand is fully supplied; reduced service, in which the
pressure falls below a threshold value (service head) but is still above a minimum value (and as a result demand flow is not supplied in full) and failure mode, in which the pressure falls below a specified minimum and supply is assumed shut off. Similarly, three operational states are defined for the entire system; normal, when all nodes are normal; failure, when one or more nodes are in a failure state; and reduced mode, when one or more nodes are in reduced service state but no node is in a failure state. During a simulation session, various outcomes are continuously recorded. Events such as the time duration in which each node is in any operational mode and total demand shortfall (the amount not supplied in various reduced service modes) are accounted for and relevant statistics are subsequently computed. It appears that simulation is the only way in which so much detail can be gathered without over simplification of the system and its underlying assumptions.
Cullinane et al. (1989) proposed a model in which a continuous hydraulic availability function is evaluated in a cut-set framework. The concept of a continuous availability function was suggested in contrast to previous work by others, in which failure was considered a step function (fail/no-fail). The availability at a node was modeled as an increasing function of nodal pressure (a curve similar to a cumulative normal distribution curve was used). The authors proposed two measures of reliability – cut-set reliability of a node and availability of a node. The system reliability and availability was taken as the average nodal cut-set reliability and availability, respectively. The authors then proceed to develop an optimization framework for the system based on these reliability measures. Goulter and Bouchart (1990) proposed a procedure which uses a chance constrained technique1 to combine probabilities of pipe failure and probabilities of nodal demand exceeding design values into a single reliability measure. This reliability measure is defined as the probability of no node failure which is equal to the product of the probability of no node isolation (node isolation is defined as failure of all pipes incident on a node) and the probability of no demand failure (when demand exceeds available flow).
Fujiwara and De Silva (1990), in their procedure for reliability-based optimal design of water networks, proposed a method to calculate the minimum shortfall of supply quantities during a pipe failure and then defined reliability in terms of the complement of the ratio between this shortfall and the total demand.
Bao and Mays (1990) proposed a methodology to evaluate system reliability that was based on Monte Carlo simulation. The nodal demand flows and pipe roughness were considered random variables with known probability distributions and nodal pressure heads are dependent random variables which are calculated using a network simulator (KYPIPE). Nodal reliability was defined as the probability that a given node receives sufficient flow rate at the required pressure head, which mathematically means the joint probability of flow rate
1
The chance constrained method is a technique developed by Charnes and Stedry (1966) to transform a probabilistic constraint into a deterministic constraint using an acceptable threshold value for the variable at hand, its inverse probability distribution and its variance.
and pressure head being satisfied at a given node (minimum required pressure may be taken as a random or a deterministic value). The authors provided three optional definitions for system reliability – (1) minimal nodal reliability, (2) the arithmetic mean of nodal reliability, and (3) weighted average (by nodal demand flow) of nodal reliability. Ten different
probability distributions were tested for nodal demand flows and pipe roughness although it is not clear how the parameters for these distributions were obtained. Each distribution was tested with 500 repetitions1. Nodal and system reliabilities were calculated and summed after every repetition of the simulation.
Ormsbee and Kessler (1990) suggested system redundancy as a measure of reliability. They defined two types of redundancy, topologic and hydraulic. Topologic redundancy ensures the existence of a physical path from the source to any demand node in the event of a single random component failure. Hydraulic redundancy ensures the capacity of a redundant path to provide adequate pressure at all the demand nodes for a specific load condition. The authors then proposed a procedure to design/check a network for redundancy. The topologic
redundancy procedure is based on elements from graph theory and includes transforming the system topologically to a series of “two node connected graphs” and then decomposing every two node connected graphs into two overlapping spanning trees. The hydraulic redundancy then ensures that each of these trees provide a hydraulic path to every node in the system. It should be noted that this procedure is suitable for a system with only one source node, and that only level one redundancy (failure of no more than one pipe at the time) is ensured. Quimpo and Shamsi (1991) proposed a strategy for prioritizing decisions for the maintenance of a water distribution system based on reliability considerations. They suggested a reliability measure that is calculated using the concept of node-pair reliability (the probability that a specified node – source – can communicate with another specified node – demand) which is similar to the connectivity concept of Wagner et al. (1988a). To calculate node-pair
1
The authors found that nodal and system reliabilities varied from one repetition to the next because of variabilities in the computerized random number generator. Average nodal and system reliabilities varied as well for a small number of repetitions. However, beyond 500 repetitions the average reliabilities remained constant.
reliabilities, the network is first reduced to series, parallel, mixed series-parallel and other reliability blocks. Next, either cut-sets or all path-sets have to be enumerated for every node-pair. Next, reliability is calculated as the complement of the probability of a failed cut-set or as the complement of the probability of a union failure of all path-sets. The next step in the methodology is to create a map with iso-reliability contours for the analyst to identify problem areas.
Awumah et al. (1991) adopted a concept of entropy (used in other types of networks) as a surrogate measure for system redundancy. The authors define nodal redundancy as a
mathematical function in which redundancy is maximized when all the links incident on the node carry equal flow. In addition, system redundancy is defined as the (weighted) sum of all nodal redundancies and a measure of how well the flow in the network is distributed among all the demand nodes.
Bouchart and Goulter (1991) proposed a procedure to improve the reliability of water distribution networks. In this procedure, they explicitly considered the fact that demand actually occurs along the pipes and not at the nodes, thus the number and location of
isolation valves has direct impact on the demand shortfall that results from a pipe failure. The reliability measure they proposed was defined in terms of demand shortfall due to pipe failure (the segment of pipe that is isolated during repair supplies zero demand) and to demand exceeding available flows (demand is considered a random variable).
Ostfeld and Shamir (1996) proposed a methodology to minimize the design cost of a water distribution system while maintaining an acceptable level of reliability. Reliability is defined as the system’s ability to provide the demand flow at a minimum pressure and with a
minimum quality of supply-water (multiquality water supply is assumed, deterioration of water quality in the pipes is not considered) for every node, at prescribed failure scenarios. The system redundancy is considered through identification of two backup subsystems capable of maintaining a prescribed level of service when a failure occurs. The methodology does not explicitly assign a reliability measure to the system, but rather the reliability level is determined by the constraints imposed on the system (e.g., minimum supply pressure,
maximum concentration of contaminants or maximum time of reduced service mode as defined by Wagner et al., 1988b).
It is clear that the two primary factors in the reliability of a water distribution system are pipe breakage affecting both the topological reliability (reachability and connectivity) and the hydraulic reliability (reduced service), and pipe hydraulic capacity affecting mainly the hydraulic reliability. A third factor, namely the severity of the consequences (other than hydraulic) of failure, should be considered as well although typically it may be difficult to quantify. It appears that due to the complexity of the reliability issue, the only way, to date, to consider all the elements (e.g., connectivity, reachability, availability, reduced service, etc.) is extended simulation (e.g., Wagner et al. 1988b). The shortcoming however, of an extended simulation method is its requirement for vast computing resources, especially when used in the framework of a rehabilitation DSS (decision support system) which has to
evaluate a continuously deteriorating water distribution system over a long period of time.
9. Decision Making – Selecting and Scheduling Rehabilitation Alternatives
Several models have been proposed for supporting optimal rehabilitation decisions. Shamir and Howard (1979), following their pipe break prediction model, analyze the cost of pipe replacement in terms of the present value of both break repair and capital investment. This analysis shows that a time exists at which the total cost of a single pipe is minimized. Walski and Pelliccia (1982), following their own pipe prediction model proposed a replacement timing analysis approach very similar to that of Shamir and Howard. Walski (1987) incorporated the cost of water losses through leaking pipes and the cost of broken valve replacement into the replacement timing analysis. Elstad et al. (1987) analyzed the energy costs associated with a single pipeline and proposed a model in which the decision to rehabilitate a pipe depends on its current coefficient of friction.
Woodburn et al. (1987) proposed a more comprehensive model designed to determine the minimum cost rehabilitation schedule of components in a water supply network. The model employed a nonlinear programming procedure with a hydraulic simulation program to
determine which pipes should be replaced, rehabilitated or left alone. The objective function was to minimize cost, where the cost function included the cost of rehabilitated pipes, replaced pipes, break repair in existing and rehabilitated pipes (replaced pipes were assumed to have negligible repair cost), cost of expanded pumping stations and the cost of pumping energy. The nodal residual pressure head was treated in two optional ways – one as a
constraint (minimum residual pressure head), and the other in the form of a penalty function for residual pressure heads below a pre-determined threshold value. The model of Woodburn et al. was the first attempt to optimize rehabilitation/replacement of pipes in a distribution network in a comprehensive manner, encompassing capital and maintenance cost as well as hydraulic carrying capacity of the pipes and energy costs. A major limitation of the proposed model is its “flatness” with respect to time. The model can not schedule
rehabilitation/replacement at different times during a specified time horizon, but rather the results indicate only whether a pipe segment should be rehabilitated or replaced in the present time.
Su and Mays (1988) proposed an alternative to the Woodburn et al. model in which the pipe roughness coefficient, the nodal demand and nodal residual pressure requirements are considered as random variables. The respective constraints are then expressed in a probabilistic form. A chance constrained approach is used to transform the probabilistic model into a deterministic equivalent. The deterministic model is then decomposed into a master problem which enumerates combinations of rehabilitated/replaced/intact pipes, and a subproblem which uses a nonlinear programming solver to optimize diameters within each combination. A network solver was used here as well to solve the hydraulic constraint
equations. After the subproblem is solved, the enumerated (optimized) combinations are then compared to each other, and the one with the least cost is selected. It seems that the
probabilistic approach in this model provides some insight into the uncertainties inherent in a real-life distribution system. However, aside from the fact that this model has the same limitations as the Woodburn et al. model (namely no time dimension), explicit enumeration of all possible combinations is impractical even for systems of moderate size. Subsequently, another model was later developed (Kim and Mays, 1994), employing a process of implicit
enumeration (branch and bound) to reduce the number of combinations from which the optimal solution is to be identified.
Kim and Mays (1994) proposed a model which combines a master problem that generates possible combinations of pipes to rehabilitate, replace or leave as is. These combinations are then solved for optimal diameters as a subproblem and a network solver is used to verify conformity to hydraulic constraints. The objective function in this model is to minimize cost, comprising capital cost for rehabilitation/replacement, pipe repair cost and energy cost. All costs are taken at present value. The decision variables are integer (binary) variables assigned to each pipe to represent yes/no replacement, yes/no rehabilitation or yes/no leave as is. The solution methodology separates the general problem into a master problem and subproblems. The master problem employs an implicit enumeration technique to generate combinations of possible solutions. Every such possible solution is then sent to the
subproblem solver. The subproblem solver employs a nonlinear programming procedure to find optimal pipe diameters and pump horsepower for this condition. When the subproblem is solved, the (optimized) cost of the possible solution at hand is sent back to the master problem solver. The master problem solver then uses a branch and bound process to compare the optimized solutions, to bound the nonfeasible ones and to branch the feasible ones to generate further combinations of possible solutions. The process proceeds until no further improvement is found. The time dimension is not considered in this model.
Arulraj and Suresh (1995) introduced the concept of significance index (SI) which is an optimality criterion that can be applied both in prioritizing rehabilitation measures for pipes and designing new water distribution networks. SI is a dimensional index defined for each pipe as LQ/(CD) where L=pipe length, Q=flow in the pipe, C=Hazen Williams friction coefficient and D=pipe diameter. The authors also defined the critical pipe in a network as the pipe in which the replacement/rehabilitation would result in the maximum change
(increase) in nodal heads throughout the network. The authors found empirically that the pipe with the highest SI is the critical pipe in the network. They then outline a procedure in which critical pipes are replaced until a desired nodal head criterion is achieved. When applied to the design of new systems, SI is modified to include the cost of pipe per unit length in the
denominator. The significance index approach is appealing as a "common sense" approach, however, the following limitations should be pointed out: (a) it is not certain that the pipe with the highest SI is indeed the critical pipe; (b) it is not certain that replacing the critical pipe is the most cost-effective policy; (c) pipes can be replaced with the same diameter pipe or a different ones, in which case critical pipe status can change; (d) pipe deterioration in time is not considered; and (e) maintenance costs are not considered.
Kleiner (1996) proposed a methodology that explicitly considers the deterioration over time of both the structural integrity and the hydraulic capacity of every pipe in the water
distribution system. A pipe cost function is developed that considers an infinite time stream of costs (comprising the present value of breakage repair and rehabilitation costs) that is associated with the infinite rehabilitation cycles for every pipe and every rehabilitation alternative. A cycle duration is found such that minimizes the infinite stream of cost cycles from the first rehabilitation to eternity. As well, the time of first rehabilitation is found, such that minimizes the total cost of a (single) pipe from the present to infinity. The decision variables are (1) the type of rehabilitation alternative to implement and (2) the time of its implementation, for every pipe in the distribution network. The constraints are (1)
conservation of mass, (2) conservation of energy, and (3) minimum nodal residual supply pressure. A multistage procedure is developed based on a dynamic programming approach combined with partial and (sometimes) implicit enumeration schemes. The output of the procedure provides, for each pipe in an existing network, the rehabilitation alternative and its implementation timing, so as to minimize the cost of the rehabilitation investment and all maintenance costs over a pre-defined time horizon subject to the stated constraints. To date, network reliability and water quality deterioration are not considered in any of the
“comprehensive” rehabilitation analysis models. As well, externalities such as economies of scale and interaction with other infrastructure works (e.g., reducing cost by performing pipe replacement concurrently with road works) are not considered. The main characteristics of the various models are summarized in Table 1.
Table 1. Summary of models addressing the selection and/or scheduling of pipe rehabilitation alternatives.
Author Main Characteristics Major Short-comings Shamir and
Howard (1979)
• Exponential increase of pipe breakage rate over time (2 parameters).
• Single pipe analysis.
• Hydraulic capacity not considered. • Relining not considered.
• Energy cost not considered.
• Replaced pipe assumed not to deteriorate.
Walski and Pelliccia (1982)
• Exponential increase of pipe breakage rate over time (2 parameters + 2 correction factors for previous breaks and pipe size). • Single pipe analysis.
• Hydraulic capacity not considered. • Relining not considered.
• Energy cost not considered
• Replaced pipe assumed not to deteriorate.
Walski (1987)
• Exponential increase of pipe breakage rate over time (2 parameters).
• Costs of lost water, leak detection and repair and valve repair are considered • Single pipe analysis.
• Hydraulic capacity not considered. • Relining not considered.
• Energy cost not considered
• Replaced pipe assumed not to deteriorate.
Woodburn at al. (1987)
• non linear programming combined with a hydraulic simulation program.
• Costs of rehabilitation, replacement and breakage repair of pipes, are considered. • Costs of energy and the expansion of
pumping stations are considered.
• Hydraulic capacity is considered (either as a constraint or a penalty function)
• Time is not considered. • Deterioration is not considered. • reliability is not considered. • water quality is not considered. • Breakage of replaced pipes is not
considered.
Su and Mays (1988)
• Pipe roughness, nodal flow and pressure demand are random variables.
• A chance constrained approach is used. • Solution combinations are enumerated
and a non-linear programming solver optimizes pipe sizes and lengths for each combination.
• A hydraulic simulation program is used to check pressure constraints
• Time is not considered. • Deterioration is not considered. • reliability is not considered. • water quality is not considered. • Breakage of replaced pipes is not
considered.
• Explicit enumeration makes this model practical for only small systems.
Kim and Mays (1994)
• Solution combinations are enumerated and a non-linear programming solver optimizes pipe sizes and lengths for each combination.
• A hydraulic simulation program is used to check pressure constraints
• A branch and bound procedure is used to limit the number of enumerations.
• Time is not considered. • Deterioration is not considered. • reliability is not considered. • water quality is not considered. • Breakage of replaced pipes is not
Author Main Characteristics Major Short-comings Arulraj and
Suresh (1995)
• Significant index (SI) are used as optimality criterion.
• Time is not considered. • Deterioration is not considered. • Systematic replacement/rehabilitation of
pipes in a declining order of SI. • reliability is not considered.
• water quality is not considered.
• Pipe breakage repair cost is not considered. • It is not certain that renewal of pipe with
the highest SI is the most cost effective. • Energy cost is not considered.
Kleiner (1996)
• The cost function considers rehabilitation or replacement costs and breakage repair for replacement cycles to infinity.
• reliability is not considered. • water quality is not considered. • Energy cost is not considered. • Structural and hydraulic deterioration in
pipes is explicitly considered.
• Dynamic programming with partial and
implicit enumeration are used.
• The result is a complete schedule of pipe rehabilitation/replacement for a pre-specified time horizon.
10. Summary
An urban water distribution system is a complex and dynamic entity that comprises many components interacting both among themselves and with their physical environment. These interactions are sometimes not entirely understood and sometimes hard to quantify. Ongoing research is applied in all the aspects of the water distribution system, and as new materials, technologies and practices evolve, more research will have to conducted. It seems that as more understanding is continuously gained about specific processes in the system, the more difficult it becomes to incorporate all the specifics into an all encompassing DSS.
It should be remembered that ultimately, the distribution system’s performance is determined by the degree to which its objectives (as detailed in the Introduction) are met. The
components in a water distribution system do not cease to exist upon failure but are repairable at a cost. As such, the decision to repair or replace a pipe should be made by determining what is the least cost alternative that will facilitate adequate pipe performance.
Since the notion of a single pipe performance has little meaning outside of the network, it follows that the only way to evaluate pipe performance and residual service life is in the general context of the distribution network.
The long term planning of the rehabilitation and upgrading of a water distribution system involves the selection of an appropriate rehabilitation measure for each pipe in the network (e.g., reline the pipe, replace with the same diameter, replace with a larger diameter, etc.), and the implementation timing thereof, all the while conforming to performance criteria. The complexity of the problem lays in the fact that due to deterioration, the hydraulic capacity of the system diminishes over time and maintenance and repair costs increase over time. Any change in the hydraulic capacity of any pipe causes a redistribution of flows throughout the network. Consequently, the operational mode of any pipe in the network depends on the characteristics of all other pipes. As a result, the rehabilitation of any pipe in the network will influence the choice of pipes to be rehabilitated in the future, as well as the timing and type of future rehabilitation alternatives.
It seems that contemporary analysis tools for a decision support system (DSS) should be formulated and implemented as open ended models, to utilize existing knowledge while enabling the future incorporation of more elements as research evolves in this area. Further research is necessary in the following directions:
• In the short term select a promising model and develop it to the stage where it is suitable to be applied to a full scale distribution system. Subsequently, a “field test” should be implemented in collaboration with a water utility, preferably in the framework of an existing GIS.
• In the short to medium term research is necessary to broaden the scope of the model to include network reliability considerations. In addition, components such as breakage prediction models should be continuously improved as more data is collected and physical processes (e.g., corrosion, external loading, etc.) are better understood.
• In the medium to long term, fundamental research in modeling the deterioration of water quality in pipes as a function of the condition of pipes is required in order to incorporate water quality considerations into the decision making model.
• Water distribution pipes are but one component of a larger infrastructure system that includes also sewer pipes (sanitary and storm), and power and communication networks. Some or all of these systems typically reside under the road pavement. Interactions exist between the various systems both physical (e.g., pipe failure may cause subsequent road failure) and economical (e.g., it is cheaper to replace a pipe in conjunction with road renewal, and conversely, installing a pipe in an existing pavement will shorten the useful life of this pavement). An all-encompassing DSS should consider all infrastructure components as one system. Although we are currently a long way from such a DSS, we should remember that this is the strategic goal of all the research that is pursued in the area of rehabilitation of infrastructure systems.
References
Adams, B. J., and G.W Heinke, Canada's Urban Infrastructure: Rehabilitation Needs and Approaches, Canadian Journal of Civil Eng., Vol. 14, No. 5, pp. 700-707, 1987.
ASCE - Task Committee on Risk and Reliability Analysis of Water Distribution Systems (Larry W. Mays - Editor) Reliability Analysis of Water Distribution Systems, Chapter 13 by Lansey, K. E., Mays, L. W., Woodburn, J. & Wunderlich, W. O., Methods to Analyze Replacement - Rehabilitation of Water
Distribution System Components, ASCE, 1989, New York, N.Y.
Andreou, S. A., D. H. Marks, and R. M. Clark, A New Methodology for Modelling Break Failure Patterns
in Deteriorating Water Distribution Systems: Theory, Advance in Water Resources, Vol. 10, pp. 2-10, Mar., 1987.
Andreou, S. A., D. H. Marks, and R. M. Clark, A New Methodology for Modelling Break Failure Patterns
in Deteriorating Water Distribution Systems: Applications, Advance in Water Resources, Vol. 10, pp. 2-10, Mar., 1987.
Arulraj, G. P., and H.R. Suresh Concept of Significance Index for Maintenance and Design of Pipe
Networks, Journal of Hydraulic Engineering, ASCE, Vol. 121 No. 11, pp. 833-837,Nov., 1955. Awumah, K., I. Goulter, and K. Bhatt, Entropy-Based Redundancy Measures in Water-Distribution
Networks, Journal of Hydraulic Engineering, ASCE, Vol. 117, No. 5, pp. 595-614, May, 1991.
Bao, Y., and L.W. Mays, Model for Water Distribution System Reliability, Journal of Hydraulic Engineering , ASCE, Vol. 116, No. 9, pp. 1119-1136, Sept., 1990.
Bouchart, F., and I. Goulter, Reliability Improvement in Design of Water Distribution Networks
Recognizing Valve Location, Water Resources Research, Vol. 27, No. 12, pp. 3029-3040, Dec., 1991.
Clark, R. M., and J. I. Gillian, Cost of Water Supply and Water Utility Management, (Volume II), EPA-15-77-015b, MERL, USEPA, Cincinnati, Ohio, 1977.
Clark, R. M., C. L. Stafford, and J. A. Goodrich, Water Distribution Systems: A Spatial and Cost
Evaluation, Journal of Water Resources Planning and Management Division, ASCE, Vol. 108, No. WR3, pp. 243-256, Oct. 1982.
Clark, R. M., W. M. Grayman, R. M. Males, and A. F. Hess, Modeling Contaminant Propagation in
Drinking-Water Distribution, Systems Journal of Environmental Engineering, ASCE, Vol. 119, No. 2, pp. 349-364, March/April 1993.
Clark, R. M., W. M. Grayman, J. A. Goodrich, R. A. Deininger, and K. Skov, Measuring and Modeling
Chlorine Propagation in Water Distribution Systems, Journal of Water Resources Planning and
Management, ASCE, Vol. 120, No. 6, pp. 871-879, Nov./Dec. 1994.
Colebrook, C. F,. and C. M. White, The Reduction of Carrying Capacity of Pipes With Age, Journal Inst. Civil Engrs., London, 10:99 1937.
Cullinane, J. M., A. M. Lansey, and C. Basnet, Water Distribution System Design Considering Component
Failure During Static Conditions, Proceedings of the National Conference of Hydraulic Engineering, ASCE, Edited by M. A. Ports, pp. 762-767, 1989.
Doleac, M. L., S. L. Lackey, and G. Bratton, Prediction of Time-to-Failure for Buried Cast Iron Pipes, AWWA Annual Conference Proceedings, Atlanta, GA., June, 1980.
Dorn, R., P. Houseman, R. A. Hyde, and M. G. Jarvis Water mains: guidance on assessment and inspection
techniques, Construction Industry Research and Information Association, Report 162, London, UK, 1996.
Elstad, J. C., P. H. Byer, and B. J. Adams, Optimal Timing of the Restoration of Watermain Carrying
Capacity, Proceedings of the CSCE Centennial Conference pp. 60-70, Montreal, P.Q., 1987.
Fujiwara, O., and A. U. De Silva, Algorithm for Reliability Based Optimal Design of Water Networks, Journal of Environmental Engineering, ASCE, Vol. 116, No. 3, pp. 575-587, May/Jun. 1990.
Goulter, I. C., And F. Bouchart, Reliability Constrained Pipe Network Model, Journal of Hydraulic Engineering, ASCE, Vol. 116, No. 2, pp. 211-227, Feb., 1990.
Goulter, I. C., and A. Kazemi, Spatial and Temporal Groupings of Water Main Pipe Breakage in
Winnipeg, Canadian Journal of Civil Eng., 15(1), pp. 91-97, 1988.
Goulter, I. C., J. Davidson J. and P. Jacobs, Predicting Water-Main Breakage Rate, Journal of Water Resources Planning and Management, ASCE, Vol. 119, No. 4, pp. 419-436, Jul./Aug., 1993. Herson, D. S., D. R. Marshall, K. H. Baker, and H. T. Victorin, Association of Microorganisms with
Surfaces in Distribution Systems, Journal of AWWA, Vol. 83,
Herz, R. K., Aging Process and Rehabilitation Needs of Drinking Water Distribution Networks, Journal Water SRT – Aqua, Vol. 45, No. 5, pp. 221-231, 1996.
Hudson, W. D., Studies of Distribution System Capacity In Seven Cities, Journal of AWWA, Vol 58, No. 2, pp. 157, Feb., 1966.
Kim, J. H., and L. W. Mays, Optimal Rehabilitation Model for Water-Distribution Systems, Journal of Water Resources Planning and Management, ASCE, Vol. 120 No. 5, pp. 674-692, Sept./Oct. 1994. Kirmeyer, Gregory J., W. Richards and C. D. Smith An assessment of Water Distribution Systems and
Associated Research Needs, AWWARF, Denver, CO, 1994.
Kleiner, Y. Water Distribution Network Rehabilitation: Selection and Scheduling of Pipe Rehabilitation
Alternatives, Ph.D. Thesis, Department of Civil Engineering, University of Toronto, Toronto, 1996.
Kumar, A., E. Meronkly, and E. Segan, Development of Concepts for Corrosion assessment and Evaluation
of Underground Pipelines, US Army Corps of Engineers, Construction Engineering Research Laboratory, Champaign Illinois, 1984.
Lamont, P. A., Common Pipe Flow Formulas Compared With the Theory of Roughness, Journal of AWWA, Vol. 73, No. 5, pp. 274, May, 1981.
LeChevallier, M. W., C. D. Lowry, and R. G. Lee, Disinfecting Biofilms in a Model Distribution System, Journal of AWWA, Vol. 82, No. 7, pp. 87-99, Jul., 1990.
LeChevallier, M. W., Coliform Regrowth in Drinking Water: A Review, Journal of AWWA, Vol. 82, No. 11, pp. 74-86, Nov., 1990.
LeChevallier, M. W., C. D. Lowry, R. G. Lee, and D. L. Gibbon, Examining the Relationship Between Iron
Corrosion and the Disinfection of Biofilm Bacteria, Journal of AWWA, Vol. 85, No. 7, pp. 111-123, Jul., 1993.
Marks H. D., et al., Predicting Urban Water Distribution Maintenance Strategies: A Case Study of New
Haven Connecticut, Environmental Protection Agency (Cooperative Agreement R810558-01-0) M.I.T Office of Sponsored Projects No. 94211, Jan., 1985.
O'Day, D. K., R. Weiss, S. Chiavari, and D. Blair, Water Main Evaluation for Rehabilitation/Replacement, Prepared for AWWA Research Foundation, Denver CO., and USEPA, Cincinnati, OH., 1986
Ormsbee, L., and A. Kessler, Optimal upgrading of Hydraulic-Network Reliability, Journal of Water Resources Planning and Management, ASCE, Vol. 116, No. 6, pp. 784-802, Nov./Dec., 1990. Ostfeld, A., and U. Shamir Design of Optimal Reliable Multiquality Water-Supply Systems, Journal of
Quimpo, R. G., and U. M. Shamsi, Reliability Based Distribution System Maintenance, Journal of Water Resources Planning and Management, ASCE, Vol. 117, No. 3, pp. 321-339, May/Jun., 1991.
Rajani, B. and S. McDonald Water Mains Break Data on Different Pipe Materials for 1992 and 1993, Report No. A-7019.1, National Research Council of Canada, Ottawa, 1995.
Rajani, B., C. Zhan, and S. Kuraoka Pipe-soil Interaction Analysis of Jointed Water Mains, Canadian Geotechnical Journal, Vol. 33, No. 3, June, 1996.
Rajani, B., and C. Zhan, On the Estimation of Frost Loads, Canadian Geotechnical Journal, Vol. 33, No. 4, August, pp. 629-641 1996.
Shamir U., and C.D.D. Howard, An Analytic Approach to Scheduling Pipe Replacement, Journal of AWWA, Vol. 71, No. 5, pp. 248-258, May, 1979.
Sharp, W. W., and T. M. Walski, Predicting Internal Roughness in Water Mains, Journal of AWWA, Vol. 80, No. 11, pp. 34-40, Nov., 1988.
Smith, W. H. Evaluation of Frost Loadings on Underground Pipe, presented at the 1976 Annual Conference of AWWA Ontario Section, Sudburry, Ontario, 1976
Su Y.C., and L. W. Mays, New Methodology for Determining the Optimal Rehabilitation and
Replacement of Water Distribution System Components, Hydraulic Engineering - Proceedings of the 1988 ASCE National Conference, Edited by S. R. Abt & J. Gessler, pp. 1149-1154, ASCE, New York, N.Y., 1988.
Wagner, J. M., U. Shamir, and D. H. Marks, Water Distribution Reliability: Analytical Methods, Journal of Water Resources Planning and Management, ASCE, Vol. 114, No. 3, pp. 253-275, May, 1988.
Wagner, J. M., U. Shamir, and D. H. Marks, Water Distribution Reliability: Simulation Methods, Journal of Water Resources Planning and Management, ASCE, Vol. 114, No. 3, pp. 276-294, May, 1988.
Walski, T. M., and A. Pelliccia, Economic Analysis of Water Main Breaks, Journal of AWWA, Vol 74, No. 3, pp. 140-147, Mar., 1982
Walski, T. M., Replacement Rules for Water Mains, Journal of AWWA, Vol 79, No. 11, pp. 33-37, Nov., 1987.
Woodburn, J., K. E. Lansey, and L. W. Mays, Model for the Optimal Rehabilitation and Replacement of
Water Distribution System Components, Proceedings, ASCE 1987 National Conference on Hydraulic Engineering, Williamsburg, Virginia, 1987.