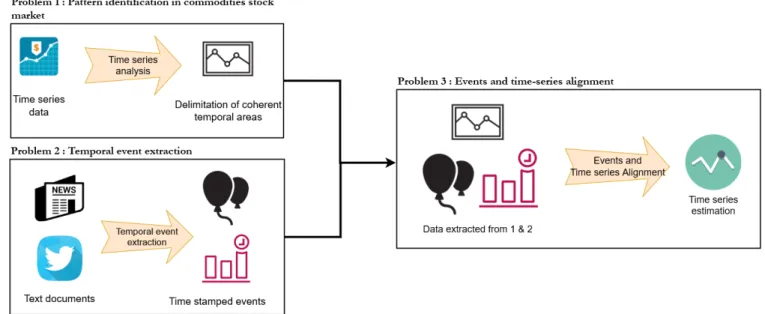
Event detection and time series alignment to improve stock market forecasting
Texte intégral
Figure
Documents relatifs
Even though the compositing period of the reflectance data used as input into CYCrhoMODlai (30 days) is twice as long as that of MODrhoMODlai (16 days) and the minimum number of
This library contains a set of C++ classes to describe and to compute the formal series involved in the description of Timed Event Graphs (series in M ax in J γ, δ K ), Weighted
We present STRIPE, a probabilistic time series forecasting method that introduces structured shape and temporal diversity based on determinantal point processes.. Diversity
This paper introduces the Shape and Time Distortion Loss (STDL), a new objective function for training deep neural networks in the context of multi-step and non-stationary time
4 Symmetry plots (SP) of two time series derived from the logistic map. b) Matrix M 00 of simple recurrences obtained from identity transformation with a non negligible number
We observe that forecasting the centroid of the known cluster for day T + 1 (omniscient method) outperforms significantly the daily mean of the whole time series.. This means that
Our experiments comparing baseline approaches and classical time series forecasting methods to our method show that this assumption is fitted by most of the time series of our
Dans cet expos´ e, on cherche ` a r´ esoudre le probl` eme de pr´ ediction aveugle, c’est ` a dire lorsque la covariance est inconnue et que l’on doit, avec un unique ´
