HAL Id: halshs-02996998
https://halshs.archives-ouvertes.fr/halshs-02996998
Submitted on 9 Nov 2020
HAL is a multi-disciplinary open access
archive for the deposit and dissemination of
sci-entific research documents, whether they are
pub-lished or not. The documents may come from
teaching and research institutions in France or
abroad, or from public or private research centers.
L’archive ouverte pluridisciplinaire HAL, est
destinée au dépôt et à la diffusion de documents
scientifiques de niveau recherche, publiés ou non,
émanant des établissements d’enseignement et de
recherche français ou étrangers, des laboratoires
publics ou privés.
Power Inequality in Inter-communal Structures: The
Simulated Impact of a Reform in the Case of the
Municipalities in Western France
Zineb Abidi, Matthieu Leprince, Vincent Merlin
To cite this version:
Zineb Abidi, Matthieu Leprince, Vincent Merlin. Power Inequality in Inter-communal Structures:
The Simulated Impact of a Reform in the Case of the Municipalities in Western France. Economie et
Prévision, Minefi - Direction de la prévision, 2020. �halshs-02996998�
Power Inequality in Inter-communal Structures: The Simulated
Impact of a Reform in the Case of the Municipalities in Western
France
Zineb Abidi∗†‡ Matthieu Leprince§ Vincent Merlin¶
Abstract. This paper deals with an important issue concerning democratic government: how delegates are to be allocated among jurisdictions in a federal system. More precisely, we analyze the effect of the 2010 inter-municipal reform in France, which changed the allocation of delegates between municipalities within their inter-communal structures. Using the theory of power indices and a unique set of data gathering 377 inter-municipal structures for three French regions, we compare the fairness of the distribution of municipal delegates prior to the 2010 reform to that of the new distribution, by simulating the impact of the 2010 reform. We show that this inter-communal reform may have increased power inequalities among municipalities belonging to the same inter-communal structure.
Keywords. Federalism, Power indices, Banzhaf index, Municipalities. Classification JEL. D7
∗ERUDITE, Universit´e Paris Est-Cr´eteil, IST-PE and TEPP (FR CNRS 3435) †EDC Paris Business School, OCRE-Lab, France.
‡Corresponding author: Zineb Abidi, 61 avenue du G´en´eral de Gaulle, Route de Choisy, Mail des m`eches 94010 Cr´eteil,
France. E-mail: zineb.abidi@u-pec.fr.
§Universit´e de Brest, Ifremer, CNRS, UMR 6308, AMURE, IUEM, F-29280, Plouzane, France. E-mail:
matthieu.leprince@univ-brest.fr.
L’in´egalit´e de pouvoir dans les structures intercommunales: l’impact
simul´e d’une r´eforme dans le cas des communes de l’ouest de la
France
R´esum´e. Cet article s’int´eresse `a une dimension importante d’un gouvernement d´emocratique : la r´epartition des d´el´egu´es ´elus entre collectivit´es dans une f´ed´eration. Plus pr´ecis´ement, nous analysons l’effet d’une r´eforme vot´ee en France en 2010 et qui a modifi´e la r´epartition des d´el´egu´es des communes au sein de leur intercommunalit´e. En mobilisant la th´eorie des indices de pouvoir et un jeu de donn´ees uniques rensei-gnant les caract´eristiques de 377 structures intercommunales dans trois r´egions fran¸caises, nous comparons l’´equit´e de la r´epartition des d´el´egu´es municipaux avant la r´eforme de 2010 et l’´equit´e apr`es cette r´eforme, en simulant ses effets. Nous montrons que la r´eforme des intercommunalit´es a dˆu accroˆıtre les in´egalit´es de pouvoir entre communes membres d’une mˆeme intercommunalit´e.
Mots cl´es. F´ed´eralisme, Indices de pouvoir, Indice de Banzhaf, Municipalit´es. Classification JEL. D7
1
Introduction
With 36,681 municipalities in 2010, France has the largest number of municipalities in Europe, as well as a highly fragmented structure of local government. This particularity of the French municipal organization was shaped after the French Revolution: Unlike many other countries, France did not sharply reduce its number of local governments over time.1 However, the country followed another route to deal with these issues: inter-communal cooperation as a local government reform. This cooperation practice has a long history in France, where the first law promoting inter-communal cooperation was established in 1890. This law enabled municipalities to form groups, called Syndicat Inter-communal `a Vocation Unique (SIVU) and Syndicat Intercommunal `a Vocation Multiple (SIVOM) in order to jointly manage some public goods and services. These were the first so-called ´Etablissements Publics de Coop´eration Inter-communale (EPCIs).
In France, since the nineteen-nineties, several important laws and reforms have been carried out in order to enhance cooperation and promote the formation of inter-communal structures. These laws and reforms aim at resolving the following issues: i) reducing the intensity of tax competition between municipalities, ii) dealing with the lack of fiscal revenues in some municipalities iii) and providing public goods more efficiently.2Nowadays, the main types of French EPCIs are Communaut´es de Communes (CC), Communaut´es
d’Agglom´eration (CA), Communaut´es Urbaines (CU) and M´etropoles.3
One of the most recent laws, the Loi no 2010-1563 de r´eforme des collectivit´es territoriales (hereafter
the 2010 law), was an achievement in the long process of the development of cooperation: It required all the municipalities to join an inter-communal structure with tax autonomy before 2014. Hence, almost all the municipalities belonged to one of the 2145 EPCIs by January 2014 and this law led to the generalization of a new tier of local government: the inter-municipal level.4Obviously, in such a situation, one of the cornerstones of democracy is the municipalities’ representation at the group level.
By law, an EPCI is governed by its own board of municipal delegates. Typically, each municipality is represented in the inter-communal structure by one or several municipal councilors. Before 2010, the law gave
1. See for example, Canada, where the number of municipalities sharply decreased between 1996 and 2001 (Poel 2000), Finland (Saarima and Tukiainen 2014), and Japan (Weese 2015).
2. In particular, small municipalities (the 20,000 entities with less than 500 inhabitants) have difficulties in financing some public goods and services; the formation of inter-communal structures allows them to pool resources and benefit from economies of scale.
3. Note that most of the inter-communal structures are Communaut´es de Communes (CC). More precisely, in 2015, there were 1884 CCs, 226 CAs, 9 CUs, and 11 M´etropoles. The situation evolved rapidly as on January 2018 there were 1009 CCs, 222 CAs, 11 CUs, and 18 M´etropoles. The differences between these forms of cooperation depend on the types of responsibilities that municipalities can transfer to the inter-municipal structures, on the size of the municipalities, and on other features.
4. Except for some municipalities which received a derogation in the ˆIle-de-France region until January 1, 2016 to consider the creation of the Grand Paris M´etropole. This Grand Paris Metropole gathers 131 communes located in 7 departments, with more than 7 millions of inhabitants. The high stakes associated with the dimensions of this metropole justified the delay of two years.
the inter-communal structures a lot of flexibility in the allocation of the EPCI assembly seats to municipal members. The only conditions were that: i) each municipality should have at least one delegate; ii) the population criterion should, in theory, be broadly applied, this condition being, however, freely interpreted in practice; and iii) no municipality could have a majority of inter-municipal delegates. It opened the door to very different institutional arrangements. In one inter-communal structure, we could apportion the number of delegates proportionally to the population, or use degressive proportionality, or even give the same number of delegates to any municipality, regardless of its population! Naturally, under these rules, negotiation played an important role in the way the inter-communal structures were formed; the delegates were allocated among the municipalities, and the power was divided between EPCI members.
Among the numerous objectives of the 2010 law, three points concerned the governance of inter-communal structures: 1) as said before, it obliged all municipalities to join an inter-communal structure by January 1, 2014; 2) it reduced the total number of delegates in each inter-communal structure as the flexibility afforded by the previous laws had led to an uncontrolled increase in the number of delegates; and 3) it proposed well-defined criteria in the allocation of delegates, based upon the Jefferson apportionment method. The municipal elections held on March 23 and 30, 2014 implemented all these reforms for the first time. The new inter-communal structure councils were installed a few weeks after these elections.
The purpose of this paper is to analyze the fairness of the apportionment of delegates among French municipalities before and after the 2010 law. All in all, the governance of these inter-communal structures of a federal type, where citizens are indirectly represented in the inter-communal structures’ council, has been widely debated in the political economy literature (see Le Breton et al. (2017)). In fact, a central issue of democracy is to identify whether each citizen is equally represented in such a federal system regardless of her municipal location.
Since the pioneering works of Penrose (1946), Shapley-Shubik (1954), and Banzhaf (1965), the theory of power indices proposes tools to measure the voting power of individuals in a collective structure. It has made numerous contributions both on the theoretical and the empirical sides.5 Regarding the French inter-communal case, Bonnet and Lepelley (2001) and Bisson et al. (2004) studied the representation of the municipalities inside inter-communal structures in the Basse-Normandie region. The authors found that the voting power of municipalities in the inter-municipal structure is often different from their population weight,
5. For theoretical contributions, one can see Straffin (1977, 1994) and Felsenthal and Machover (1998). Over the last 70 years, empirical contributions have been numerous. Most of them deal with the analysis of power in legislative assemblies. In this line, we can suggest the recent analysis of the Greek Parliament (Koki and Leonardos, 2019) or the governance structure of the Lebanese Republic (Diss and Zouache 2015, Diss and Steffen 2017). The analysis of power in the federal union is also a widespread application of the power index tools. Without being exhaustive, see Bobay (2004), Felsenthal and Machover (2001, 2004), Laruelle and Widgren (1998) in the European Union context, Leech (2002) on the governance of the International Monetary Fund, etc.
and proposed an algorithm that computes the perfect distribution of delegates to respect power indices for the Basse-Normandie inter-communal structures. More recently, Kamwa and Dia (2019) replicated these analyses in two French Overseas Departments (Martinique and Guadeloupe). Using the Banzhaf power index and an inequality measure, our objective is not, as in Bisson et al. (2004), the determination of the ”optimal” number of delegates for each municipality. Instead, our first aim is to compare the apportionment of delegates before vs. after the 2010 law, while our second purpose is to evaluate whether the new criteria implemented by this law improve the fairness of the representation among citizens in different municipalities.
Section 2 presents a brief description of the French institutional context, the rules set by the 2010 law, and our data set. Then, in Section 3, we present the power index that we used - the Banzhaf index - and its application in the two-tier voting mechanism. In Section 4, we analyze the fairness of the apportionment of delegates before and after the 2010 law. Concluding remarks and further research issues are presented in Section 5.
2
Institutional framework and data description
2.1
The French institutional context
As mentioned before, in the nineties, French laws left a lot of flexibility in the negotiations between municipalities required to join or create an EPCI, ranging from the total number of municipal delegates to their allocation. In order to limit this flexibility, the law of December 16, 2010 established new conditions for the allocation of delegates to each municipality in the inter-communal structure council, which is now determined according to two conditions.6First, to limit the number of delegates and even before allocating
them among its members, the law awards a fixed number of delegates to each inter-communal structure according to its total population (see Table 1).
6. We consulted the website of the Assembl´ee des communaut´e de France to obtain the details of the new rules. See [https: //www.adcf.org/contenu-article?num_article=488&num_thematique=7].
Table 1 –The number of delegates assigned to the inter-communal structures by the 2010 law
Population Number of Delegates Less than 3,500 inhabitants 16
Between 3,500 and 4,999 18 Between 5,000 and 9,999 22 Between 10000 and 19,999 26 Between 20,000 and 29,999 30 Between 30,000 and 39,999 34 Between 40,000 and 49,999 38 Between 50,000 and 74,999 40 Between 75,000 and 99,999 42 Between 100,000 and 149,999 48 Between 150,000 and 199,999 56 Between 200,000 and 249,999 64 Between 250,000 and 349,999 72 Between 350,000 and 499,999 80 Between 500,000 and 699,999 90 Between 700,000 and 1,000,000 100 More than 1,000,000 130
Second, the delegates must be distributed among the inter-communal structure members according to the Jefferson apportionment method:7
— Step 1): we determine the number of inhabitants each delegate should represent. For this, we derive the ratio between the total population N and the total number of delegates d as in Table 1. This fraction is known in the apportionment literature as the Divisor (D).
D= N d
— Step 2): Next, we divide each municipality’s population ni by the divisor, to obtain its quota (qi):
qi= ⌊
ni
D⌋
Since the law can only allocate whole delegates, the quota is rounded down.
— Step 3): If the total number of delegates allocated from step 2) is smaller than the number of delegates assigned to the inter-communal structure (Table 1), the remaining R (R = d − ∑ qi) delegates are
allocated one by one on the basis of the highest average rule. If municipality i already has qi delegates,
7. For more about the different apportionment methods, see Balinski and Young (2001). Note also that the 2010 law gave each EPCI the option to escape from this apportionment method provided that the alternative allocation was unanimously accepted by municipalities and that it respected some other strict conditions. See the≪ LOI n° 2015-264 du 9 mars 2015 autorisant
l’accord local de r´epartition des si`eges de conseiller communautaire ≫. However, this option was so severely regulated that it
the next delegate will be assigned to the municipality with the highest ratio:
⌊ ni
qi+ 1
⌋
At the end of the procedure, if a municipality does not obtain a delegate, one will automatically be assigned to it.8
— Step 4): Moreover, if one municipality j obtains more than half the total number of delegates, the law gives fifty percent of delegates to municipality j while the remaining delegates are distributed among the other municipalities according to the method described above.
For the rarer types of inter-communal structures, namely CUs and M´etropoles, delegates are apportioned on a strict population-proportional basis. Thus, a municipality with more than half of the total population of this type of inter-communal structures can account for more than 50% of the delegates allocated to the inter-communal structure. For this reason, we choose to analyze these types of inter-communal structures separately. Also, in CUs and M´etropoles, delegates are not elected with a winner-take-all method as in the CCs and CAs; instead, each party represented in the municipality council can send some delegates to the upper level according to a proportional rule.
2.2
Data description
The French local institutions are characterized by three tiers of local government recognized in the Consti-tution. In 2010, the lowest tier consisted of 36,681 municipalities, the middle one contained 96 counties (called departments), and the top one comprised the 22 French regions.9 In practice, the development of inter-communal structures, with the power to tax and with numerous responsibilities, created a fourth tier between the municipalities and the departments.
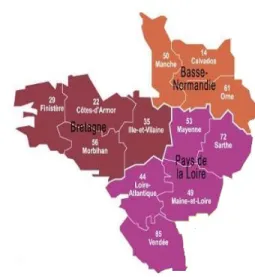
In order to analyze power inequality in these French inter-communal structures, we employ an original, extensive set of data from 377 EPCIs gathering 4526 municipalities in three French regions - Bretagne, Basse-Normandie and Pays de la Loire - comprising twelve departments (see figure 1 ). The data were centralized by the Interior and Local Government Ministry based upon the minutes of the inter-communal structure councils. They contain the number of delegates assigned to each municipality in the three regions as of
8. In this case, the law admits that an inter-communal structure can have a number of delegates higher than the number it must have according to the figures displayed in Table 1. See an example in Table 2.
9. In 2014, the French parliament passed a law reducing the number of metropolitan regions from 22 to 13 effective on January 1, 2016. Also, recently, changes to French law have facilitated the possibility of mergers among municipalities, and their number in France has slowly decreased since 2010, to 32,287 by 2017.
January 1, 2010.10 To analyze the possible consequences of the 2010 law, we derived the new allocation of
delegates by applying the Jefferson method suggested by the 2010 law and the constraints of Table 1 to the 2010 population data.
Figure 1 –Regions and departments in our data set
To give an example, Table 2 presents an inter-communal structure in the Calvados department, the Basse-Normandie region named Communaut´e de communes Coeur de Nacre. The first column in Table 2 gives the names of the member municipalities. The next column, called ”P op10”, displays the population ni of each
member i in 2010. The column headed ”%P op10” derives the population of each member as a percentage of the total population of the inter-communal structure. The column headed ”P op10/Quota” derives the population of each municipality divided by the quota. The column named ”N br− del” gives the number of delegates assigned to each municipality-member before the law of 2010, while the last column, headed ”N br− del − S”, gives the simulated number of delegates assigned to each municipality-member according to the new criteria. According to Table 1, this inter-communal structure sh ould be represented by 26 delegates, which means that the quota to get a delegate is 18,228 divided by 26, that is 701.07. Dividing the population by the quota, we allocate 20 delegates. The remaining additional delegates go to Douvres-la-D´elivrande (+2), Luc-sur-Mer (+1), Cresserons(+1) and Anisy (+1). As Plumetot and Colomby-sur-Thaon are left with no
10. Technically, we could have analyzed the apportionment of delegates for all the French regions. However, considering the time constraints that the correction of data imposes, we chose to restrict our analysis to certain regions. First, these three regions have historically a high number of municipalities belonging to inter-communal structures, a fact that makes the comparison before and after reform possible. Second, we chose these three regions because of their geographical proximity to our laboratories. This allowed us to reach out to our personal acquaintances in order to contact the EPCIs more easily when it became necessary to check the consistency of our data. Note that this data base is the last one available to analyze the allocation of delegates between municipalities, the 2014 allocation being unknown from a national point of view.
delegate, two delegates are added to the inter-communal structure council to obtain a total of 28 delegates.
Table 2 –Communaut´e de communes Coeur de Nacre (department 14≪Calvados≫)
Municipalities Pop10 %Pop10 Pop10/Quota Nbr-del Nbr-del-S
Plumetot 215 1.17 0.30 2 1 Colomby-sur-Thaon 415 2.27 0.59 2 1 Anisy 665 3.64 0.94 3 1 Anguerny 812 4.45 1.15 3 1 Basly 910 4.99 1.29 3 1 Cresserons 1,217 6.67 1.73 4 2 Langrune-sur-Mer 1,723 9.45 2.45 5 2 Saint-Aubin-sur-Mer 1,836 10.07 2.61 5 3 Berni`eres-sur-Mer 2,379 13.05 3.39 5 3 Luc-sur-Mer 3,172 17.40 4.52 7 5 Douvres-la-D´elivrande 4,884 26.79 6.96 8 8 Total 18,228 100 47 28
As said before, the data reported in the ”N br− del” column are derived from the analysis of the minutes of the inter-communal structure councils. More precisely, these data were obtained from the report of the inter-communal structure board. Unfortunately, they contained some obvious errors and inconsistencies, as they were extracted from the raw minutes. In fact, we noticed that the number of delegates assigned to certain municipalities was problematic (for 56 EP CIs of our data set) in the sense that municipalities with very few inhabitants had, according to the raw data set, more delegates than municipalities with more inhabitants, which is an a priori unexpected situation. In the absence of fixed and clear rules for the attribution of a number of delegates per municipality before January 2010, we tried to address this problem by initially classifying the problematic cases into two types.11
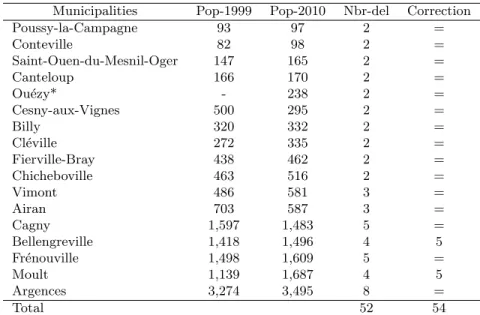
Demographic trend: First, sometimes the number of municipal delegates was defined well before 2010, and some municipalities did not update the number of delegates according to their changing numbers of inhabitants. We can identify this source of error by checking the consistency of the delegates allocated against the 1999 census data. For instance, Table 3 gives an example of demographic errors for the inter-communal structure Val `es Dunes.
Table 3 –Communaut´e de communes du Val `es Dunes (department 14≪Calvados≫)
Municipalities Pop-1999 Pop-2010 Nbr-del Correction
Poussy-la-Campagne 93 97 2 = Conteville 82 98 2 = Saint-Ouen-du-Mesnil-Oger 147 165 2 = Canteloup 166 170 2 = Ou´ezy* - 238 2 = Cesny-aux-Vignes 500 295 2 = Billy 320 332 2 = Cl´eville 272 335 2 = Fierville-Bray 438 462 2 = Chicheboville 463 516 2 = Vimont 486 581 3 = Airan 703 587 3 = Cagny 1,597 1,483 5 = Bellengreville 1,418 1,496 4 5 Fr´enouville 1,498 1,609 5 = Moult 1,139 1,687 4 5 Argences 3,274 3,495 8 = Total 52 54
*Note to Table 3: From January 1, 1972, to December 31, 2005, the Ou´ezy municipality was merged with Cesny-aux-Vignes. Then, the municipalities were separated again. This explains why the population of Cesny-aux-Vignes decreased.
Looking carefully at the number of delegates allocated to each municipality, we notice that despite Moult’s larger population in 2010, the municipality has fewer delegates than Fr´enouville. This can be explained by the fact that the Fr´enouville municipality had a larger number of inhabitants in 1999 than Moult, and that the number of delegates had not been updated in 2010 according to the change in the municipality’s population. We assume that, if the inter-communal structure had had a chance to update its number of delegates, the problem would have disappeared, and we adjust our figures accordingly.
”Gross/coarse” error in the Minutes: In this case, the population numbers do not justify the number of municipal delegates allocated to each municipality (either in 1999 or in 2010). This type of error can be divided into 3 subtypes:
— ”Clear” gross error in the Minutes: This is the case when the delegate allocation problem is easy to correct according to the logic of population levels. Table 4 gives an example of this error type. Looking at the number of delegates allocated to each municipality, we notice that the Br´ehand municipality has fewer delegates than Land´ehen, even though Br´ehand has a larger population in both 1999 and 2010 than Land´ehen. Thus, we can suspect that this is a gross error in the minutes used to build the database. To deal with this problem, we decide to add another delegate to the Br´ehand municipality.
Table 4 –Lamballe Communaut´e (department 22≪Cˆotes D’Armor≫)
Municipalities Pop-1999 Pop-2010 Nbr-del Correction
Quintenic 275 331 2 = Saint-Trimo¨el 327 391 2 = Saint-Rieul 335 412 2 = La Malhoure 355 450 2 = Saint-Glen 564 562 2 = Penguily 427 567 2 = Tr´ebry 730 719 2 = Noyal 799 801 2 = Morieux 786 859 2 = Meslin 723 889 2 = Andel 928 1,024 2 = H´enansal 954 1,031 2 = Land´ehen 1,006 1,251 2 = Br´ehand 1,293 1,404 1 2 Co¨etmieux 1,289 1,515 2 = Pommeret 1,758 1,845 2 = Lamballe 11,187 11,261 17 = Total 23,736 25,312 48 49
— ”Corrected” error: In the less clear cases, we contacted the EP CI directly and confirmed the actual number of delegates allocated to the inter-communal structures. In order to illustrate this type of error, let us take a simple example: the CC du Bocage (Table 5).
Table 5 –Communaut´e de communes du Bocage (department 14≪Calvados≫)
Municipalities Pop-1999 Pop-2010 Nbr-del Correction
Les Cerqueux 652 788 2 3 Somloire 806 892 3 = La Plaine 835 936 4 3 Coron 1,333 1,477 2 3 Yzernay 1,625 1,660 2 3 Maul´evrier 2,899 2,951 3 = Total 8,150 8,704 16 18
If we look closely at the number of delegates allocated to each municipality here, we notice that Somloire has a higher number of delegates than Coron or Yzernay, even though those municipalities had more inhabitants both in 1999 and 2010 than Somloire; thus, we can probably assume that this is a gross error. Similarly, La Plaine has more delegates than Coron or Yzernay but a lower number of inhabitants. To deal with this problem, we contacted the inter-communal structure and obtained the right number of delegates for the year 2010 (3 delegates each).
— ”Deleted error”: In some problematic cases, we were unable to check the accuracy of the data and/or we could not find a logical way to correct it. For example, we can take the case of the Percy municipality (Table 6).
Table 6 –Communaut´e de Communes du Canton de Percy (department 50 Manche) Municipalities Pop-1999 Pop-10 Nbr-del
La Haye-Bellefond 70 73 2 Morigny 84 90 2 Le Guislain 129 114 2 Maupertuis 128 134 2 Margueray 132 151 2 Villebaudon 287 282 3 Montabot 273 286 2 Le Chefresne 281 300 2 Montbray 412 371 3 Beslon 506 514 3 La Colombe 569 619 3 Percy 2,219 2,216 6
We can notice that the Villebaudon and Montabot municipalities have almost the same population size in both the 1999 and 2010 censuses, but that Villebaudon has one delegate more than the Montabot municipality and even more compared to the Le Chefresne municipality. As we were unable to check the accuracy of these data, we decided to delete this EPCI from our database. For the same reason, we deleted only one other inter-communal structure: Le Leff CC in the 22 department. The classification of all the problematic cases according to the types of errors described above is given in the appendix I.12
Hence, of the 377 EPCIs existing in 2010 in the three French regions under scrutiny, we are able to exploit 375 EPCIs grouping more than 4500 municipalities. This allows our empirical analysis to be the first, to our knowledge, to evaluate the fairness in the allocation of delegates within a federal body with such a high number of federal institutions, granted by a real freedom to choose how to share the seats in the federal assembly. In the following section, we present our power index and the reasoning behind it to evaluate the degree of inequality between municipal members of one inter-municipal structure.
3
The measurement of voting power in inter-communal structures
Clearly, the few examples displayed above demonstrate that the inter-communal structures had a lot of flexibility in the allocation of delegates before 2010. We can easily infer that in the 2010 law, one of the aims of the legislators was to give more specific guidelines to the inter-communal structures, assuming that the proportional rule is the ideal that should be met. But is it the right thing to do in this context? Another
criterion we can use for the allocation of delegates in an inter-communal structure is the following: each citizen should have the same a priori probability to be a swinger.13That is, the probability of influencing the result of a vote should be equalized regardless of the municipality the voter resid es in. This idea has been developed in the power index literature for the analysis of decisions in two-tier voting rules (Penrose 1946, Banzhaf 1965), and applied to numerous cases such as the US Electoral College (Owen 1975, Gelman et al. 2004) or the European Union (Felsenthal and Machover 2001, 2004).
3.1
The definition of the Banzhaf index
Banzhaf uses the same idea as Penrose (1946) and considers that the power of a voter i in an assembly is measured by her capacity to change the assembly decision by reversing her vote. In a game (N , v), N = {1, ..., N} is a set of the N members of the voting structure, or players in the game. v is a real-valued function defined on the subsets of N to R. A coalition S is a non-empty subset of N . The game is called a simple game if v(S) ∈ {0, 1}. If v(S) = 0, then S is a losing coalition, while if v(S) = 1 then, it is a winning coalition. Let us denote byW the set of all winning coalitions; sets not in W are called losing coalitions. That is to say, if members of S vote on an amendment then, the amendment passes if S inW, and it is rejected otherwise. A member i of a voting structure is decisive if her vote may change the result of the vote; that is to say, if i votes ”Yes,” the decision is adopted, while if he or she votes ”No”, the decision is rejected (v(S)=1 and v(S − {i})=0). A minimal winning coalition is a winning coalition in which all players are decisive.
The non-normalized Banzhaf index of player i is equivalent to the Penrose index:
Bi(v) =
∑S⊆N,i∈S[v(S) − v(S − {i})]
2n−1
Where 2n−1is the number of coalitions to which player i may belong and S is a non-empty subset of N . This
index gives the probability that a player i is decisive. The formula of the normalized Banzhaf index is:14
BBi(v) =
Bi(v)
∑i∈NBi(v)
A particular class of simple games is the weighted quota games. They are defined by a vector of positive
13. A swinger is a voter/player who casts a vote that may allow a motion to succeed and/or would change the outcome of an election. In the literature, there are two synonyms for swinger: decisive player and pivotal player.
14. We can note that the Banzhaf index can be used to compare the relative power of voters inside the same assembly and under the same decision rule. However, the Banzhaf index is not appropriate to compare the voting power of different voters (or of one voter) under different decision rules, as the Penrose index is.
weights, ˜a = (a1, a2, . . . , an) ∈ R+n and a quota q ∈ [0, ∑i∈nai]. ai is the weight attached to player i, and
a coalition S is winning if and only if ∑i∈Sai > q. Typically, any inter-communal structure council can be
modeled as a weighted quota game, where ai is the number of delegates controlled by a municipality i, and
q is equal to half of the weights.
3.2
Power in two-tier voting systems
The inter-communal structure council can be viewed as a two-tier voting system. In each municipality, the citizens elect their delegates to represent them in the municipal council; then, this municipal council elects its delegates in the inter-municipal structure; that is, the council of delegates is the upper tier in a composite two-tier system. Ideally, when a decision is proposed, the citizens vote ”Yes” or ”No”, and according to the majority will of their citizens, all the delegates are assumed to report this majority decision in bloc.
In this study, our objective is to evaluate the inequality of voting power in French inter-communal struc-tures. In other words, we aim to analyze the fairness of the distribution of the delegates among municipalities belonging to the same inter-communal structure. We are here interested in the ex-ante distribution of muni-cipal delegates in the inter-communal structure councils and not in the different ex-post decisions that the delegates make. Moreover, our aim is to calculate the different coalitions of delegates that may arise and not to analyze the way citizens and delegates vote. We choose to use the most simple way to consider all these combinations, that is the Banzhaf index, rather than other indices.15
According to Penrose, the probability of voter i being decisive is the product of the probability that i is decisive in her municipality times the probability that her municipality is decisive in the inter-communal structure. Hence, equity can be implemented using the law of probability. In a model where voters have to choose between two exclusive proposals A and B, where each vote is determined by independently flipping a fair coin randomly and each municipality is represented by a weight aj at the federal level, the independence
15. Academic treatments, as far as we know, do not cover or at least do not agree on a theoretical account of the choice of the most suitable power index. For instance, in studies concerning European Union decision-making, some arguments can be found in favor of the Banzhaf index. Felsenthal and Machover (2001) analyze the distribution of power of the Council of Ministers of the European Union and argue that the Banzhaf index is the most appropriate measure of power in their case. A similar conclusion is drawn in the study of Laruelle and Widgren (1998), who analyze fairness in the allocation of votes among the EU states. They claim that the non-normalized Banzhaf index is the most appropriate to their study. Laruelle and Widgren argue that in the absence of information about the probability of coalition formation (equal or different probabilities), the Banzhaf index is the most appropriate. Also, for two tiers voting systems, there are hardly any theoretical works that studied the adjustment of other power indices to this situation, Owen (1975) being a rare exception.
of votes across voters allows Penrose to state that:
Probability that citizen i in municipality j is decisive in the assembly = Probability that citizen i is decisive in her municipality×
Probability that municipality j is decisive in the group
(1)
As the probability of being decisive in municipality j with nj inhabitants can be approximated by √
2 √πn j
when nj is large, equity in terms of power between citizen i in municipality j and citizen i′ in municipality
j′ is achieved if: Bj √ 2 √πn j = B j′ √ 2 √πn j′ (2)
Said differently, the ratio between the Banzhaf indices of the two municipalities must be equal to the ratio of the square roots of their populations. Hence, equity in terms of power will be achieved if the normalized Banzhaf power of municipality j is as close as possible to its share of population, measured in square root terms ( √nj
∑ √nj). We will define the Quotient of a municipality j as:
Qj=
BBj∑√nj
√n
j
(3)
This variable should be as close as possible to 1 for each municipality; a value superior to 1 (inferior to 1) indicates that it is overweighted (underweighted). In order to evaluate inequality in terms of power as measured by the Banzhaf index, we use the max-min index: it indicates the number of times that the most powerful citizen is more powerful than the least powerful citizen:
max− min =Q
max j
Qminj
Our choice is slightly different from the one proposed by Felsenthal and Machover (2001), who use instead M ax(d) = Qmaxj − 1 and ran(d) = Qmaxj − Qminj . We felt that our measure, max-min, had a more direct interpretation. Also, to analyze the whole distribution of power, they propose to use classic statistical indices, ρ and χ2, to check whether the distributions of power among the municipalities are close to the vector of
the square roots of populations. However, Felsenthal and Machover do not provide any theoretical argument to justify their use of these standard indices. We computed both the max-min and χ2 indices, but we will
report results for the max-min index only, as the results are similar.16
4
The impact of the 2010 law on the power inequality in EPCIs:
empirical results
4.1
The method and the main results
In this section, we will compare the fairness of the apportionment of delegates in the French inter-communal structures of three regions in Western France before and after the 2010 law. We will derive our criterion Qjand max-min index, which we have used to evaluate the fairness of the distribution of delegates.
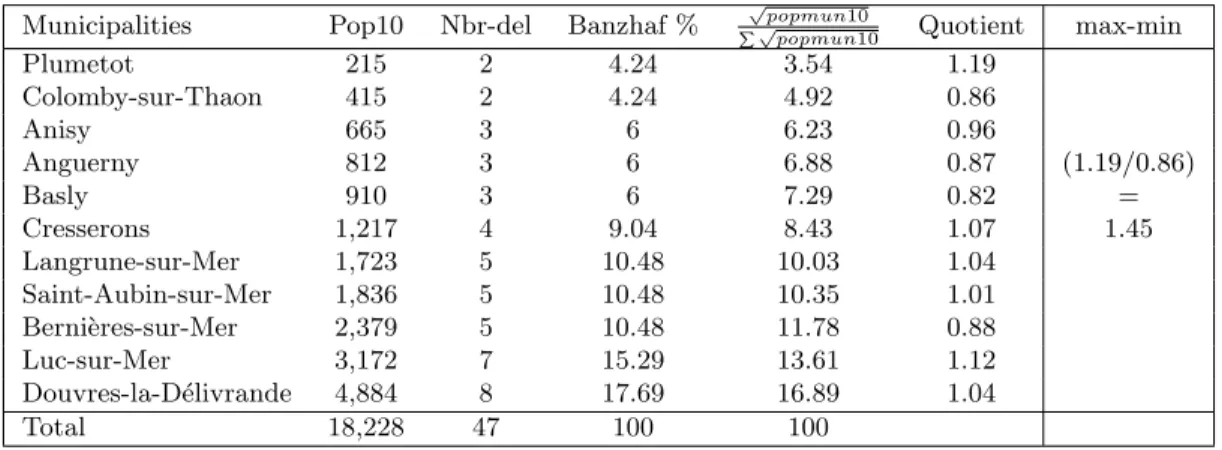
As a first step of our analysis, we calculate the normalized Banzhaf index for each municipality within an inter-communal structure. For this, we developed an algorithm using the ”R” software. The algorithm computes, in a first step, all possible coalitions that can be formed by the municipal delegates in the inter-municipal structure. In a second step, it selects all the coalitions whose weight is greater than the quota, then calculates the number of times that a given player is a swinger. This number is then divided by the number of times the other players are swingers.17 Table 7 gives an example of the calculation of our indices.
Table 7 –Communaut´e de communes Coeur de Nacre (department 14≪Calvados≫)
Municipalities Pop10 Nbr-del Banzhaf %
√
popmun10 ∑
√
popmun10 Quotient max-min
Plumetot 215 2 4.24 3.54 1.19 Colomby-sur-Thaon 415 2 4.24 4.92 0.86 Anisy 665 3 6 6.23 0.96 Anguerny 812 3 6 6.88 0.87 (1.19/0.86) Basly 910 3 6 7.29 0.82 = Cresserons 1,217 4 9.04 8.43 1.07 1.45 Langrune-sur-Mer 1,723 5 10.48 10.03 1.04 Saint-Aubin-sur-Mer 1,836 5 10.48 10.35 1.01 Berni`eres-sur-Mer 2,379 5 10.48 11.78 0.88 Luc-sur-Mer 3,172 7 15.29 13.61 1.12 Douvres-la-D´elivrande 4,884 8 17.69 16.89 1.04 Total 18,228 47 100 100
The fourth column, named ”Banzhaf %”, gives the normalized Banzhaf index as a percentage of the total number of swing situations. The quota is set as the least integer strictly greater than 50% of the total weight. The column headed ”Quotient” is the division between the column ”Banzhaf %” and the relative square root of the population (the fifth column). The column named ”max-min” shows power inequality in the studied EPCI using the ratio of the power between the most powerful municipality and the least powerful one.
In a nutshell, Figure 2 and Figure 3 illustrate our main result: the drastic increase of the max-min ratio
17. In order to check our calculations, we also used automatic computation, via Dennis Leech’s website; refer for details at [http://homepages.warwick.ac.uk$/$$\sim$ecaae/] .
across the regions of Western France after the 2010 reform.18 This result was to be expected for the new
law as, by definition, the Jefferson method is proportional to the population, while the power index theory points towards a repartition of the seats that should be proportional to the square root of the population.19 To some extent, the pre-reform repartition of power comes as a surprise as it was unexpectedly similar to the theoretical recommendation for many inter-municipal structures. We shall come back to this puzzling fact in the conclusion but let us first analyze in detail the situation before and after the 2010 law.
Figure 2 –Geographic distribution of the max-min index in EPCIs before the 2010 law
18. Note that the blank EPCIs are the EPCIs where the raw data were uncertain, as explained before.
19. Incidentally, Barthelemy and Martin (2011) pointed out that among the classic proportional apportionment rules, the Jefferson method was the worst when it comes to equalizing the Banzhaf power of the US citizens in the Electoral College.
Figure 3 –Geographic distribution of the max-min index in EPCIs following the 2010 law
4.2
Power inequalities in EPCIs before the 2010 law
For the general cases (all the 370 inter-communal structures when excluding the 2 undocumented EPCIs and the 5 CU inter-communal structures that deserve a special treatment), Table 8 gives the distribution of the max-min ratios across departments and regions. Our main result is the following: before the 2010 law of inter-municipal reform, most EPCIs have power inequalities lower than 5, with inequality lower than 2 in 140 EPCIs (37.83 % of the 370 EPCIs), and between 2 and 5 in 195 EPCIs (52.7%). Thus, only 35 inter-municipal communities are characterized by relatively high inequalities, representing only 9.46% of the entire set of these federal (inter-municipal) structures existing in the 3 studied regions in 2010.
Table 8 –Classification of inter-communal structures according to the value of the max-min ratio before
the 2010 law
Region Departments ⩾ 1 >2 >5 >10 >100 %prop > 5 & ≤ 2 & ≤ 5 & ≤ 10 & ≤ 100
Calvados 4 24 6 4 0 26 Basse Manche 19 25 1 1 0 4 Normandie Orne 12 24 3 1 1 12 Total 35 73 10 6 1 13 Cˆotes D’Armor 13 24 1 1 0 5 Finist`ere 11 11 1 1 0 8 Bretagne Ille-Et-Vilaine 10 15 0 1 2 10 Morbihan 14 11 0 1 0 3 Total 48 61 2 4 2 6 Loire Atlantique 13 7 1 0 0 4 Pays Maine-et-Loire 11 17 0 0 2 6 de la Mayenne 2 12 1 3 0 22 Loire Sarthe 16 14 0 0 0 0 Vend´ee 15 11 1 1 1 10 Total 57 61 3 4 3 7 Total 140 195 15 14 6 9
More precisely, according to max-min values, our inter-communal structures can be classified as follows:
Category 1: 1≤ max-min ≤ 2. Although the ratios remain relatively close to one, our results show that 140 inter-communal structures belong to this category. This means that the most powerful citizen in these inter-communal structures is at most twice as decisive as the least powerful one. This is the case in 35 EPCIs in Basse Normandie, 48 in Bretagne and 57 in Pays de La loire (see Table 8). We find, in this class, many inter-communal structures that assign the same number of delegates to all municipalities without regard to population size. Table 9 gives an example of this type of inter-communal structure where the population ratio between the smallest and the largest municipalities remains lower than 1/2.
Table 9 –CC de L’Aulne Maritime (department 29≪Finist`ere≫)
Municipalities popmun10 Nbr-del Banzhaf % Quotient max-min Saint-S´egal 944 5 25 1.33 (1.33/0.67)
Rosno¨en 960 5 25 1.32 =
Le Faou 1,708 5 25 0.99 1.983
Pont-de-Buis-l`es-Quimerch 3,715 5 25 0.67
Also in this category 1 of EPCIs with small inequalities, we find inter-municipal structures in which the largest municipality has a share of delegates lower than its weight in the inter-communal population. To
illustrate this, we give two examples of inter-communal structures with one large municipality: The first example is the case where the inter-communal structure holds a small number of members (Table 10), while the second one depicts the case where the inter-communal structure holds a relatively large number of municipalities (Table 11). This last category is an illustration of the Penrose law: The weight of the largest municipality is not big enough for it to get most of the power.20
Table 10 –CC de Belle Ile en Mer (department 56≪Morbihan≫)
Municipalities popmun10 popmun10 % Nbr-del Nbr-del % Banzhaf % Quotient max-min Locmaria 789 15.55 4 0.21 16.7 0.81 (1.37/0.76)
Sauzon 867 17.09 4 0.21 16.7 0.77 =
Bangor 894 17.62 4 0.21 16.7 0.76 1.802
Le Palais 2,522 49.72 7 0.36 50 1.37
Total 5,072 100 19
Table 11 –CC du Pays de Questembert (department 56≪Morbihan≫)
Municipalities popmun10 %popmun10 Nbr-del Nbr-del % Banzhaf % Quotient max-min
Le Cours 517 2.55 2 5.26 5.08 1.06 Saint-Grav´e 696 3.43 2 5.26 5.08 0.92 Rochefort-en-Terre 710 3.50 2 5.26 5.08 0.91 Larr´e 737 3.63 2 5.26 5.08 0.89 Lauzach 872 4.30 2 5.26 5.08 0.82 (1.24/0.81) Molac 1,224 6.04 3 7.89 7.60 1.03 = Limerzel 1,238 6.11 3 7.89 7.60 1.03 1.53 Pluherlin 1,267 6.25 3 7.89 7.60 1.02 La Vraie-Croix 1,290 6.36 3 7.89 7.60 1.01 Berric 1,428 7.04 3 7.89 7.60 0.96 Caden 1,558 7.69 3 7.89 7.60 0.92 Malansac 1,999 9.86 3 7.89 7.60 0.81 Questembert 6,720 33.17 7 18.42 21.32 1.24 Total 20,256 100 38 100 100
Category 2: 2< max-min ≤ 5. The max-min index of 52.7% of inter-communal structures (195 EPCIs) lies between 2 and 5. This means that the most powerful citizen in terms of voting power could be 5 times more decisive than the least powerful one. Tables 12 and 13 show similar cases as in the first category but with an increase in power of the largest municipalities. According to Table 8, we can infer that the three regions have a majority number of their inter-communal structures in this category.
20. Penrose (1946) noticed that, as long as the number of players is large and no player dominates the other outrageously in terms of weight, the Banzhaf index of player i tends to be proportional to its weight aiin a weighted majority game.
Table 12 –Communaut´e de Communes Cˆote de Penthi`evre (department 22≪Cˆotes D’Armor≫)
Municipalities popmun10 %popmun10 Nbr-del Nbr-del% Banzhaf % Quotient max-min La Bouillie 802 5.94 3 10.34 3.33 0.32 (1.24/0.32) Plurien 1,368 10.14 4 13.79 16.67 1.24 = Planguenoual 1,773 13.14 4 13.79 16.67 1.09 3.87 Saint-Alban 1,832 13.57 4 13.79 16.67 1.07 Erquy 3,764 27.89 7 24.14 23.33 1.04 Pl´eneuf-Val-Andr´e 3,957 29.32 7 24.14 23.33 1.02 Total 13,496 100 29 100 100
Table 13 –CC Au Pays de la Roche aux F´ees (department 35≪Ille-Et-Vilaine≫)
Municipalities popmun10 %popmun10 Nbr-del Nbr-del % Banzhaf % Quotient max-min
Arbrissel 256 0.88 2 3.23 3.05 1.27 Forges-la-Forˆet 272 0.93 2 3.23 3.05 1.24 Sainte-Colombe 304 1.04 2 3.23 3.05 1.17 Chelun 314 1.08 2 3.23 3.05 1.15 Eanc´e 355 1.22 2 3.23 3.05 1.08 Boistrudan 665 2.28 2 3.23 3.05 0.79 (1.76/0.53) Thourie 671 2.30 2 3.23 3.05 0.79 = Brie 774 2.65 2 3.23 3.05 0.73 Marcill´e-Robert 931 3.19 2 3.23 3.05 0.67 3.32 Ess´e 1,032 3.54 2 3.23 3.05 0.63 Rann´ee 1,159 3.97 2 3.23 3.05 0.60 Co¨esmes 1,345 4.61 2 3.23 3.05 0.56 Le Theil-de-Bretagne 1,489 5.10 2 3.23 3.05 0.53 Amanlis 1,567 5.37 3 4.84 4.60 0.78 Bais 2,020 6.92 4 6.45 6.15 0.91 Pir´e-sur-Seiche 2,134 7.32 4 6.45 6.15 0.89 Martign´e-Ferchaud 2,598 8.91 6 9.68 9.38 1.23 Retiers 3,575 12.25 7 11.29 10.84 1.21 Janz´e 7,711 26.43 12 19.35 23.17 1.76 Total 29,172 100 62 100 100
Category 3: 5< max-min ≤ 10. In only 15 EPCIs, the max-min index ranges between 5 and 10. That is to say, the most powerful citizen in these EPCIs is at least 5 times more decisive than the least powerful one. In particular, we find in this category inter-communal structures with many small municipalities and one or two large municipalities. This is the case of CC du Pays de B´egard in Table 14.
Table 14 –CC du Pays de B´egard (department 22≪Cˆotes D’Armor≫)
Municipalities popmun10 %popmun10 Nbr-del Nbr-del % Banzhaf % Quotient max-min Landeba¨eron 207 2.40 2 7.69 4.65 0.69 Kermoroc’h 386 4.48 2 7.69 4.65 0.50 (2.13/0.34) Saint-Laurent 428 4.97 2 7.69 4.65 0.48 = Tr´egonneau 470 5.45 2 7.69 4.65 0.45 6.26 Squiffiec 728 8.45 3 11.53 6.97 0.55 P´edernec 1,829 21.24 4 15.38 6.97 0.34 B´egard 4,562 52.98 11 42.30 67.44 2.13 Total 8,610 100 26 100 100 100
Category 4: 10< max-min ≤100. The most powerful citizen in 14 EPCIs is at least 10 times more decisive than the least powerful one. This is the case for inter-communal structures which hold a large number of small municipalities. With 48 municipalities with one delegate among its 57 members, CC Du pays de Falaise in Table 15 is an example of such a category.
Table 15 –CC Du pays de Falaise (department 14≪Calvados≫)
Municipalities popmun10 %popmun10 Nbr-del Nbr-del% Banzhaf % Quotient max-min
Rapilly 41 0.15 1 1.19 0.87 1.38
Vicques 52 0.20 1 1.19 0.87 1.22
⋮ ⋮ ⋮ ⋮ ⋮ ⋮ ⋮
Fresn´e-la-M`ere 480 1.84 1 1.19 0.87 0.40
Morteaux-Couliboeuf 511 1.96 2 2.38 1.70 0.76 ( 4.68/0.40) Ouilly-le-Tesson 527 2.02 2 2.38 1.70 0.75 = Soumont-Saint-Quentin 558 2.14 2 2.38 1.70 0.73 11.7 La Hoguette 633 2.43 2 2.38 1.70 0.68 Villers-Canivet 692 2.66 2 2.38 1.7 0.65 Ussy 847 3.25 2 2.38 1.70 0.59 1 Pont-d’Ouilly 1,038 3.99 3 3.57 2.459 0.77 Potigny 1,734 6.67 4 4.76 3.06 0.74 Falaise 8,456 32.54 17 20.23 42.43 4.68 Total 25,985 84 100 100
Note that even with only 20.23% of delegates, the Falaise municipality already captures 42% of the Banzhaf power.
Category 5: max-min> 100. In 6 EPCIs, the most powerful citizen is at least 100 times more decisive than the least powerful one. This is mainly the case of inter-communal structures with many small municipalities and one major municipality. CC Foug`eres in Table 16 is an example. It is noticed that the case of CC Foug`eres is close to what we call an oceanic game in game theory: it is a game with a large number of small players and only one major player who dominates all others in terms of weight.
Table 16 –CC Foug`eres (department 35≪Ille-Et-Vilaine≫)
Municipalities popmun10 %popmun10 Nbr-del Nbr-del % Banzhaf % Quotient max-min
Combourtill´e 531 1.3 1 3.12 0.09 0.028 Le Loroux 531 1.3 1 3.12 0.09 0.028 La Selle-en-Luitr´e 532 1.31 1 3.12 0.09 0.028 Dompierre-du-Chemin 541 1.33 1 3.12 0.09 0.028 Parc´e 641 1.57 1 3.12 0.09 0.025 Laignelet 862 2.12 1 3.12 0.09 0.022 (4.847/0.015) Bill´e 1,006 2.47 1 3.12 0.09 0.02 = Fleurign´e 1,011 2.49 1 3.12 0.09 0.02 323.13 Beauc´e 1,161 2.86 1 3.12 0.09 0.019 La Chapelle-Janson 1,248 3.07 1 3.12 0.09 0.018 Land´ean 1,257 3.09 1 3.12 0.09 0.018 Parign´e 1,274 3.14 1 3.12 0.09 0.018 Luitr´e 1,276 3.14 1 3.12 0.09 0.018 Saint-Sauveur-des-Landes 1,341 3.3 1 3.12 0.09 0.017 Javen´e 1,814 4.47 1 3.12 0.09 0.015 Romagn´e 1,953 4.81 1 3.12 0.09 0.015 L´ecousse 2,914 7.18 2 6.25 0.11 0.015 Foug`eres 20,678 50.96 14 43.75 98.42 4.847 Total 40,571 100 32 100 100
All in all, 335 EPCIs among the 370 “communaut´es de communes” (CC) or communaut´es d’agglom´eration (CA), the most frequent legal status of inter-municipal structures in France and in our database, have a max-min ratio under 5. It is inferred that in 90% of the EPCIs in Western France, there is not a strong degree of inequality among municipalities belonging to the same inter-communal structure in terms of voting power.
As said before, we chose to analyze the CU (Communaut´e Urbaine) inter-communal structures separately: in our data set we have 5 CUs.21As is shown in Table 17, the max-min ratio tends towards infinity in three CUs, is higher than 100 in one CU, and lower than 2 in the CU of Cherbourg. The existence of infinite ratio is due to fact that we encounter dummy players. A dummy player is a player who is never a swinger and, therefore, has a normalized Banzhaf index equal to 0. This is the case in several municipalities in three CUs where the major municipality in the inter-municipal structure has more than 50% of the municipal delegates. More precisely, the Alen¸con municipality in Communaut´e Urbaine D’Alen¸con had 28 out of 50 delegates, the Brest municipality in Brest M´etropole Oceane had 54 seats among 82, and the Le Mans municipality in Le Mans M´etropole had 40 among 51.
Table 17 –Power inequalities in CU Inter-communal structures before the 2010 law
Region CU max-min
Basse Normandie Communaut´e Urbaine de Cherbourg (50) 1.849 Communaut´e Urbaine D’Alen¸con (61) Infinity Bretagne Brest M´etropole Oceane (29) Infinity Pays de la Nantes M´etropole, Communaut´e Urbaine (44) 472.296 Loire Le Mans M´etropole Communaut´e Urbaine (72) Infinity
To gain more insight into these results, we use the geographic distribution of the data to see whether equity is better achieved in some departments. This geographic breakdown is interesting since EPCIs allocate delegates among municipalities mainly on their own, but were also often advised by the central government ad-ministration headed by the “pr´efet” in each department. Thus, differences between regions and departements in terms of power inequalities might also reflect differences in the way the grouping between municipalities and the allocation of delegates was designed with the help of the central government in France.
We can clearly see from Table 8 that, in every departement, the vast majority of inter-communal structures have a max-min ratio lower than 5. Indeed, the last column, headed prop> 5 in Table 8, gives the proportion per department of EPCIs with a max-min ratio higher than 5, and it remains at 6% in the region of Bretagne. Hence, it is inferred that the distribution of delegates among municipalities in this region was fair. It is clearly shown that only 8 EPCIs have an index greater than 5, and 3 of them are in the Ille-Et-Vilaine department. In particular, equity was not reached for the following three inter-communal structures: CC Foug`eres, Rennes M´etropole and CA du Pays de Saint-Malo.
The Pays de la Loire region has a low proportion of Inter-communal structures, with a max-min ratio above 5, but with higher differences between departments than in the Bretagne region: the Vend´ee department has 10.34% of Inter-communal structures with a max-min ratio above 5, and the La Mayenne department 22.22%. Finally, in Table 8, it is not hard to notice that the Basse-Normandie region contains the highest differences between departments. In particular, the Calvados department has 26.32% of its inter-communal structures with a power index greater than 5. In order to explain these geographic differences exhibited by our result, we propose two hypotheses. The first is that the inequalities are caused by the geographical distribution of population: there may be many inter-communal structures with an important central municipality surrounded by many smaller ones in Calvados. The second is that because, prior to the law of 2010, municipalities cooperatively chose the number of delegates assigned to each municipality; large municipalities were more reluctant to accept a share of delegates lower than their proportion of population in this department compared to other large municipalities in other Western departments of France.
In the next subsection, we will see what the simulated impact of the 2010 law has on these power inequalities between municipalities in their EPCI.
4.3
Simulated power inequalities in EPCIs following the 2010 law
The aim of this subsection is to compare the apportionment of delegates in the inter-municipal council carrying out the rules of the law of December 16, 2010 with the previous apportionment using the Banzhaf index. As we have said before, these rules were fully enforced only after the 2014 local elections but the resulting allocation of delegates between municipalities was not centrally documented, the central government being reluctant to collect the EPCI minutes once again. Therefore, one is unable to fully analyze the impact of the 2010 law and control for the local use of the option allocation mentioned in note 7. This is why our empirical results in this section give simulations of the impact of the 2010 reform of inter-municipal structures. To this end, we will first present the same example of Communaut´e de communes Coeur de Nacre with the index from the simulation data; then, we will compare our index in both sets of data. Table 18 gives a comparison of the ”Banzhaf index” between the observed allocation in 2010 and the simulated allocation induced by the 2010 law. The columns whose names end in ”I” (for initial) correspond to the indices before the 2010 law, while those ending in ”S” (for simulated) indicate the indices according to the simulated data under the 2010 law. As a reminder, the law of 2010 attributes a smaller number of delegates to the municipalities for this EPCI. In particular, the number of delegates of small municipalities decreases by 1 while the number of delegates of the largest municipality remains the same. Hence, the Banzhaf index decreases for the small municipalities but increases for the large ones, and the max-min index soars to 4.6 in the simulation data case: The gap between the most powerful and the least powerful citizens is reinforced.
Table 18 –Example of the apportionment of delegates before and after the law of 2010:
CC Coeur de Nacre (department 14≪Calvados≫)
Municipalities Pop10 Nbr-del Banzhaf % Quotient max-min
I S I S I S I S Plumetot 215 2 1 4.24 3.26 1.19 0.92 Colomby-sur-Thaon 415 2 1 4.24 3.26 0.86 0.66 Anisy 665 3 1 6 3.26 0.96 0.52 (1.19/0.82) (2.06/0.44) Anguerny 812 3 1 6 3.26 0.87 0.47 = = Basly 910 3 1 6 3.26 0.82 0.44 1.45 4.6 Cresserons 1,217 4 2 9.04 6.63 1.07 0.78 Langrune-sur-Mer 1,723 5 2 10.48 6.63 1.04 0.66 Saint-Aubin-sur-Mer 1,836 5 3 10.48 10.19 1.01 0.98 Berni`eres-sur-Mer 2,379 5 3 10.48 10.19 0.88 0.86 Luc-sur-Mer 3,172 7 5 15.29 15.14 1.12 1.11 Douvres-la-D´elivrande 4,884 8 8 17.69 34.85 1.04 2.06 Total 18,228 47 28 100 100 100 100
As previously noted, the CU inter-communal structures are special cases. Table 19 gives the max-min ratio of these inter-communal structures. The results show a contrasted situation: we can notice that the max-min ratio of Cherbourg and that of Nantes M´etropole have increased respectively from 1.849 and 472.296 to 9.9 and infinity, while the ratios of Alen¸con, Le Mans, and Brest have decreased from infinity to 36043.21, 70.96 and 39.58. Indeed, the new criterion introduced by the 2010 law eliminates dummy players in these inter-communal structures. However, the max-min ratio remains largely above 10 for 4 of the 5 CUs. Hence, it can be concluded that the 2010 law does not help to decrease the power of large municipalities in the CU structures.
Table 19 –CU inter-communal structures following the law of 2010
Region CU max-min-S
Basse Normandie Communaut´e Urbaine de Cherbourg (50) 9.90 Communaut´e Urbaine D’Alen¸con (61) 36043.21 Bretagne Brest Metropole Oceane (29) 39.58 Pays de la Nantes M´etropole, Communaut´e Urbaine (44) Infinity Loire Le Mans M´etropole Communaut´e Urbaine (72) 70.96
As for the remainder of the EPCIs studied, in our simulation data (except for CU communities), the max-min ratio tends towards infinity in 13 EPCIs, something that did not occur before the 2010 law. In this sense, the new law cannot be considered as an improvement in terms of fairness. These EPCIs can be divided into two categories. The first one is where the major municipality has a normalized Banzhaf index almost equal to 1, while it is infinitesimal for the other ones. This is the case of 10 inter-communal structures represented in the lines headed Dummies 1 in Table 20. The second category (lines headed Dummies 2 ) is where only some municipalities have a normalized Banzhaf index equal to 0. This is the case of CC de la Ria d’Etel displayed in Table 21. We can see that with the new allocation of delegates, Etel becomes a dummy player.22
22. The case of ´Etel illustrates that for small games it is easy to obtain dummy players as shown in Barth´el´emy et al. (2013). Note that the mergers between EPCIs imposed by laws in 2010 and 2015 have changed the data. Later, the Etel inter-communal structure joined another inter-municipal structure (Auray Quiberon) with 24 municipalities.
Table 20 –EPCIs where ”Dummy players” appear after the 2010 law dep EPCI Name max-min-I max-min-S
14 CA Caen La Mer 84.16 Infinity 14 CC de Lisieux Pays D’Auge 6.04 Infinity 22 CC de Guerl´edan 3.27 Infinity 35 CA Rennes M´etropole 2729.62 Infinity Dummies 1 49 CA Angers Loire M´etropole 157463.96 Infinity
53 CA de Laval 13.06 Infinity
56 CC de Belle Ile en Mer 1.78 Infinity 56 CC Saint Jean Br´evelay communaut´e 2.22 Infinity 61 CC de La Vall´ee du Sarthon 1.73 Infinity 85 CC du Pays de Fontenay-Le-Comt´e 5.79 Infinity 56 CC de la Ria d’Etel 1.29 Infinity Dummies 2 22 CC du Pays Rochois 1.38 Infinity 22 CC Rance-Fr´emur 1.21 Infinity
Table 21 –CC de la Ria d’ ´Etel (department 56≪Morbihan≫)
Municipalities popmun10 Nbr-del Banzhaf% max-min
I S I S I S ´ Etel 2,042 4 4 25 0 Locoal-Mendon 3,033 4 7 25 33.33 Erdeven 3,240 4 7 25 33.33 1.29 Infinity Belz 3,440 4 8 25 33.33 Total 11,755 16 26 100 100
Table 22 presents the evolution of the max-min index before and after the law of 2010 for our entire set of EPCIs. The proportion of inter-communal structures with a max-min ratio below 5 significantly decreases: The number of inter-communal structures in this category decreases from 335 to 167. Also, the last column, named % prop> 5, displays the proportion as a percentage per department for the inter-communal structures with a ratio below 5. The numbers in brackets represent the proportion in the initial database before the 2010 law. It can be noted that this proportion increases sharply in all the regions: Slightly more than 50% of inter-communal structures in almost all departments have a max-min ratio above 5.
Table 22 –Classification of inter-communal structures according to the value of max-min-S ratio23 R´egion D´epartements ⩾ 1 >2 >5 >10 >100 %prop > 5
& ≤ 2 & ≤ 5 & ≤ 10 & ≤ 100
Calvados 1 (4) 16 (24) 5 (6) 7 (4) 9 (0) 55(26) Basse Manche 1 (19) 23 (25) 8(1) 11 (1) 3 (0) 47(4) Normandie Orne 0 (12) 14 (24) 10 (3) 8 (1) 9 (1) 65(12) Total 2 (35) 53 (73) 23 (10) 26 (6) 21 (1) 56(13) Cˆotes D’Armor 0 (13) 17 (24) 9 (1) 9 (1) 4 (0) 56(5) Finist`ere 0 (11) 9 (11) 8 (1) 7 (1) 0 (0) 62(8) Bretagne Ille-Et-Vilaine 0 (10) 13 (15) 6 (0) 6 (1) 3 (2) 53(10) Morbihan 1 (14) 10 (11) 6 (0) 5 (1) 4 (0) 57 (3) Total 1 (48) 49 (61) 29 (2) 27 (4) 11(2) 57(6) Loire Atlantique 1 (13) 11 (7) 4 (1) 4 (0) 1 (0) 42(4) Pays Maine-et-Loire 1 (11) 11 (17) 8 (0) 6 (0) 4 (2) 60(6) de la Mayenne 0 (2) 5 (12) 5 (1) 1 (3) 7 (0) 72(22) Loire Sarthe 1 (16) 14 (14) 8 (0) 5(0) 2 (0) 50(0) Vend´ee 3 (15) 15 (11) 4 (1) 5 (1) 2 (1) 37(10) Total 6 (57) 56 (61) 29 (3) 21 (4) 16 (3) 51(7) Total 9 (140) 158 (195) 81 (15) 74 (14) 48(6) 54(9)
Our second main result is therefore the following: the max-min index for the simulation data clearly demons-trates that the law of 2010 generates a priori higher inequalities of voting power among Western municipalities of France. These inequalities have different explanations: First, the number of delegates of small municipa-lities very often decreases, while the number of delegates of the largest municipality remains the same or also decreases but not in the same proportion. For example, Caen (the major municipality of CA Caen La Mer ) holds 49 % of delegates according to the new law’s criteria, while the same municipality had only 36% of delegates before the new law. Looking at Table 23, we can easily see that the law gives to the largest municipality higher power compared to the previous situation.24
23. Max-min ratios implied by observed numbers of municipal delegates are given between brackets, and were already given by table 8.
Table 23 –CA Caen La Mer (29 municipalities)
Municipalities popmun10 Nbr-del % Nbr-del Banzhaf % Quotient max-min
I S I S I S I S I S P´eriers-sur-le-Dan 488 2 1 1.68 1.23 0.22 0+ 0.08 0+ ⋮ ⋮ ⋮ ⋮ ⋮ ⋮ ⋮ ⋮ ⋮ ⋮ Villons- 684 2 1 1.68 1.23 0.22 0+ 0.06 0+ (2.25/0.0267) (2.44/0+ ) les-Buissons = Colombelles 5,771 3 2 2.52 2.46 0.31 0+ 0.03 0+ 84.16 Infinity Mondeville 10,124 5 3 4.20 3.70 0.43 0+ 0.03 0+ Ifs 10,738 5 3 4.20 3.70 0.43 0+ 0.03 0+ H´erouville 22,590 9 8 7.56 9.87 0.49 0+ 0.02 0+ -Saint-Clair Caen 109,630 43 40 36.13 49.38 92.39 100− 2.25 2.44 Total 217,416 119 81 100 100 100 100
Second, with the new law, cases where municipalities with different population sizes have the same number of delegates have disappeared. For instance, Table 24 displays the case of CC D’Orival. We can see that before the law, each municipality had 2 delegates. However, under the law’s criteria, the largest municipality has 4 times more power than before, while the smallest ones lose power.
Table 24 –CC D’Orival (department 14≪Calvados≫)
Municipalities popmun10 Nbr-del Banzhaf % Quotient max-min
I S I S I S I S Rucqueville 128 2 1 6.66 3.82 1.78 1.02 Colombiers-sur-Seulles 162 2 1 6.66 3.82 1.58 0.90 Tierceville 162 2 1 6.66 3.82 1.53 0.90 Cully 173 2 1 6.66 3.82 1.53 0.87 Amblie 264 2 1 6.66 3.82 1.24 0.71 (1.78/0.515) (1.91/0.527) Villiers-le-Sec 280 2 1 6.66 3.82 1.20 0.69 = = Coulombs 293 2 1 6.66 3.82 1.17 0.67 3.45 3.62 Saint-Gabriel-Br´ecy 300 2 1 6.66 3.82 1.16 0.66 B´eny-sur-Mer 331 2 1 6.66 3.82 1.10 0.63 Martragny 333 2 1 6.66 3.82 1.10 0.63 Fontaine-Henry 480 2 1 6.66 3.82 0.91 0.52 Reviers 558 2 2 6.66 7.98 0.85 1.02 Lantheuil 656 2 2 6.66 7.98 0.78 0.94 Thaon 1,470 2 5 6.66 17.32 0.52 1.36 Creully 1,524 2 6 6.66 24.67 0.51 1.91 Total 30 26 100 100
When it comes to the geographic analysis, we can observe that the increase in the max-min ratio is general, erasing to some extent any regional trend. From Table 22, we notice that in Bretagne and Pays de la Loire we now also have a high proportion of communities with an index power above 5, the highest proportion being observed in the Finist`ere (department 29) and the Mayenne (department 53). In the Basse-Normandie
region, the L’Orne d´epartement has the highest proportion of inter-communal structures with a max-min ratio above 5. As a consequence, we are now able to answer the question of the origin of disparities in voting power among municipalities before the law of 2010. It has nothing to do with the fact that, in some regions, we have a more unequal distribution of the population among the members of an inter-communal structure. The real reason of the disparities is that before the 2010 law, in some territories, the major municipalities accepted a lower share of delegates than what they could have claimed on a population basis.
To conclude, the intuition that stems from this result is the following: when the inter-communal structures were allowed before 2010 to freely decide the allocation of delegates, the largest municipality frequently accepted to reduce its number of delegates so that small municipalities, which were often reluctant to join the EPCI, would accept to become members. Central municipalities thus accepted to be underrepresented to favor a higher number of municipal members in the club, which was viewed as a sort of success in the cooperation process, including by the central government headed by its ”pr´efet” in each department. Furthermore, a recent paper by Mac´e and Treibich (2019) gave theoretical grounds for such a story. They model the formation of a federal union as a game where the first stage is to decide whether or not to join the union. Hence, as their power might be diluted in the union, the small players (in terms of population) will only cooperate if the voting rule is a weighted majority game which will award them a minimal number of delegates, superior to their proportional share. The criteria they use is not based on the concept of power, but on the classical utility concept. But as being small means a lower probability to be decisive and to be on the winning side, small players will not join the union if their stand-alone utility is higher than the one they can get in the union. To meet this participation constraint, the only solution is to adjust their number of delegates above a certain threshold.
5
Conclusion
In this work, our intention was to analyze and compare the fairness of the apportionment of delegates among French municipalities in their inter-municipal assembly before and after the law of December 16, 2010, which is based on the application of Jefferson’s apportionment method. This 2010 law had three purposes. The first was to rationalize the map of municipal cooperation, by asking each municipality to join an inter-municipal structure in 2014. The second was to reduce the total number of delegates for each inter-inter-municipal structure. And the third one was to implement stricter rules in the apportionment of delegates, thereby reducing flexibility in the representation of municipalities within an inter-communal structure.
before and after the law of 2010. The most surprising results are that the distribution of delegates before the 2010 law was quite fair, with only less than 10% of our 370 EPCIs with a max-min ratio superior to five. In contrast, theory suggested that the systematic application of the Jeffersons apportionment method could only deteriorate the situation, and this is exactly what we observed in our simulations.
This result can mainly be explained by the fact that the new law simultaneously increases the power of large municipalities and decreases the number of delegates of small municipalities. Another reason is that some EPCI councils tended (before the law of 2010) to assign equal numbers of delegates among municipalities that did not necessarily have the same population size. These cases have disappeared. Moreover, the new criteria introduced by the 2010 law even created a handful of cases where a municipality has no power at all. We thus conclude that the law should have been checked more carefully to prevent it from creating dummy municipalities. The story behind these facts is in line with the theoretical explanation suggested by Mac´e and Treibich (2019): when municipalities were free to join an inter-communal structure or to remain isolated, small ones had to be compensated.
One may also raise questions about the limits of the power indices used in evaluating the fairness of the apportionment of delegates. In fact, assuming that the municipality does not know the decisions or the opinions of other municipalities, the Banzhaf index considers equally all the coalitions that a municipality may form in order to pass a decision (while being decisive). But in fact, a municipal mayor may be informed of the opinions of other mayors and delegates. We have to remind the reader here that the Banzhaf index can only be used as an a priori measure and that it says nothing about the real behavior of the delegates in the inter-communal council. Also, the independence assumption has been criticized by Gelman et al. (2004). One of the limitations of our analysis is that we have assumed that delegates of each municipality vote in bloc. However, in the law of 2010, this assumption does not hold. With the new law, the delegates that represent a municipality in the inter-municipal council may no longer belong to the same political party. For some decisions, party affiliation might become more important than defending the position of the municipality. Hence, one possible extension of our work is to analyze a case in which delegates of each municipality vote along party lines.
Finally, the situation prior to the 2010 law was fairer than expected, with many large municipalities agreeing to control fewer delegates than they could have done. This raises another fundamental question as to the way the communities handled their budgetary policies. Do the major municipalities also agree to pool their resources with the small ones? Or, on the contrary, do they trade control of resources against a lower number of delegates in the EPCI council? We plan to open the black box of the allocation of fiscal resources