HAL Id: hal-03025678
https://hal.umontpellier.fr/hal-03025678
Submitted on 26 Nov 2020HAL is a multi-disciplinary open access archive for the deposit and dissemination of sci-entific research documents, whether they are pub-lished or not. The documents may come from teaching and research institutions in France or abroad, or from public or private research centers.
L’archive ouverte pluridisciplinaire HAL, est destinée au dépôt et à la diffusion de documents scientifiques de niveau recherche, publiés ou non, émanant des établissements d’enseignement et de recherche français ou étrangers, des laboratoires publics ou privés.
Colour polymorphism is associated with lower extinction
risk in birds
Simon Ducatez, Mathieu Giraudeau, Christophe Thébaud, Lisa Jacquin
To cite this version:
Simon Ducatez, Mathieu Giraudeau, Christophe Thébaud, Lisa Jacquin. Colour polymorphism is associated with lower extinction risk in birds. Global Change Biology, Wiley, 2017, 23 (8), pp.3030 -3039. �10.1111/gcb.13734�. �hal-03025678�
This is the author manuscript accepted for publication and has undergone full peer review but has not been through the copyediting, typesetting, pagination and proofreading process, which may lead to differences between this version and the Version of Record. Please cite this article as doi: 10.1111/gcb.13734
DR. SIMON DUCATEZ (Orcid ID : 0000-0003-2865-4674)
Article type : Primary Research Articles
Colour polymorphism is associated with lower extinction risk in birds
Running head: Avian colour polymorphism and extinction risk
Simon Ducatez S 1,2,3, Mathieu Giraudeau 4,5, Christophe Thébaud 6,7 and Lisa Jacquin 2,6,7
1
University of Sydney, School of Biological Sciences, Sydney, Australia 2
McGill University, Department of Biology, Montréal, Canada 3
CREAF, Cerdanyola del Vallès, Catalonia, Spain 4
Arizona State University, School of Life Sciences, Tempe, AZ 85287-4501, USA. 5
Centre for Ecology & Conservation, College of Life and Environmental Sciences, University of Exeter, Penryn, UK.
6
Université Toulouse 3 Paul Sabatier, CNRS, ENFA; UMR 5174 EDB (Laboratoire Évolution & Diversité Biologique), Toulouse, France.
7
CNRS, Université Paul Sabatier; UMR 5174 EDB, Toulouse, France
Simon Ducatez
Corresponding author:
[email protected] Tel: +34 694 40 25 64 Fax: +61 2 9351 5609
Keywords: colour polymorphism, conservation status, extinction threats, genetic diversity, habitat alteration, invasive species, IUCN red list, PGLMM
Type of paper
Abstract
: Primary research article
Colour polymorphisms have played a major role in enhancing current understanding of how selection and demography can impact phenotypes. Because different morphs often display alternative strategies and exploit alternative ecological niches, colour polymorphism can be expected to promote adaptability to environmental changes. However, whether and how it could influence populations' and species' response to global changes remains debated. To address this question, we built an up-to-date and complete database on avian colour polymorphism based on the examination of available data from all 10,394 extant bird species. We distinguished between true polymorphism (where different genetically determined morphs co-occur in sympatry within the same population) and geographic variation (parapatric or allopatric colour variation), because these two patterns of variation are expected to have different consequences on populations’ persistence. Using the IUCN red list, we then showed that polymorphic bird species are at lesser risk of extinction than non-polymorphic ones, after controlling for a range of factors such as geographic range size, habitat breadth, life history and phylogeny. This appears consistent with the idea that high genetic diversity and/or the existence of alternative strategies in polymorphic species promote the ability to adaptively respond to changing environmental conditions. In contrast, polymorphic species were not less vulnerable than non-polymorphic ones to specific drivers of extinction such as habitat alteration, direct exploitation, climate change and invasive species. Thus, our results suggest that colour polymorphism acts as a buffer against environmental changes, although further studies are now needed to understand the underlying mechanisms. Developing accurate quantitative indices of sensitivity to specific threats is likely a key step towards a better understanding of species response to environmental changes.
Introduction
Intraspecific variation in animal colour is an ideal model system to investigate the causes and consequences of phenotypic variability within populations (Roulin 2004, Gray & McKinnon 2007, Hoekstra 2006). Colour patterns influence performance and fitness of individuals through both direct effects of pigment production (e.g. camouflage or thermoregulation) and indirect effects (e.g. suites of correlated physiological and behavioural traits) (Roulin 2004). Colour polymorphism (i.e. the co-existence of alternative colour morphs within the same population) is often associated with variability in a range of traits, including life history,
behavioural and physiological traits (Roulin 2004, Ducrest et al. 2008, McKinnon and Pierotti 2010). As a result, different morphs often display alternative strategies, have different fitness optima, occupy different habitats and exploit alternative ecological niches (Sinervo and Lively 1996, Roulin 2004, Brommer et al. 2005, McKinnon and Pierotti 2010, Emaresi et al. 2014). Previous research has suggested that species exhibiting high intraspecific variability in colour and life-history traits can establish more successfully in new areas, and are less vulnerable to extinction (Forman et al. 2012, González-Suárez and Revilla 2013, Cattin et al. 2016, Gilroy et al. 2016). By increasing trait variability and total niche breadth at the population level, the coexistence of several morphs in colour polymorphic species may favour persistence in human-altered and/or changing environments (Forsman et al. 2008). In other words, high colour variability at the population level might promote and facilitate population persistence through time and adaptation to changing environments, through the use of a larger diversity of resources and/or microhabitats.
Accordingly, and irrespective of the direction of causation, previous studies showed that colour variability is associated with the use of a broader range of habitats (e.g. Galeotti and Rubolini 2004), a larger distribution range and a better ability to deal with environmental changes in amphibians (Forsman & Hagman 2009), reptiles (Forsman & Aberg 2008), and birds (Delhey et al. 2013). However, most previous studies were restricted to regional species assemblages (Australia), and did not distinguish between true colour polymorphism (where different genetically determined morphs co-occur in sympatry within the same population) and geographic variation (parapatric or allopatric colour variation, implying no local co-occurrence of distinct colour forms across the whole distribution range). Yet, these two types of colour variation are likely to have different evolutionary origins. Constraints on gene flow and large-scale environmental variation are believed to be responsible for most intraspecific geographic variation in colouration, whereas balancing selection is the main mechanism expected to maintain colour polymorphism at a local scale (Roulin 2004; McLean & Stuart-Fox 2014; Wellenreuther et al. 2014; Bolton et al. 2015). Distinguishing between these two types of colour variation is therefore critical since they can have very different consequences on population processes and on species responses to specific environmental changes (Mayr 1941; McLean and Stuart-Fox 2014).
The aim of this study is to investigate whether and how colour polymorphism relates to species-specific response to environmental changes, considering the risk of global extinction as a proxy for susceptibility to environmental changes (Mace et al. 2008). We chose to focus on birds for several reasons. First, birds are particularly well-studied relative to
other taxa, making it possible to perform large-scale comparative analyses. In particular, risk of global extinction and species vulnerability to specific types of threats have been assessed by the IUCN for most described species (Mace et al. 2008, http://www.iucnredlist.org/). As a result, predictors of extinction risk have also been intensively studied in birds (e.g. Owens and Bennett 2000, Lee and Jetz 2011). Second, the recent publication of a complete phylogeny of extant birds (Jetz et al. 2012) now allows analyses using a comparative framework over the whole Aves class.
As a first step to our study, we compiled an up-to-date and complete database on colour polymorphism based on the examination of available data from all 10,394 extant bird species. Previous studies had already collated data on colour polymorphism in birds (e.g. Galeotti et al. 2003), but they did not always distinguish between true colour polymorphism and cases of geographic variation. To make sure our analyses were really dealing with the potential effects of colour polymorphism, we only took into account true polymorphism and discarded all doubtful cases for which no observation or data could confirm the presence of colour variants within populations. We excluded cases of clinal or discontinuous geographic variation that do not involve polymorphism per se, i.e. the coexistence of different coloured morphs at the local scale.
This allowed us to test whether colour polymorphism was associated with a lower susceptibility to environmental changes, using the IUCN index of relative risk of extinction as a proxy of such susceptibility. Since previous comparative analyses have shown that insularity, generation length, body mass or habitat breadth are associated with risk of global extinction (e.g. Owens and Bennett 2000, Lee and Jetz 2011), we included these traits in the analyses, to evaluate if colour polymorphism had some additional power to explain extinction susceptibility to environmental changes. We then tested whether polymorphic species display higher genetic diversity than non-polymorphic ones, a hypothesis that has, to our knowledge, not been tested previously, and that could explain differences in resilience related to polymorphism. To that aim, we obtained estimates of genetic diversity from the literature and tested whether they differ between polymorphic and non-polymorphic species. We used microsatellite data on heterozygosity and allelic richness of wild populations extracted from the database published in Willoughby et al. (2015). We also investigated whether polymorphic species differed from non-polymorphic ones in their susceptibility to specific threats (habitat alteration, direct exploitation, climate change and invasive species) in order to identify possible causes of extinction susceptibility. Overall, we expected polymorphic species to be at lower risk of extinction, to display higher genetic diversity, and to be less
sensitive and/or sensitive to fewer threatening processes than non-polymorphic species (Roulin 2014).
Materials and Methods
Data
We define colour polymorphism as the co-existence of alternative colour morphs within the same population, the same age class and the same sex, following Roulin (2004). To identify colour polymorphic species from the full world species list, we first used the digital resource "Handbook of the Birds of the World Alive" (www.hbw.com, del Hoyo et al. 2016; hereafter HBWAlive). Examining the resources available for each of the 10,394 extant bird species, we performed a search using selected keywords (“morph” OR “morphs” OR “polymorph*” OR “form” OR “forms” OR “variant*”) and also thoroughly examined all colour plates. Any species showing plumage variation within subspecies, sex and age class, according to the HBWAlive text or plates, was then considered as a “potentially polymorphic species”. This first step yielded a list of 508 species. We then used the detailed information available for each of these species, and extracted the description of colour variation to include it in our database (Supplementary Table 1). This allowed us to classify as non-polymorphic a range of species which did not match our definition. In particular, we excluded all species with no evidence of co-existence of different morphs in the same geographic area. For instance, in some species, colour variation was unambiguously described as being related to geography, with different colour variants occurring in allopatry (for example the Loggerhead shrike
Lanius ludovicianus, in which the Southern populations of the nominate race are paler than
the Northern ones). In other cases, colour variation was related to the extremely rare occurrence of a colour variant (e.g. the Steller’s sea eagle Haliaeetus pelagicus, where only one all dark brown captive individual has ever been reported).
More precisely, to be considered as polymorphic, species had to meet two criteria. First, species had to show discrete variation in colouration within population, sex and age class; the criterion of discrete variation being sometimes difficult to assess and ambiguous for many species, we followed the opinion provided by authors in the scientific literature and in HBWAlive. In case no mention of discrete variation or polymorphism was provided, we used a conservative approach and the species was considered as non-polymorphic. In contrast, the variation was considered as discrete if morphs or polymorphism were mentioned by the authors. Second, species had to show a relatively high proportion of the rarest morph, at least in one population, in order to exclude variation due to recurrent mutations. Ford (1965) and
Philip (1975) proposed a threshold of 1%. Here we used a more conservative approach and considered a threshold of 5%, following recent studies (e.g. Perrard et al. 2014). When no quantitative data on morph frequency was available, we considered species as non-polymorphic when the rarest morph was said to be “very rare” or “occasional”, as potentially polymorphic when the rarest morph was said to be “rare” and as polymorphic when the rarest morph was said to be “common”. We then double checked each potentially polymorphic and polymorphic species, by searching through the literature for further evidence of polymorphism (or lack thereof) and information on morphs’ frequency and co-occurrence. To that aim, we conducted a search in the Web of Knowledge digital resource, using the following keywords: Topic = “species scientific name” AND (“color*” OR “colour*” OR “morph” OR “morphs” OR “polymorph*”). This search was performed in March 2016. Although we did not use it in our analyses, we also added information on frequency and co-occurrence of colour morphs, and on geographic variation in morph frequency, and added it in the database to allow future studies on geographic variation in morph-ratio as advocated by McLean and Stuart-Fox (2014). Finally, we used bird families’ monographs when available (see Supplementary Material 3 (SM3) for the list of references), and considered resources that were identified from citations within the references found during the search. We then used the information collected from HBWAlive and additional references to attribute to each species a final index of polymorphism (0 = not polymorphic; 1 = polymorphic; potentially polymorphic species are also included in the database but were not used in our analyses). The dataset, which includes polymorphism scores, details on colour variation and references for each of the 508 initially selected species, is provided as Supplementary Material 1. We also provide a comparison of our dataset with the dataset previously collated by Galeotti et al. (2003, see Supplementary Material 2), with justification for discrepancies between the two datasets. We restricted our analyses to species considered as truly polymorphic to be conservative.
Genetic diversity data
To test for differences in genetic diversity between polymorphic and non-polymorphic species, we extracted data on heterozygosity and allelic richness from Willoughby et al. (2015). In this paper, the authors conducted a quantitative review of vertebrate microsatellite data published since 1990, and provide estimates for wild populations, as well as the numbers of individuals and loci considered in each study. We extracted data on bird populations, and excluded populations in which less than 10 loci were screened. This resulted into a total of 408 populations of 291 species, including 27 populations of 19 different polymorphic species.
Extinction risk
The most comprehensive listing of species’ extinction risk comes from the IUCN (International Union for the Conservation of Nature), who attributes a category of extinction risk to all extant bird species (except 62 data deficient species). The IUCN Red List classification is based on a robust system to evaluate the risk of global species extinction (Rodrigues et al. 2006, Mace et al. 2008), and has allowed researchers to identify a range of traits that influence vulnerability (e.g. Bennett & Owens 1997, Cooper et al. 2008, Davidson
et al. 2008, Siliceo & Dìaz 2010). We used the IUCN Red List status (from
www.iucnredlist.org) as our measure of species extinction risk, excluding extinct and data deficient species (note that no recently extinct species was known as polymorphic). We converted the risk categories to an ordinal index from Least Concern (1) to Critically Endangered (5).
A challenge for comparative models that use Red List status to assess extinction risk is that testing if range size determines extinction risk can become a circular argument for species listed as threatened because of their small range. A solution is to exclude species listed as threatened under that criterion, but this biases the sample, as only threatened and small-range species are excluded. We thus performed two separate analyses for all models with extinction risk as response variable, first focusing on the subset of species not listed under the small-range criterion and including geographic small-range size as a covariate (calculated using IUCN extent of occurrence maps and equal-area Behrmann projections; see also Gonzalez-Suarez et al. 2013), then considering all species but excluding range size from the covariables, to test for results’ consistency.
Threat vulnerability
In the IUCN threat classification scheme version 3.1, up to 99 different types of threats are considered and organised in a hierarchical classification. Our analyses required combining threats into a few broader categories in order to limit biases in the identification of threats (Hayward 2009). Following Ducatez and Shine (2016), we reclassified the threats into the four main commonly recognised categories: habitat alteration /destruction (including pollution); direct exploitation; climate change; and invasive species (including disease) (see SM4), and constructed a binary variable for each threat category (0 = not affected by the threat, 1 = affected). We also calculated the number of threats affecting each species (from 0 to 4).
Research effort
Research effort can affect the number of threats associated with a given species in IUCN listings (more intensively studied bird species are rated as being subject to more threats: Ducatez and Shine 2016). Similarly, colour polymorphism might be less detected in poorly studied species. We thus included an index of research effort in our analyses and used the number of papers published on each species between 1978 and 2008 according to the online version of the Zoological Record (from Ducatez and Lefebvre 2014). Note however that research effort might be higher in polymorphic species because polymorphism per se is a target of research in evolutionary biology. Thus, we conducted all analyses twice, either including research effort or not, to check for consistency.
Predictors of extinction risk and polymorphism
To control for possible confounding effects on variation in extinction risk, we included in all analyses, in addition to colour polymorphism, a set of traits such as insularity, generation length, body mass, habitat breath, migratory behaviour and range size. Species insularity was coded as 0 for mainland species and 1 for insular species, using data from the IUCN. Generation length data were extracted from Birdlife’s digital resources on the birds of the world (www.birdlife.org), and mass data were obtained from Dunning (2008). As an index of habitat breadth, we used a recently developed index based on patterns of species co-occurrence within each of the 101 habitat categories recognized by the IUCN (database for all terrestrial vertebrates published in Ducatez et al. 2014). Shortly, a species is allocated a quantitative score based on the diversity of other taxa with which it co-occurs: a generalist species occurs in a range of habitat categories that vary considerably in species composition, whereas a specialist species is found only in habitats that contain a consistent suite of other species (Ducatez et al. 2014). This index has been shown to reliably reflect habitat breadth compared to previously used indexes based on subjective numbers of habitat classes (Ducatez et al. 2014, 2015). As an index of migratory behaviour, we used data from Birdlife’s website and built an ordinal variable, with 1 = sedentary or nomadic, 2 = altitudinal migrant and 3 = long distance migrant.
Analyses
Our aim was to test whether extinction risk, numbers of threats (from 0 to 4), and vulnerability to the four threat categories (habitat alteration (including pollution); direct
exploitation; climate change; and invasive species (including disease)) differed between polymorphic and non-polymorphic species. We built Phylogenetic Generalized Linear Mixed Models (PGLMMs) considering all extant bird species for which we had data for all variables of interest (6338 species, including 173 polymorphic species) and accounting for phylogenetic effects. We used GLMMs with Markov chain Monte Carlo (MCMC) techniques using the R package MCMCglmm. As advised by Hadfield (2010), we used ordinal distribution for all models as we had ordinal (IUCN status, number of threats) and binary (vulnerability to each threat category) response variables. We first fitted models that included all fixed effects as explanatory variables, and used backward selection to identify minimal adequate models that retained only significant variables (except for polymorphism and research effort that were always retained in the final models). Initially included fixed effects were polymorphism, insularity, generation length, body mass, habitat breadth, migratory behaviour and geographic range size. Biogeographic realm (13 categories: 12 different realms plus one category for species occupying two or more realms) was included as a random effect to correct for geographic variation in levels of threat. To account for phylogenetic relatedness among species, we used the phylogeny from Jetz et al. (2012) available on birdtree.org. This website does not provide one unique consensus tree, but samples trees from a pseudo-posterior distribution. We first ran the model selection five times independently using five randomly extracted trees. Model selection always yielded the same minimum adequate models, whichever tree was considered. We then randomly extracted 30 different trees from the pseudo-posterior distribution, ran one model per tree and averaged the parameters over the 30 trees. For each model, the MCMC chains were run for 550,001 iterations with a burn-in interval of 50,000 to ensure satisfactory convergence. A total of 1,000 iterations were sampled to estimate parameters for each model. We checked that autocorrelation levels among samples were lower than 0.1. Following Hadfield (2010), we
Finally, to test for differences in genetic diversity between polymorphic and non-polymorphic species, we built PGLMM including either heterozygosity or allelic richness as response variables, and the number of individuals and number of loci used to estimate genetic diversity as explanatory variables, in addition to colour polymorphism (fixed effects). Allelic richness was log-transformed to fit with normality assumptions. As for the previously described analyses, we included phylogeny as a random factor using the 30 randomly fixed the covariance structure and used poorly informative priors for the variances. Explanatory variables were standardized to a mean of 0 and a variance of 1 to obtain directly comparable coefficients. All analyses were conducted twice, first including research effort as fixed effect then excluding it.
extracted trees, building one model per tree and averaging the parameters over the 30 trees. We used Gaussian distributions as both heterozygosity and log-transformed allelic richness were normally distributed, and priors that equally split the variance between the phylogeny and the residuals. Using different variance partitioning for the priors (from a variance of 0 for the phylogeny to a variance of 0 for the residuals) yielded similar results. We used the same iterations, burn-in intervals, sampling frequency and convergence controls as previously described for the MCMC chains, and explanatory variables were similarly standardized.
Results
Colour polymorphism database
We identified a total of 270 truly polymorphic species, with another 56 species (removed from our analyses) considered as “potentially polymorphic” (see Supplementary Material 1). Among the truly polymorphic species, geographic variation in morph ratios was investigated in 92 species, detected in 84 and not detected in eight species.
Extinction risk
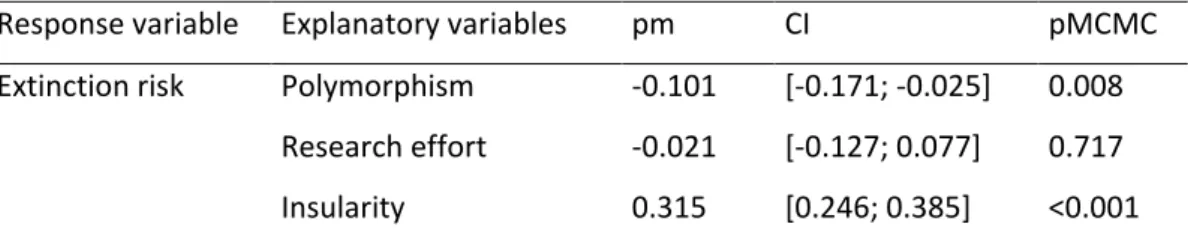
We found polymorphic species to be at lower risk of extinction than non-polymorphic ones (Table 1, Figure 1), after taking into account potentially confounding variables. A larger habitat breadth was associated with a lower risk of extinction, and extinction risk increased with generation length and body mass, was higher in insular as compared to continental species, and lower in species with a larger geographic range (Table 1). Research effort (pMCMC = 0.717) and migratory behaviour (pMCMC = 0.392) did not affect extinction risk in our analyses. We obtained similar results when excluding research effort from the model (SM5), or when considering all species (i.e. including species listed as threatened under the small range criterion) and excluding geographic range size as explanatory variable (SM6).
Genetic diversity and colour polymorphism
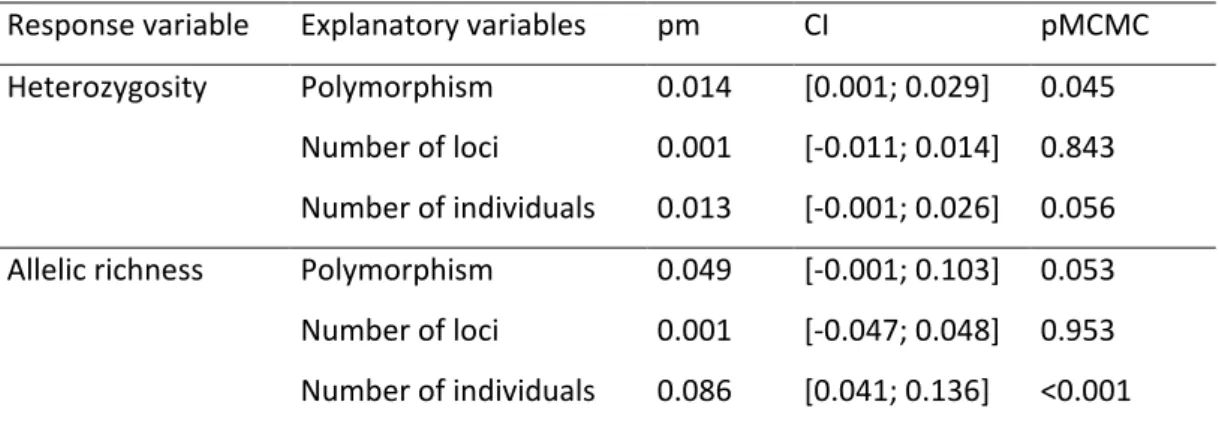
Genetic diversity was higher in polymorphic species than in non-polymorphic ones, as illustrated by their significantly higher heterozygosity (pMCMC = 0.045) and by the trend towards a higher allelic richness (pMCMC = 0.053), after including the number of individuals and loci in the models (Table 2).
The mean number of threats attributed to a given species did not differ between polymorphic and non-polymorphic species (pMCMC = 0.362; see Table 3, Figure 2; number of threats affecting polymorphic species = 0.43 ± 0.07; non-polymorphic species = 0.41 ± 0.01). In contrast, research effort increased the number of threats (Table 3), insular, migrant and larger species were vulnerable to more threats, whereas habitat generalist species and species with a larger geographic range were vulnerable to fewer threats (Table 3). Counting the number of threat categories according to the IUCN classification instead of our re-categorization yielded similar results (see SM7).
Threats’ vulnerability
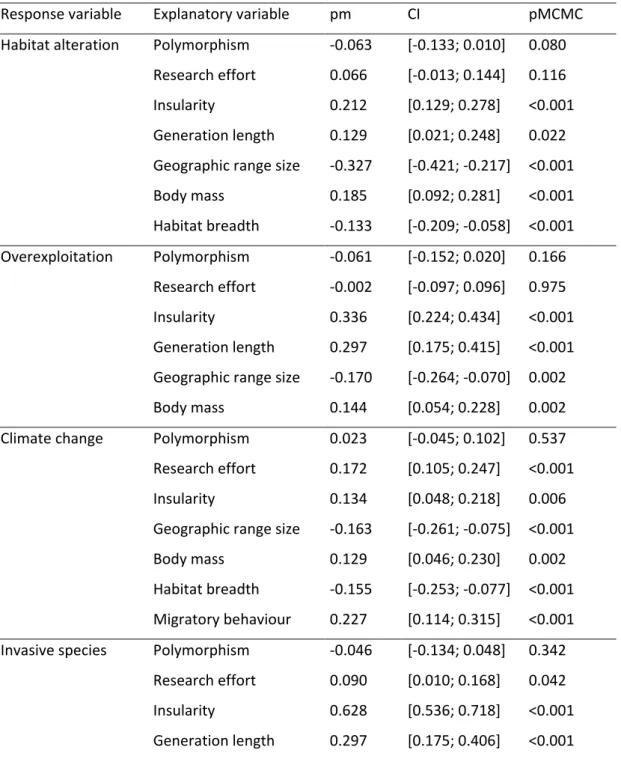
Polymorphic and non-polymorphic species did not differ in their vulnerability to any of the four threat categories considered (habitat alteration; direct exploitation; climate change; and invasive species) (Table 4). We only detected a non-significant trend, polymorphic species being slightly less vulnerable to threats related to habitat alteration (pMCMC = 0.080). In contrast, other variables significantly predicted species vulnerability to the four threat categories. Species that attracted more research were more likely to be vulnerable to climate change and invasive species. Insular species and species with a smaller geographic range were more vulnerable to all four threat categories, and long lived species were more vulnerable to all four but climate change. Species with a higher body mass were more affected by all four categories except invasive species. Finally, generalist species were less vulnerable to habitat alteration, and migratory species were more vulnerable to climate change and invasive species (Table 4).
Because of lower conservation importance, non-threatened species might be less precisely evaluated, in terms of threat vulnerability, than threatened species (Gonzàlez-Suàrez and Revilla 2014). We thus conducted all analyses considering the effects of polymorphism on threat vulnerability and number of threatening processes a second time, focusing on species at risk of extinction (VU, EN and CR categories). Because these analyses yielded similar conclusions with regards to the effects of polymorphism, they are provided as SM8 and 9. Models excluding research effort also yielded qualitatively similar results with regards to polymorphism and are also provided as SM8 and 9.
Discussion
Our results show that intraspecific variation in colour traits could bring crucial advantages in terms of species resilience. Using the most up-to-date sources of information available, we
built a new database on colour polymorphism in birds, a system that has played a central role in the understanding of intraspecific diversity maintenance and evolution in general. True polymorphism and geographical variation in colouration are expected to affect population processes and response to environmental changes differently (Mayr 1942; McLean and Stuart-Fox 2014). Using a combination of quantitative and qualitative criteria to determine whether a species should be considered polymorphic or not allowed us to distinguish between these two types of variation. In addition, by associating each species, whether a true polymorphic or a potential one, to literature references, our database is also meant to be easy to update in the future. By providing information on clinal variation (or lack thereof) in morph frequencies, we also aim to facilitate future research on how geographic variation in polymorphism may shape speciation processes associated with polymorphism (McLean and Stuart-Fox 2014). With this new database, we hope to provide a useful tool for evolutionary and conservation biologists and to motivate further research into the causes and consequences of intraspecific variability and the evolution of animal colouration.
Our database allowed us to test whether, on a global scale, polymorphic bird species differ in their risk of extinction, as compared to non-polymorphic ones. We found that polymorphic species have a lower risk of extinction. This result was robust when including variables such as insularity, generation length, body mass, habitat breadth, migratory behaviour, phylogeny or biogeographic realm in the analyses. It was also consistent whether range size or research effort were included in the analyses or not. Similarly, including absolute latitude or hemisphere (North vs South) of species distribution in the models did not affect the results (results not shown). This suggests that more phenotypically diverse species are more resilient to environmental changes, and that variability in colouration could be a good indicator of such resilience. Our results raise questions on the mechanisms that could explain the lower risk of extinction of polymorphic as compared to non-polymorphic species. If polymorphism influences extinction risk via increased range size or habitat breadth (note that additional analyses confirmed that polymorphic species have a larger habitat breadth and distribution range as shown in a previous study by Galeotti and Rubolini (2004), cf. SM10), we would not expect support for models including additive effects of polymorphism and range size or habitat breadth. For the same reasons, differences in life history or biogeography between polymorphic and non-polymorphic species are unlikely to explain these results. Colour polymorphism per se thus seems to have an additional power to explain extinction risk.
Several hypotheses might explain this result. First, polymorphism may only be maintained in populations/species with large effective population size, and as such be a cue of genetic characteristics that may help dealing with environmental changes (Evans and Sheldon 2008; Willoughby et al. 2015). Our finding that polymorphic species display higher genetic diversity appears to support this hypothesis. The small number of polymorphic species we could include in this analysis (19), hence its low statistical power, suggests that this difference could be particularly strong. To our knowledge, this is the first direct evidence supporting the hypothesis that colour polymorphism can be used as a cue of a higher genetic diversity. Note however that the effect of genetic diversity on population processes and responses to changing environmental conditions is still controversial (e.g. see Chapman et al. 2009; Dlugosch et al. 2015). Another, not exclusive, hypothesis, is that polymorphic species are made of individuals with alternative strategies, such as alternative ecological niches or life history strategies, allowing them to directly and immediately respond to different environmental conditions (Forsman et al. 2008; Wennersten and Forsman 2012). For example, in the Eurasian scops owl Otus scops, changes in morph ratios in Italy over the last century followed temperature and rainfall changes (Galeotti et al. 2009). Similar temporal changes in morph ratios according to environmental factors were observed in other polymorphic species (e.g. in the Tawny owl Strix aluco Karell et al. 2011, or in the Common murre Uria aalge Reiertsen et al. 2012). These results suggest that, at least in some species, colour polymorphism embodies the existence of different evolutionary responses to different environmental conditions within populations. As a cue of the existence of several strategies adapted to different environmental conditions, polymorphism could then act as a buffer, at the population level, against environmental changes (see also Roulin 2014).
Our results do not seem to support the predictions of Bolton et al. (2015), who suggested that the genetic architecture of polymorphic species, and especially the potential existence of genetic incompatibilities between morphs, might have negative effects on population persistence under environmental changes. Although we show here that polymorphic species are, on average, at an advantage in regard to extinction risk, genetic constraints and incompatibilities may still have opposite effects in some species, in line with Bolton et al. (2015)’s hypothesis. For example, the polymorphic Gouldian finch Erythrura
gouldiae, which shows postzygotic incompatibilities between morphs (according to a study on
captive birds, Pryke and Griffith 2009), is classified as Near Threatened by the IUCN. Our results suggest however that these genetic incompatibilities may not be the rule, or have only marginal effects on species resilience. Future investigations of the genetic architecture of
colour polymorphisms could perhaps clarify when genetic incompatibilities between morphs may or may not affect responses to environmental changes.
Contrasting with our predictions, the number of threats to polymorphic and non-polymorphic species were similar. In addition, non-polymorphic and non-non-polymorphic species did not differ in their sensitivity to the different categories of threats. This result was also robust when including the aforementioned variables in the analyses. It is particularly surprising to find no difference between polymorphic and non-polymorphic species because of the lower risk of extinction in polymorphic species, which suggests that polymorphic species could be better at dealing with at least some drivers of extinction. Two aspects related to threat assessments may explain this result. First, assessments of threat vulnerability are qualitative, mostly rely on experts’ opinion, and are likely less accurate than assessments of extinction risks (see Ducatez and Shine 2016). However, these indices have often proved to be useful to assess predictors of threat vulnerability, yielding results that are largely consistent with theoretical expectations (e.g. see González-Suárez et al. 2013). In our study, the effects of covariates on threat vulnerability (e.g. higher sensitivity to habitat destruction in habitat specialists, or to invasive species in insular birds) are also in line with theoretical expectations, suggesting that these indices are, to some extent, reliable. Second, polymorphic species could be overall vulnerable to the same threats, but may not be as strongly affected as non-polymorphic ones. The “threat vulnerability” variables are binary, so that a species is considered as either vulnerable or not. Two species that are considered as vulnerable may however be vulnerable at different levels, polymorphic species being for instance vulnerable to the same threats as non-polymorphic species, but these threats having a less radical effect on them. The recent development of a new scoring protocol for threat assessments by the IUCN should increase confidence in these indices (see http://www.iucnredlist.org/technical-documents/classification-schemes/threats-classification-scheme). These new continuous and more quantitative estimates of threat impacts are based on additive scores and defined thresholds, and consider the timing, scope and severity of the different threat categories. They will provide a useful framework to come closer to an explanation for differences in risk of extinction that are currently difficult to relate to threat vulnerability, given the data available.
The lower risk of extinction of polymorphic as compared to non-polymorphic species suggests that colour polymorphism can act as a buffer against environmental changes. A higher genetic diversity, and/or the pre-existence of different strategies favouring rapid adaptive responses to environmental changes are potential mechanisms explaining this result. To distinguish between these possibilities, one crucial step is to identify the specific
extinction drivers that differ between polymorphic and non-polymorphic species. Though we were not able to detect such differences with the indices currently provided by the IUCN, the development of new global quantitative indices should help making progress in that direction. Improving current knowledge of the ecological and evolutionary mechanisms responsible for the maintenance of colour polymorphism are also fundamental steps towards a mechanistic understanding of polymorphism’s role in species responses to environmental changes. The up-to-date database provided in this study should motivate further research on these mechanisms, and on the evolution of polymorphism in general. With this study and the associated database, we hope to elicit further investigations of colour polymorphic species in the research effort to understand how phenotypic variability at the population level can influence population persistence through time and adaptation to changing environments.
Acknowledgements: We thank five anonymous reviewers for their very constructive
comments that greatly helped improving the manuscript. SD received financial support from the Australian Research Council, the Fondation Fyssen, an NSERC grant to Louis Lefebvre and the project CGL2013-47448-P from the Spanish Government to Daniel Sol. LJ was funded by the Fondation Fyssen and by an Idex starting grant from the Université Fédérale Toulouse-Midi-Pyrénées. CT was funded by the “Laboratoire d’Excellence” TULIP (ANR-10-LABX-41).
Bibliography
Bennett PM, Owens IPF (1997) Variation in extinction risk among birds: chance or evolutionary predisposition? Proceedings of the Royal Society B, Biological Sciences, 264, 401-408.
Bolton PE, Rollins LA, Griffith SC (2015) The danger within: the role of genetic, behavioural and ecological factors in population persistence of colour polymorphic species. Molecular Ecology, 24, 2907-2915.
Brommer JE, Ahola K, Karstinen T (2005) The colour of fitness: plumage coloration and lifetime reproductive success in the tawny owl. Proceedings of the Royal Society B, Biological Sciences, 272, 935-940.
Cattin L, Schuerch J, Salamin N, Dubey S (2016) Why are some species older than others? A large-scale study of vertebrates. BMC Evolultionary Biology, 16, 90.
Chapman JR, Nakagawa S, Coltman DW, Slates J, Sheldon BC (2009) A quantitative review of heterozygosity-fitness correlations in animal populations. Molecular Ecology, 18, 2746-2765.
Cooper N, Bielby J, Thomas GH, Purvis A (2008) Macroecology and extinction risk correlates of frogs. Global Ecology and Biogeography, 17, 211-221.
Davidson AD, Hamilton MJ, Boyer AG, Brown JH, Ceballos G (2009) Multiple ecological pathways to extinction in mammals. Proceedings of the National Academy of Sciences of the USA, 106, 10702-10705.
Delhey K, Smith J, Peters A (2013) Colour-variable birds have broader ranges, wider niches and are less likely to be threatened. Journal of Evolutionary Biology, 28, 1559-1568.
del Hoyo J, Elliott A, Sargatal J, Christie DA (1992-2010) Handbook of the Birds of the World, Vol. 1-16. Lynx Edicions, Barcelona, Spain.
Dlugosch KM, Anderson SR, Braasch J, Cang FA, Gillette HD (2015) The devil is in the details: genetic variation in introduced populations and its contributions to invasion. Molecular Ecology, 24, 2095-21111.
Ducatez S, Lefebvre L (2014) Patterns of research effort in birds. PLoS ONE, 9, e89955.
Ducatez S, Shine R (2016) Drivers of extinction risk in terrestrial vertebrates. Conservation Letters DOI: 10.111/conl.12258.
Ducatez S, Tingley R, Shine R (2014) Using species co-occurrence patterns to quantify relative habitat breadth in terrestrial vertebrates. Ecosphere, 5, 152.
Ducatez S, Clavel J, Lefebvre L (2015) Ecological generalism and behavioural innovation in birds: technical innovation or the simple incorporation of new food? Journal of Animal Ecology, 84, 79-89.
Ducrest AL, Keller L, Roulin A (2008) Pleiotropy in the melanocortin system, coloration and behavioural syndromes. Trends in Ecology and Evolution, 23, 502-510.
Dunning JB (2008) CRC Handbook of Avian Body Masses, 2nd Ed., CRC Press, Inc., Boca Raton, Florida, USA.
Emaresi G, Bise P, Altwegg R, Henry I, van den Brink V, Gasparini J, Roulin A (2014) Melanin-specific life-history strategies. The American Naturalist, 183, 269-280.
Evans SR, Sheldon BC (2008) Interspecific patterns of genetic diversity in birds: correlations with extinction risk. Conservation Biology, 22, 1016-1025.
Forsman A, Ǻberg V (2008) Associations of variable coloration with niche breadth and conservation status among Australian reptiles. Ecology 89, 1201-1207.
Forsman A, Hagman M (2009) Association of coloration mode with population declines and endangerment in Australian frogs. Conservation Biology, 23, 1535-1543.
Forsman A, Ahnesjö J, Caesar S, Karlsson M (2008) A model of ecological and evolutionary consequences of color polymorphism. Ecology, 89, 34-40.
Forsman A, Wennersten L, Karlsson M, Caesar S (2012) Variation in founder groups promotes establishment success in the wild. Proceedings of the Biological Society B, Biological Sciences, 279, 2800-2806.
Galeotti P, Rubolini D (2004) The niche variation hypothesis and the evolution of colour polymorphism in birds: a comparative study of owls, nightjars and raptors. Biological Journal of the Linnean Society, 82, 237-248.
Galeotti P, Rubolini D, Dunn PO, Fasola M (2003) Colour polymorphism in birds: causes and functions. Journal of Evolutionary Biology, 16, 635-646.
Galeotti P, Rubolini D, Sacchi R, Fasola M (2009) Global changes and animal phenotypic responses: melanin-based plumage redness of scops owls increased with temperature and rainfall during the last century. Biology Letters, 5, 532-534.
Gilroy JJ, Gill JA, Butchart SHM, Jones VR, Franco AMA (2016) Migratory diversity predicts population declines in birds. Ecology Letters, 19, 308-317.
González-Suárez, M, Revilla E (2013) Variability in life-history and ecological traits is a buffer against extinction in mammals. Ecology Letters, 16, 241-252.
González-Suárez M, Revilla E (2014) Generalised drivers in the mammalian endangerment process. PLoS ONE, 9, e90292.
González-Suárez M, Gómez A, Revilla E (2013) Which intrinsic traits predict vulnerability to extinction depends on the actual threatening processes. Ecosphere, 4, art76.
Gray SM, McKinnon JS (2007) Linking color polymorphism maintenance and speciation. Trends in Ecology & Evolution, 22, 71-79.
Hadfield JD (2010) MCMC methods for multi-response generalized linear mixed models: the MCMCglmm R package. Journal of Statistical Software, 33, 1-22.
Hayward MW (2009) The need to rationalize and prioritize threatening processes used to determine threat status in the IUCN Red List. Conservation Biology, 23, 1568-1576.
Hoekstra HE (2006) Genetics, development and evolution of adaptive pigmentation in vertebrates. Heredity, 97, 222-234.
Jetz W, Thomas G, Joy J, Hartmann K, Mooers A (2012) The global diversity of birds in space and time. Nature, 491, 444-448.
Karell P, Ahola K, Karstinen T, Valkama J, Brommer JE (2011) Climate change drives microevolution in a wild bird. Nature Communication, 2, 208.
Lee TM, Jetz W (2011) Unravelling the structure of species extinction risk for predictive conservation science. Proceedings of the Royal Society B, Biological Sciences, 278, 1329-1338.
Mace GM, Collar NJ, Gaston KJ, Hilton-Taylor C, Akcakaya HR, Leader-Williams N, Milner-Gulland EJ, Stuart SN (2008) Quantification of extinction risk: IUCN’s system for classifying threatened species. Conservation Biology, 22, 1424-1442.
Mayr E (1942) Systematics and the origin of species, from the viewpoint of a zoologist. Harvard University Press, Cambridge, MA, USA.
McKinnon JS, Pierotti MER (2010) Colour polymorphism and correlated characters: genetic mechanisms and evolution. Molecular Ecology, 19, 5101-5125.
McLean CA, Stuart-Fox D (2014) Geographic variation in animal colour polymorphisms and its role in speciation. Biological Reviews, 89, 860-873.
Owens IPF, Bennett PM (2000) Ecological basis of extinction risk in birds: habitat loss versus human persecution and introduced predators. Proceedings of the National Academy of Sciences of the USA, 97, 12144-12148.
Perrard A, Arca M, Rome Q et al. (2014) Geographic variation of melanisation patterns in a hornet species: genetic differences, climatic pressures or aposematic constraints? PLoS One,
9, e94162.
Pryke SR, Griffith SC (2009) Postzygotic genetic incompatibility between sympatric color morphs. Evolution, 63, 793-798.
Reiertsen TK, Erikstad KE, Barrett RT, Sandvik H, Yoccoz NG (2012) Climate fluctuations and differential survival of bridled and non-bridled common guillemots Uria aalge. Ecosphere, 3, art52.
Rodrigues ASL, Pilgrim JD, Lamoreux JF, Hoffmann M, Brooks TM (2006) The value of the IUCN Red List for conservation. Trends in Ecology & Evolution, 21, 71-76.
Roulin A (2004) The evolution, maintenance and adaptive significance of genetic color polymorphism. Biological Reviews, 79, 815-848.
Roulin A (2014) Melanin-based colour polymorphism responding to climate change. Global Change Biology, 20, 3344-3350.
Siliceo I, Díaz JA (2010) A comparative study of clutch size, range size, and the conservation status of island vs. mainland lacertid lizards. Biological Conservation, 14, 2601-2608.
Sinervo B, Lively CM (1996) The rock-paper-scissors game and the evolution of alternative male reproductive strategies. Nature, 380, 240-243.
Wellenreuther M, Svensson EI, Hansson B (2014) Sexual selection and genetic colour polymorphisms in animals. Molecular Ecology, 23, 5398-5414.
Wennersten L, Forsman A (2012) Population-level consequences of polymorphism, plasticity and randomized phenotype switching: a review of predictions. Biological Reviews, 87, 756-767.
Willoughby JR, Sundaram M, Wijayawardena BK et al. (2015) The reduction of genetic diversity in threatened vertebrates and new consequences for recommendations regarding IUCN conservation rankings. Biological Conservation, 191, 495-503.
Supplementary Information
Supplementary Material 1: Bird polymorphism database.
Supplementary Material 2: Comparison between the new colour polymorphism database and the database provided in Galeotti et al. (2003).
Supplementary Material 4: table showing the reclassification of IUCN threat categories into 4 categories.
Supplementary Material 5: models explaining extinction risk excluding research effort from the covariates.
Supplementary Material 6: (A) models explaining extinction risk considering all species, including species listed under the small-range criterion, but excluding geographic range size as covariate. (B) models explaining extinction risk focusing on the subset of species not listed under the small-range criterion and including geographic range size but not research effort as covariates.
Supplementary Material 7: models explaining the number of threats affecting a species summing the number of IUCN threat categories (i.e., number of threats among 11 categories). Supplementary Material 8: models explaining the number of threats affecting a species considering all bird species and including research effort as covariate (A), focusing on species at risk of extinction and including research effort (B), or focusing on species at risk of extinction and excluding research effort (C).
Supplementary Material 9: models explaining the number of threats (among 4) affecting a species considering all species and excluding research effort (A), or focusing on species at risk of extinction and including research effort (B) or not (C).
Supplementary Material 10: models showing the differences in habitat breadth and geographic range size between polymorphic and non-polymorphic species.
Supplementary Material 11: Dataset. Supplementary Material 12: R code.
Table 1. Best models explaining extinction risk in birds, excluding species listed under the small-range criterion. Non-polymorphic species were taken as reference so that a negative effect (pm) of polymorphism reflects a lower extinction risk in polymorphic as compared to non-polymorphic species. Continental species were taken as reference so that a positive effect of insularity reflects a higher extinction risk in insular as compared to continental species. We used the MCMCglmm R package and included phylogeny and biogeographic realm as random factors, and used backward selection to identify minimal adequate models that retained only significant variables (except for polymorphism and research effort that were always retained in the final models). See main text for details. pm = posterior mean; CI = credibility interval.
Response variable Explanatory variables pm CI pMCMC Extinction risk Polymorphism -0.101 [-0.171; -0.025] 0.008
Research effort -0.021 [-0.127; 0.077] 0.717 Insularity 0.315 [0.246; 0.385] <0.001
Generation length 0.292 [0.181; 0.376] <0.001 Geographic range size -0.314 [-0.404; -0.229] <0.001
Body mass 0.089 [0.025; 0.150] 0.008
Habitat breadth -0.313 [-0.401; -0.242] <0.001
Table 2. PGLMM testing for differences in genetic diversity (heterozygosity and allelic richness) between polymorphic and non-polymorphic species. Non-polymorphic species were taken as reference so that a positive effect of polymorphism reflects a higher heterozygosity or allelic richness in colour polymorphic as compared to non-polymorphic species. We used the MCMCglmm R package and included phylogeny as random factor. See main text for details. pm = posterior mean; CI = credibility interval.
Response variable Explanatory variables pm CI pMCMC Heterozygosity Polymorphism 0.014 [0.001; 0.029] 0.045
Number of loci 0.001 [-0.011; 0.014] 0.843 Number of individuals 0.013 [-0.001; 0.026] 0.056 Allelic richness Polymorphism 0.049 [-0.001; 0.103] 0.053 Number of loci 0.001 [-0.047; 0.048] 0.953 Number of individuals 0.086 [0.041; 0.136] <0.001
Table 3. Best models explaining the number of threats (1 to 4: habitat alteration, invasive species, direct exploitation, climate change) affecting bird species. Resident species were taken as reference so that a positive effect of migratory behaviour reflects a higher number of threats in migratory as compared to resident species. We used the MCMCglmm R package and included phylogeny and biogeographic realm as random factors, and used backward selection to identify minimal adequate models that retained only significant variables (except for polymorphism and research effort that were always retained in the final models). See main text for details. pm = posterior mean; CI = credibility interval.
Response variable Explanatory variables pm CI pMCMC
Number of different threats Polymorphism -0.027 [-0.082; 0.029] 0.362 Research effort 0.130 [0.073; 0.187] <0.001 Insularity 0.268 [0.197; 0.331] <0.001 Geographic range size -0.242 [-0.311; -0.169] <0.001 Body mass 0.168 [0.096; 0.221] <0.001 Habitat breadth -0.119 [-0.178; -0.053] <0.001 Migratory behaviour 0.080 [0.001; 0.148] 0.022
Table 4. Best models explaining birds’ vulnerability to four threat categories (habitat alteration, direct exploitation, climate change and invasive species). Resident and continental species were taken as reference so that a positive effect of migratory behaviour or insularity reflects a higher vulnerability to a given threat in migratory and insular species, as compared to resident and continental species. We used the MCMCglmm R package and included phylogeny and biogeographic realm as random factors, and used backward selection to identify minimal adequate models that retained only significant variables (except for polymorphism and research effort that were always retained in the final models). See main text for details. pm = posterior mean; CI = credibility interval.
Response variable Explanatory variable pm CI pMCMC
Habitat alteration Polymorphism -0.063 [-0.133; 0.010] 0.080 Research effort 0.066 [-0.013; 0.144] 0.116 Insularity 0.212 [0.129; 0.278] <0.001 Generation length 0.129 [0.021; 0.248] 0.022 Geographic range size -0.327 [-0.421; -0.217] <0.001 Body mass 0.185 [0.092; 0.281] <0.001 Habitat breadth -0.133 [-0.209; -0.058] <0.001 Overexploitation Polymorphism -0.061 [-0.152; 0.020] 0.166 Research effort -0.002 [-0.097; 0.096] 0.975 Insularity 0.336 [0.224; 0.434] <0.001 Generation length 0.297 [0.175; 0.415] <0.001 Geographic range size -0.170 [-0.264; -0.070] 0.002 Body mass 0.144 [0.054; 0.228] 0.002 Climate change Polymorphism 0.023 [-0.045; 0.102] 0.537 Research effort 0.172 [0.105; 0.247] <0.001 Insularity 0.134 [0.048; 0.218] 0.006 Geographic range size -0.163 [-0.261; -0.075] <0.001 Body mass 0.129 [0.046; 0.230] 0.002 Habitat breadth -0.155 [-0.253; -0.077] <0.001 Migratory behaviour 0.227 [0.114; 0.315] <0.001 Invasive species Polymorphism -0.046 [-0.134; 0.048] 0.342
Research effort 0.090 [0.010; 0.168] 0.042 Insularity 0.628 [0.536; 0.718] <0.001 Generation length 0.297 [0.175; 0.406] <0.001
Geographic range size -0.163 [-0.252; -0.074] <0.001 Migratory behaviour 0.167 [0.049; 0.267] 0.002
Figures’ caption
Figure 1. Proportion of species within each extinction risk category in colour polymorphic and non-polymorphic birds. LC = Least Concern; NT = Near Threatened; VU = Vulnerable; EN = Endangered; CR = Critically Endangered.
Figure 2. Mean number of threats (among habitat alteration, direct exploitation, climate change and invasive species) affecting polymorphic and non-polymorphic bird species.