ORIGINAL PAPER
Samy Egli Æ Michael Riedel Æ Hans-Ju¨rgen Mo¨ller Æ Anton Strauss Æ Damian La¨ge
Creating a map of psychiatric patients based
on psychopathological symptom profiles
Received: 15 May 2008 / Accepted: 22 August 2008 / Published online: 22 January 2009
j Abstract Background In the current debate about the categorical or dimensional classification of mental disorders many fruitful methods to illustrate one or the other aspect are employed, and suggestions are made to combine the two perspectives. Methods We present such an approach to combine both perspec-tives at the same time. Based on psychopathological AMDP-symptom profiles, a map of psychiatric patients was calculated by robust nonmetric multidi-mensional scaling (NMDS). Results The sample from the Ludwig-Maximilians University in Munich included the records of patients, who were admitted and discharged in 2002 and 2003 with a diagnosis of either paranoid schizophrenia, (F20.00, N = 24), bipolar affective disorder, current episode manic without psychotic symptoms (F31.1, N = 32) or severe depressive episode without psychotic symp-toms (F32.2, N = 78). In the resulting map of patients we found a clear categorical distinction according to the diagnostic groups, but also high regression values of AMDP-syndromes (manic syndrome: r = 0.83, depressive syndrome: r = 0.68, and paranoid-hallu-cinatory syndrome, r = 0.62). Discussion The map of
psychiatric patients presents an approach to consider the categorical and dimensional aspects at the same time. We were able to identify meaningful delinea-tions between diagnostic clusters as well as continu-ous transitions. This method allows the whole psychopathological profile of each individual patient to be considered and also to identify misdiagnosed cases at a glance.
j Key words AMDP symptom-profiles Æ robust nonmetric multidimensional scaling (NMDS) : diagnosis Æ classification Æ categorical Æ dimensional
Introduction
How to characterize psychiatric patients has always been a heavily debated issue. Over the last century, the two classification systems, the diagnostic and statistical manual (DSM) of the American Psychiatric Association (APA) and the international classifica-tion of diseases (ICD) of the World Health Organi-zation (WHO), have been established as worldwide standards in this regard. As we move towards the revisions and new versions of these systems, DSM-V and ICD-11, classificatory questions have again become prominent in the research community. One of the main challenges is the currently intensely debated question of categorical or dimensional diagnosis in psychiatry [10,14,22,25,29,31,43,49]. A categorical diagnosis is achieved by defining the membership of a subject (i.e. a patient) to a category (i.e. a diagnosis) if a given number of diagnostic criteria is met (the polythetic approach). A dimen-sional diagnosis defines a cut-off point on a con-tinuum of a given factor (i.e. a diagnosis of mental retardation if a subject achieves an IQ of 70 or less). In this debate, many fruitful methods supply both the categorical and the dimensional perspective with convincing lines of argument. To name just a few of
EAPCN
848
Dr. Phil. S. Egli Æ Prof. Dr. D. La¨ge (&)
Institute of Psychology, Applied Cognitive Psychology University of Zurich
Binzmu¨hlestrasse 14/28 8050 Zurich, Switzerland
E-Mail: [email protected] Dr. Phil. S. Egli
Schlo¨ssli Privatklinik fu¨r Psychiatrie Oetwil, Switzerland
Dr. med. M. Riedel Æ Prof. Dr. med. H.-J. Mo¨ller Æ Dr. med. A. Strauss Department of Psychiatry
Psychiatric Hospital of the Ludwig-Maximilans-University Munich, Germany Dr. med. M. Riedel Department of Psychiatry Ludwig-Maximilians-University Nussbaumstr. 7 80336 Munich, Germany
the more frequently employed methods, factor ana-lytic and taxometric studies provide findings in various diagnostic groups which speak in favor of a dimensional view [14, 49]. However, findings sup-porting a categorical view are also reported for various groups of disorders e.g. [35,48]. More recent studies suggest on the whole that the two perspec-tives are fundamentally equivalent [24], like two sides of the same coin [41], and that both are useful depending on the objectives [29, 31]. Consequently, the focus of the question has shifted from whether it is useful to integrate dimensional aspects to how they can best be implemented in the existing, pre-dominantly categorical, classification systems e.g. [30, 36, 37, 44]. Hence, a method that is able to combine the two perspectives presents an interesting approach in this field of research. Such a method was employed by our research group in an earlier study [17], which considered both perspectives at the same time by combining them within one analysis. Using nonmetric multidimensional scaling (NMDS) e.g. [8], we constructed a joint depiction of both aspects. Based on the knowledge of experienced psychiatrists and psychotherapists, we calculated an expert model on the level of mental disorders through NMDS, which was successfully validated in a subsequent study [18]. With regard to current classification questions, the map showed aspects of concordance with the ICD-10 and the DSM-IV as well as indicators supporting critical observations made in this field. For instance, the difficulty of delineating mood and anxiety disorders, which had already been pointed out by Maser and Cloninger [39] over 15 years ago, was well illustrated by the spatial closeness of the corresponding diagnostic clusters in the map. However, while this map pro-vided interesting insights into the professionals’ perception of the mental disorders, it did not, of course, allow any conclusions to be drawn about how patients bearing the diagnoses are actually related to each other. To attain this goal, real clinical data are needed, which is the basis of current anal-ysis of our research group. In a first step, we scaled the 140 psychopathological AMDP [2] symptoms of 2,485 patients of the psychiatric hospital of the Ludwig-Maximilians-University in Munich, exhibit-ing the whole spectrum of mental disorders in a two-dimensional NMDS space [34]. The AMDP rating scale covers a broad spectrum of symptoms such as delusions or disturbances of affect and is described in more detail in the methods section. In the resulting map, we were able to verify factors that had been identified previously by factor analysis, and to provide support for the stability of these factors over time. Moreover, these results were complemented with additional insights. For instance, the map of-fered a plausible explanation as to why the apathy syndrome [4], which had previously been assumed clinically but had not been empirically identified,
could not have been found before. After establishing such a map of psychopathological symptoms, we now describe, in a second step, the construction of a map containing patients. The positions of the patients (i.e. the relational proximities) in the maps are calculated based on the pairwise correlations of their symptom profiles. Since such a map resulting from a nonmetric multidimensional scaling consists in a continuous Euclidian space, no categorical decisions have to be made regarding a patient’s membership of one categorical group or another. Rather, the patient can be localized on a continuum. Furthermore, patients can be mapped considering the whole spectrum of psychopathological symptoms without any prior data selection or weighting based on a priori assumptions. The subsequent integration of diagnostic data in the same map clarifies the extent to which the patient exhibits an affiliation with a given diagnostic category based on the characteristics of the symptom profile, or whether the patient stands between the categories, exhibiting equally pronounced symptoms of multiple diagnostic categories. Similar approaches were already being pursued over 30 years ago. By combining several multivariate methods of analysis and based on symptom data, conceptual profiles of psychiatrists regarding phenomenological subtypes were com-pared to empirically derived profiles and were found to correspond [40]. Another approach based on symptom profiles originating in that period [50, 51] is the grade of membership model, which is still used today e.g. [16]. This approach has the impor-tant advantage that patients can be characterized as simultaneously and partially belonging to more than one diagnostic class expressed by a weighted linear combination of profiles of symptoms. This was an important contribution to model a ‘‘continuum of psychopathological symptoms where no clear boundaries can be drawn and ‘entities’ are artificially designated’’ [38]. The current study presents an approach to build a continuous space of patients based on their symptom characteristics. This allows each case to be individually positioned and visual-ized in relation to every other case without a priori defining or empirically deriving categorical entities or prototypes.
Methods
j Sample
The sample consists of patients who were hospitalized at the psy-chiatric hospital of the Ludwig-Maximilians-University, Munich. It included the records of patients who were admitted and discharged between 1 January 2002 and 31 December 2003 with a diagnosis of either paranoid schizophrenia (F20.00, N = 24), bipolar affective disorder, current episode manic without psychotic symptoms (F31.1, N = 32) or severe depressive episode without psychotic symptoms (F32.2, N = 78). The diagnostic group of patients with
severe depression was chosen since this entity by definition exhibits the most depressive symptoms and can therefore be seen as pro-totypical.
j Clinical data
In this study, the AMDP admission records were analyzed, which are routinely collected one to four days after inpatient admission. All included patients gave informed consent to be assessed using this instrument. The AMDP system is an operationalized docu-mentation system for psychopathology conceived for a broad clinical use [6] and covering a large spectrum of 100 psychopath-ological and 40 somatic symptoms. The symptom spectrum com-prises disorders of consciousness, disturbances of attention and memory, formal disorders of thought, phobias and compulsions, delusions, disorders of perception, disorders of ego, disturbances of affect, disorders of drive and psychomotility, circadian distur-bances, other disturdistur-bances, disturbances of sleep and vigilance, appetite disturbances, gastrointestinal disturbances, cardiac-respi-ratory disturbances, other autonomic disturbances, and other somatic disturbances. The AMDP originated from the translation of the traditional psychopathology according to Jaspers [27], Schnei-der [47], and others into a modern, standardized observer rating scale, including operationalized criteria and definitions. It is the most widely used and best known psychiatric documentation system in the German-speaking area [35] and was developed by the German-Swiss-Austrian ‘‘Association for Methodology and Docu-mentation in Psychiatry’’ (Arbeitsgemeinschaft fu¨r Methodik und Dokumentation in der Psychiatrie) [2]. Moreover, the AMDP sys-tem has also been translated into many other languages [21], and has been used in various international studies e.g. [12,13,26,45,
46]. Reliability and validity is reported to be good to very good and the AMDP can be considered a well established test based on a multitude of empirical studies [3]. Symptom items are rated by clinicians from 0 (symptom not present) to 1 (mild), 2 (moderate), and 3 (severe). In this study, the psychopathological status (symptoms 1–100) and the somatic status (symptoms 101–140) were considered for further analysis.
j Statistical analyses
The maps of the patients were calculated by nonmetric multidi-mensional scaling (NMDS) based on the AMDP symptom profiles. First, the profiles between each pair of patients were converted into a proximity coefficient. Since the nature of the data strongly influences the choice of a coefficient [20], and based on our experience stemming from the construction of the maps of the symptoms [34], we evaluated difference and correlation measures as proximity coefficients. While a difference measure more strongly accounts for differences in the levels of symptom profiles (i.e. the illness severity), the differences of the levels are less pronounced in a correlation measure. For the present data, which are character-ized mainly by qualitative differences (diagnostically different groups), a Spearman correlation proved to be the most appropriate coefficient. Due to the ranking of the data involved in a Spearman correlation in combination with the specific data distributions of the current sample (most observations are ‘‘0’’ = not present), this coefficient visualizes qualitative differences more clearly than a Pearson coefficient. The proximity coefficients were then translated by the robust NMDS algorithm RobuScal [33] into a two-dimen-sional space. NMDS iteratively approximates an n-dimentwo-dimen-sional solution to maximally correspond to the given proximities on an ordinal level. Hence, a small distance between two objects in an NMDS space corresponds to a large similarity of these two objects in the proximity matrix and vice versa. A scree test can be em-ployed to identify the optimal compromise between a minimal dimensionality and a maximal congruence between the similarities given by the proximity matrix and the distances given by the configuration in the n-dimensional space. To integrate the dimensional expression of the severity in the maps, the AMDP sum
scores were calculated for every patient in total and separately for each syndrome identified by Baumann and Stieglitz [4]. These external scales were then fitted using multiple regressions e.g. [8] into the NMDS maps. All statistics were computed using SPSS for Windows, Microsoft Excel and ProDaX.
Results
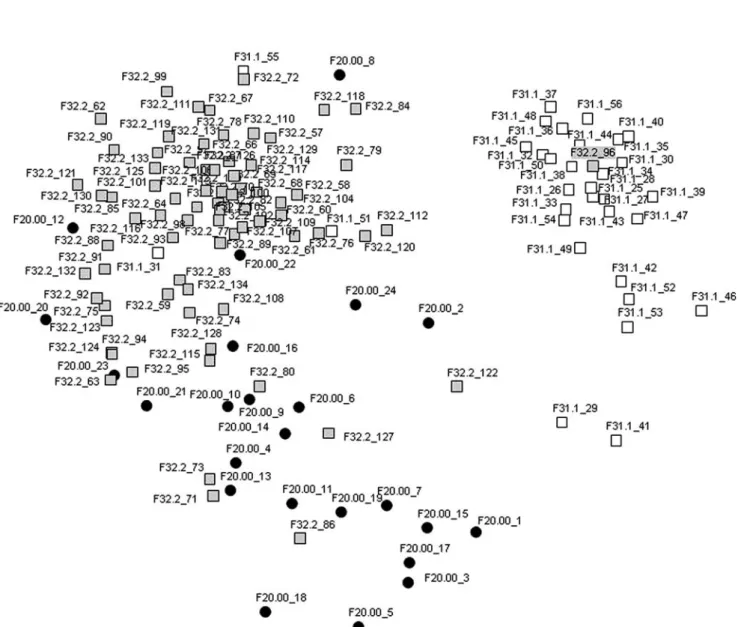
A scree test [11], adopted for multidimensional scal-ing by Kruskal and Wish [32], showed no substantial diminution of the standardized stress values in higher than two-dimensional spaces, which is why the two-dimensional solution was chosen. The stress value is a measure that expresses the extent of the misrepresentations of the proximities in relation to their representations as distances depicted in the n-dimensional NMDS solution. This solution, i.e. the map of the patients, is presented in Fig.1. According to the literature [8] and the more conservative limits of our own research group, the stress value of 0.22 speaks for a good interpretability of the map. The cases diagnosed with schizophrenia (F20.00) are depicted as black circles, the cases diagnosed with bipolar affective disorder, current episode manic without psychotic symptoms (F31.1) as white squares and the cases diagnosed with severe depressive epi-sode without psychotic symptoms (F32.2) as grey squares. The closer two representations of patients are (i.e. circles or squares), the more similar their symptomatology, i.e. the larger the covariance of their symptom profiles, which was expressed as a high Spearman correlation coefficient. The diagnoses were matched with the cases only after the map was cal-culated based on the symptom profiles. In the map, three major clusters are evident: One ‘‘depressive’’ cluster in the upper left corner, one ‘‘manic’’ cluster in the upper right corner and one less clearly separated ‘‘schizophrenic’’ cluster at the bottom middle. Some cases can be observed as lying between or at the borders of the clusters, such as F32.2_112 and F32.2_120 at the border of the depressive and oriented towards the manic cluster, F31.1_29 and F31.1_41 between the manic and schizophrenic clusters, or F20.00_9 and F32.2_80 between the schizophrenic and depressive clusters. Furthermore, some cases seem to be misplaced and emerge in clusters where they do not seem to belong: the manic cases F31.1_31 and F31.1_55 and the schizophrenic cases F20.00_8, F20.00_12, F20.00_20, and F20.00_22 in the depressive cluster, the depressive case F32.2_96 in the manic cluster and the depressive case F32.2_86 in the schizophrenic cluster. Some of these cases lying at the intersections and in the ‘‘wrong’’ clusters are described and interpreted in detail as examples in the discussion section. To clarify which symptoms were associated with which diagnostic entity, the ICD-10 criteria for research [15] were consulted: Based on the diagnostic criteria, the corresponding AMDP
symp-toms were determined. This resulted in a group of symptoms that were associated with schizophrenia, a group of symptoms that were associated with depression, and a group of symptoms that were associated with mania. Hence, it was possible to ex-press for each patient the percentage of symptoms actually exhibited in relation to all potentially ob-servable symptoms within a diagnostic entity (e.g. a given manic case might exhibit 50% schizo-phrenic, 50% manic, and 0% depressive symptoms). Of course, this approach is a simplification, since there are symptoms that can be attributed to more than one diagnostic entity at the same time. Here, only the symptoms that could be attributed unam-biguously to a diagnostic entity were considered.
It should be mentioned in this regard that the pro-cedure mainly served as a rough indication of the appropriateness of the position of the patients in the map based on their symptom characteristics in rela-tion to the diagnostic clusters.
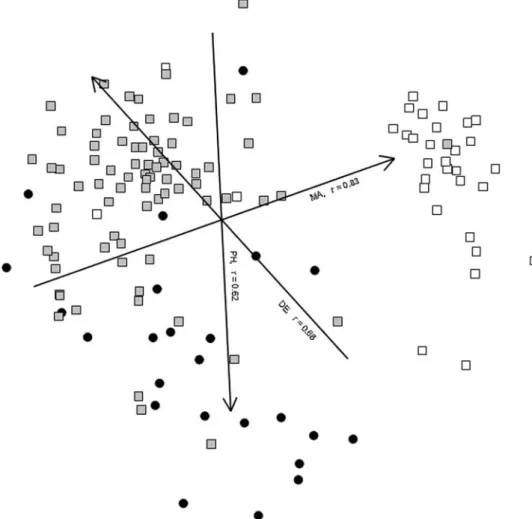
In Fig. 2, the same patient map is presented as in Fig. 1, but this time including the AMDP symptom score dimensions. Since they were fitted into the map by multiple regressions, the expectations for the regression values were higher, which is why only the dimensions exhibiting an r ‡ 0.60 are depicted in the map. Consequently, three dimensions are shown, the dimension based on the AMDP sum scores for the manic syndrome (MA, r = 0.83), the dimension based on the AMDP sum scores for the depressive syndrome
Fig. 1 Map of patients including the cases diagnosed with schizophrenia (F20.00 black circles), bipolar affective disorder, current episode manic without psychotic symptoms (F31.1 white squares) and severe depressive episode with-out psychotic symptoms (F32.2 grey squares). Stress value = 0.22. The labels
next to the dots and squares, representing the positions of the patients, denote the ICD-10 diagnostic F-codes (before the underscore) and the patient IDs (after the underscore)
(DE, r = 0.68), and the dimension based on the AMDP sum scores for the paranoid-hallucinatory syndrome (PH, r = 0.62). The closer an orthogonal projection of a patient is located on a given dimension, the larger the sum score of this patient on the corresponding AMDP syndrome scale. The dimensions intersect in the center of gravity of the configuration.
Discussion
Figure1 depicts the map of the patients, which was calculated based on the similarity of their AMDP symptom profiles. At first glance, it is evident that the map is constituted by three main cluster structures. In the upper right corner, the mania cluster is the one that is most clearly separated from the other two clusters. The depression cluster in the upper left is still quite clearly confined, but shows a clearer ten-dency to scatter in the direction of the schizophrenia cluster, which is located at the bottom middle. This cluster can still be identified as being separate from the other two, but shows a strong tendency to blend with the depression cluster. Looking at the arrange-ment of the diagnostic clusters, it has to be kept in mind that the map was calculated based only on the correlations of the symptom profiles without any
diagnostic information. Only after the positions of the cases had been determined were the diagnoses ap-plied. Against this background, it can be concluded that these three diagnostic entities can be clearly separated from each other only based on their psy-chopathological symptomatology. The separation of the depressive and the manic cluster given by their positions at the opposed poles of the affective con-tinuum e.g. [23] is clearly reflected in this map. The gap without any cases between these clusters indicates that although the diagnostic entities lie on a contin-uum, the cases lying at the poles can be separated from each other in a categorical sense. It can be ex-pected that the continuum would have emerged more prominently if we would have chosen patients with a diagnosis of bipolar disorder with hypomanic epi-sodes instead of manic epiepi-sodes cf. [5]. Blashfield [7] had already mentioned that clearly delimited clusters and zones of rarity between the clusters can be interpreted as an indicator for a categorical classifi-cation and vice versa. In light of this statement, the depressive and schizophrenic clusters do not seem to be as clearly separated from each other as the depressive and manic clusters. In the former case, no clear-cut gap between the clusters can be observed.
The area between the depressive and the schizo-phrenic clusters could indeed be described as a ‘‘zone
Fig. 2 Identical map of patients to Fig.1, additionally including the symptom score dimensions (MA manic syndrome, r = 0.83; DE depressive syndrome, r = 0.68; PH paranoid-hallucinatory syndrome, r = 0.62)
of rarity’’, but there are a number of cases that are located in the intersection. Such observations are reflected in the research literature as findings reporting that these diagnostic categories cannot be separated neatly [28], that no substantial discontinu-ity was apparent [42], or even that a separate depressive dimension could be identified in schizo-phrenic patients [9]. A closer look at the cases in the schizophrenic-depressive intersection reveals that these patients exhibit pronounced depressive as well as schizophrenic symptoms. For instance, the depressive case F32.2_80 exhibits 57% depressive symptoms of the total symptom score obtained on either depressive, schizophrenic or manic symptoms, and 24% schizophrenic symptoms (and 19% manic symptoms). Case F20.00_9 exhibits 54% schizo-phrenic, 36% depressive and 11% manic symptoms. Of course, the covariance of other symptoms not in-cluded in these three groups (manic, depressive, schizophrenic) also contributed to the position of these cases. Nevertheless, this examination of the percentage sum scores illustrates that although these patients show a prevalence of their symptoms in the diagnostic entities in which they are diagnosed, they also exhibit a significant amount of symptoms of the other diagnostic entity, which is well reflected in their position between the diagnostic clusters in the map. Another illustrative example to highlight this obser-vation is case F32.2_112, with 50% depressive and 50% manic symptoms, which is located at the border of the depressive cluster oriented towards the manic cluster. The cases F20.00_12, F31.1_31 and F32.2_96 illustrate that their position within another diagnostic cluster is not so ‘‘wrong’’ if one takes a closer look at their symptom profile. F20.00_12 exhibits 89% depressive and only 11% schizophrenic symptoms, F31.1_31 exhibits 72% depressive, 11% schizophrenic and 17% manic symptoms, and case F32.2_96 exhibits 6% depressive, 78% manic and 17% schizophrenic symptoms. It is evident that based on the symptom characteristics these cases are not misplaced but are rather misdiagnosed (at least with regard to the pre-dominant symptomatology). A cross-check with the patient charts corroborated this conclusion. These few singled-out examples clarify some of the main advantages of these maps: In the continuous NMDS maps, cases can be located in differentiated distances to each other and do not have to be separated into one categorical pigeonhole or another, where no in-between exists. This shortcoming of the current classification systems is one of the reasons why an increasing number of diagnostic categories keep being introduced. In turn, this results (among other consequences) in the prominent problem of numer-ous diagnostic co-occurrences, i.e. comorbid diagno-ses [19, 24]. The integration of the categorical and the dimensional perspective by depicting categorical aspects as separated clusters in a continuous or dimensional space allows a statement to be made about
the membership of a given patient to a diagnostic entity, without sacrificing the illustration of a variable strength of association with multiple entities. This is quite sim-ilar to a grade of membership approach, where the grade of membership score describes the degree of an indi-vidual’s belonging to an empirically derived prototype. Also similar to this approach, if there is a substantial number of patients exhibiting a similar symptom profile, an NMDS allows new (not a priori specified) diagnostic entities to be discovered (such a diagnostic entity would emerge in a map as a ‘‘neighborhood’’ of patients exhibiting a similar symptom profile).
The possibility of interpreting the positions of specific cases lying at the boarders of diagnostic clusters or in between clusters with regard to their symptom characteristics already highlights the power of this method in terms of dimensional aspects. This advantage is even more pronounced by the integration of the syndrome dimensions in the map of the patients presented in Fig.2. All AMDP syndromes (paranoid-hallucinatory, depressive, psychoorganic, manic, hostility, autonomic, apathy, obsessive-compulsive, neurological) identified by Baumann and Stieglitz [4] were included in the multiple regressions, but only the ones with an r ‡ 0.60 were depicted in the map. As one would expect, especially the three dimensions based on the symptom scores of the manic, the depressive, and the paranoid-hallucinatory syndromes showed such substantially high regression values in this map of manic, depressive and schizophrenic patients. The directions of the dimensions indicate that cases with a more severe, i.e. a higher, symptom score of a syn-drome are located in the clusters of the corresponding diagnostic categories. The larger an angle between two given dimensions, the more independent the dimen-sions are from each other. Keeping this in mind, the above-mentioned stronger separation of the manic cluster from the other two clusters becomes apparent again. The rather acute angle between the depressive and the paranoid-hallucinatory dimensions, i.e. syn-dromes, indicates that these syndromes are not inde-pendent with regard to the diagnostic groups of patients with depression and schizophrenia.
As indicated in the introduction, current research on the classification of the mental disorders calls for methods that facilitate the integration of dimensional aspects in classification systems in general [30,37,44] and in the field of mood and psychotic disorders in particular [42]. Taking together the arguments men-tioned above, the method presented here might offer an interesting perspective for such integration. An-other advantage of this robust approach can be seen in the ability to consider the whole spectrum of symp-toms without having to rely on a priori assumptions in terms of reducing or weighing any symptoms. Thus, the whole symptomatology of a patient can be included and the relations to all other cases in the sample can be analyzed and depicted. In the resulting map, every patient can be located and is not lost within
a group score of a sub-sample. As demonstrated above, this allows misdiagnoses in terms of symp-tomatology to be identified at just one glance.
This paper illustrated a method to depict patients in a map according to the similarity of their psycho-pathological symptom profiles and highlighted some of the advantages of such an approach. Of course, the localization of the patients is restricted to their symptomatology, but since clinical symptoms con-stitute a predominant proportion of the criteria of the major current classification systems, these maps might be of considerable value for researchers as well as clinicians in order to gain a quick overview of their patients. The focus on the symptomatology and the depiction of the individuals in relation to each other can also be seen as a step in the direction of the re-cently claimed re-emphasis [1] on phenomenological aspects and the singularity of an individual patient.
The presented study is the first of its kind, so limi-tations are to be seen in the following aspects: Based on the current selection of diagnostic groups and without further research, we can not be sure that the separation will achieve comparable optimal results in other diag-nostic areas. Additionally, the AMDP does not differ-entiate at the same level of detail in all areas of psychopathology. Therefore, this statistical analysis should also be applied to other diagnostic rating scales. Finally, the validity of the data set is strongly depend-ing on the quality of the clinical ratdepend-ings. The latter aspect sounds trivial but has to be taken into account: Especially when time resources are limited and hours spent for diagnosis are not available for treatment any longer, ways are to be found to improve the motivation for sound and correct application of diagnostic man-uals. Immediate feedback of the diagnosis resulting from the just performed manual could be intuitively provided by maps like the one presented in this paper, simply by adding a point for the current patient at the resulting position. Such immediate feedback could help to improve data quality and, at the same time, support the diagnostic process. However, as men-tioned above, this would require a system of maps covering all fields of psychopathology so that the pre-sented study can only be seen as the first and initial step towards an ‘‘AMDP based atlas of mental disorders’’.
j Acknowledgments This study was supported by a grant from
the Swiss National Science Foundation (fellowship, project no. 117011).
References
1. Andreasen NC (2007) DSM and the death of phenomenology in America: an example of unintended consequences. Schizophr Bull 33:108–112
2. Arbeitsgemeinschaft fu¨r Methodik und Dokumentation in der Psychiatrie (1981) Das AMDP-System. Manual zur Dokumen-tation psychiatrischer Befunde. Springer, Berlin
3. Baumann U, Stieglitz RD (1997) Das AMDP-system: ein psy-chologischer test? In: Haug H-J, Stieglitz RD (Hrsg.) Das AMDP-system in der klinischen Anwendung und Forschung. Hogrefe, Go¨ttingen, S 30–45
4. Baumann U, Stieglitz RD (1983) Testmanual zum AMDP-Sys-tem: Empirische Studien zur Psychopathologie. Springer, Berlin 5. Benazzi F (2006) The continuum/spectrum concept of mood disorders: is mixed depression the basic link? Eur Arch Psy-chiatry Clin Neurosci 256:512–515
6. Berner P (1983) Diagnostic classification based on the AMDP-system. In: Bobon D, Baumann U, Angst J, Helmchen H, Hippius H (eds) The AMDP-system in pharmacopsychiatry. Karger, Basel, pp 68–73
7. Blashfield RK (1990) Comorbidity and classification. In: Maser JD, Cloninger CR (eds) Comorbidity of mood and anxiety disorders. American Psychiatric Press, Washington, DC, pp 61– 82
8. Borg I, Groenen P (2005) Modern multidimensional scal-ing—theory and applications. Springer, New York
9. Bottlender R, Strauss A, Mo¨ller HJ (2000) Prevalence and background factors of depression in first admitted schizo-phrenic patients. Acta Psychiatr Scand 101:153–160
10. Brown TA, Barlow DH (2005) Dimensional versus categorical classification of mental disorders in the fifth edition of the diagnostic and statistical manual of mental disorders and be-yond: comment on the special section. J Abnorm Psychol 114:551–556
11. Cattell RB (1966) The scree test for the number of factors. Multivariate Behav Res 1:245–276
12. Cuesta MJ, Peralta V (2001) Integrating psychopathological dimensions in functional psychoses: a hierarchical approach. Schizophr Res 52:215–229
13. Cuesta MJ, Peralta V, Zarzuela A (2000) Reappraising insight in psychosis: multi-scale longitudinal study. Br J Psychiatry 177:233–240
14. De Boeck P, Wilson M, Acton GS (2005) A conceptual and psychometric framework for distinguishing categories and dimensions. Psychol Rev 112:129–158
15. Dilling H, Mombour W, Schmidt MH, Schulte-Markwort E (2004) Internationale Klassifikation psychischer Sto¨rungen ICD-10 Kapitel V (F) Diagnostische Kriterien fu¨r Forschung und Praxis. World Health Organization, Genf
16. Dragovic M, Hammond G, Badcock JC, Jablensky A (2005) Laterality phenotypes in patients with schizophrenia, their siblings and controls: associations with clinical and cognitive variables. Br J Psychiatry 187:221–228
17. Egli S, Schlatter K, Streule R, La¨ge D (2006) A structure-based expert model of the ICD-10 mental disorders. Psychopathology 39:1–9
18. Egli S, Streule R, La¨ge D (2008) The structure-based expert model of the mental disorders: a validation study. Psycho-pathology 41:286–293
19. First MB (2005) Mutually exclusive versus co-occurring diag-nostic categories: the challenge of diagdiag-nostic comorbidity. Psychopathology 38:206–210
20. Gower JC, Legendre P (1986) Metric and euclidean properties of dissimilarity coefficients. J Classif 3:5–48
21. Guy GW, Ban TA (1982) The AMDP system: manual for the assessment and documentation of psychopathology. Springer, Berlin
22. Haslam N (2003) Categorical versus dimensional models of mental disorder: the taxometric evidence. Aust NZ J Psychiatry 37:696–704
23. Haug HJ, Ahrens B (2002) Affektive Sto¨rungen. In: Freyberger HJ, Schneider W, Stieglitz R-D (Hrsg.) Kompendium Psychi-atrie, Psychotherapie, psychosomatische Medizin. Karger, Basel, S 100–118
24. Jablensky A (2005) Boundaries of mental disorders. Curr Opin Psychiatry 18:653–658
25. Jablensky A (2005) Categories, dimensions and prototypes: critical issues for psychiatric classification. Psychopathology 38:201–205
26. Ja¨ger M, Bottlender R, Strauss A, Mo¨ller HJ (2004) Fifteen-year follow-up of ICD-10 schizoaffective disorders compared with schizophrenia and affective disorders. Acta Psychiatr Scand 109:30–37
27. Jaspers K (1997) General psychopathology (1913). Johns Hop-kins University Press, Baltimore
28. Kempf L, Hussain N, Potash JB (2005) Mood disorder with psychotic features, schizoaffective disorder, and schizophrenia with mood features: trouble at the borders. Int Rev Psychiatry 17:9–19
29. Kendell R, Jablensky A (2003) Distinguishing between the validity and utility of psychiatric diagnoses. Am J Psychiatry 160:4–12
30. Kraemer HC (2007) DSM categories and dimensions in clinical and research contexts. Int J Methods Psychiatr Res 16:S8–S15 31. Kraemer HC, Noda A, O’Hara R (2004) Categorical versus
dimensional approaches to diagnosis: methodological chal-lenges. J Psychiatr Res 38:17–25
32. Kruskal JB, Wish M (1978) Multidimensional scaling. Sage Publications, Beverly Hills
33. La¨ge D, Daub S, Bosia L, Ja¨ger C, Ryf S (2005). Die Behandlung ausreißerbehafteter Datensa¨tze in der Nonmetrischen Multidi-mensionalen Skalierung—Relevanz, Problemanalyse und Lo¨sungsvorschlag (Forschungsberichte aus der Angewandten Kognitionspsychologie Nr. 21). Universita¨t Zu¨rich, Psycholog-isches Institut
34. La¨ge D, Egli S, Mo¨ller HJ, Strauss A, Riedel M (2008) Exploring the structure of psychopathological symptoms—a re-analysis of AMDP data by robust nonmetric multidimensional scaling. Manuscript submitted for publication
35. Lauterbach E, Rumpf HJ, Ahrens B, Haug HJ, Schaub R, Schonell H, Stieglitz RD, Hohagen F (2005) Assessing dimen-sional and categorical aspects of depression: validation of the AMDP depression scale. Eur Arch Psychiatry Clin Neurosci 255:15–19
36. Lecrubier Y (2008) Refinement of diagnosis and disease clas-sification in psychiatry. Eur Arch Psychiatry Clin Neurosci 258(Suppl 1):6–11
37. Lopez MF, Compton WM, Grant BF, Breiling JP (2007) Dimensional approaches in diagnostic classification: a critical appraisal. Int J Methods Psychiatr Res 16(Suppl 1):S6–S7 38. Manton KG, Korten A, Woodbury MA, Anker M, Jablensky A
(1994) Symptom profiles of psychiatric disorders based on graded disease classes: an illustration using data from the WHO international pilot study of schizophrenia. Psychol Med 24:133–144
39. Maser JD, Cloninger CR (1990) Comorbidity of anxiety and mood disorders: introduction and overview. In: Maser JD, Cloninger CR (eds) Comorbidity of mood and anxiety disor-ders. American Psychiatric Press, Washington, DC, pp 3–12 40. Overall JE, Woodward JA (1975) Conceptual validity of a
phenomenological classification of psychiatric patients. J Psy-chiatr Res 12:215–230
41. Peralta V, Cuesta MJ (2007) A dimensional and categorical architecture for the classification of psychotic disorders. World Psychiatry 6:36–37
42. Peralta V, Cuesta MJ (2007) Exploring the borders of the schizoaffective spectrum: a categorical and dimensional approach. J Affect Disord (in press)
43. Pickles A, Angold A (2003) Natural categories or fundamental dimensions: on carving nature at the joints and the rearticu-lation of psychopathology. Dev Psychopathol 15:529–551 44. Regier DA (2007) Dimensional approaches to psychiatric
clas-sification: refining the research agenda for DSM-V: an intro-duction. Int J Methods Psychiatr Res 16:S1–S5
45. Salvatore P, Khalsa HMK, Hennen J, Tohen M, Yurgelun-Todd D, Casolari F, DePanfilis C, Maggini C, Baldessarini RJ (2007) Psychopathology factors in first-episode affective and non-affective psychotic disorders. J Psychiatr Res 41:724–736 46. Sato T, Bottlender R, Kleindienst N, Mo¨ller HJ (2002)
Syn-dromes and phenomenological subtypes underlying acute mania: a factor analytic study of 576 manic patients. Am J Psychiatry 159:968–974
47. Schneider K (1959) Clinical psychopathology. Grune and Stratton, New York
48. Watson D (2005) Rethinking the mood and anxiety disorders: a quantitative hierarchical model for DSM-V. J Abnorm Psychol 114:522–536
49. Widiger TA, Samuel DB (2005) Diagnostic categories or dimensions? A question for the diagnostic and statistical manual of mental disorders—fifth edition. J Abnorm Psychol 114:494–504
50. Woodbury MA, Clive J, Garson A Jr (1978) Mathematical typology: a grade of membership technique for obtaining dis-ease definition. Comput Biomed Res 11:277–298
51. Woodbury MA, Manton KG (1982) A new procedure for analysis of medical classification. Methods Inf Med 21:210–220