A Comparison of Hemodynamic and Neural
Responses in Cat Visual Cortex Using
Complex Stimuli
Christoph Kayser1, Mina Kim2, Kamil Ugurbil2, Dae-Shik Kim2 and Peter König1
1Institute of Neuroinformatics, University & ETH Zurich, 8057 Zurich, Switzerland and 2Center for Magnetic Resonance Research, University of Minneapolis, Minneapolis, MN 55455, USA
We compare fMRI-BOLD responses in anesthetized cats with local field potentials (LFPs), aggregate high-frequency responses (analog-Mua) and spiking activity recorded in primary and higher visual cortex of alert animals. The similarity of the activations in these elec-trophysiological signals to those in the BOLD is quantified by counting recording sites where different stimuli elicit the same rela-tive activation as in the imaging experiments. Using artificial stimuli, a comparison of BOLD and LFP strongly depends on the frequency range used. Stimulating with complex or natural stimuli reduces this frequency dependence and yields a good match of LFP and BOLD. In general, this match is best between 20 and 50 Hz. The measures of high-frequency activity behave qualitatively different: the responses of the analog-Mua match those of the LFP; the spiking activity shows a low concordance with the BOLD signal. This dissociation of BOLD and spiking activity is most prominent upon stimulation with natural stimuli.
Keywords: BOLD, firing rate, local field potential, natural stimuli, V1, area 21
Introduction
Current neuroscience employs a number of different methods to study brain function. On the one hand, there is a growing body of research using functional magnetic resonance imaging (fMRI), especially the blood oxygenation level-dependent (BOLD) contrast (Bandettini et al., 1992; Kwong et al., 1992; Ogawa et al., 1992). On the other hand, there exists a large body of results accumulated over the last decades using electrophysiological methods, ranging from extra cranial surface recordings to recordings of action potentials of isolated neurons. Ultimately, these two lines of research should converge to form a coherent understanding of the neuronal basis of sensory processing. However, for a number of reasons, a comparison of results obtained with these different methods is still difficult and the direct relation of activities measured by electrophysiological methods and fMRI is still debated (cf. reviews in J Neurosci 23, 2003, pp. 3959–4011).
First, the different methods are often used in conjunction with subjects from different species. Due to its non-invasive nature, fMRI dominates studies with human subjects while electrophysiology dominates research conducted with animals. Furthermore, given the technical difficulties of simul-taneously recording electrical activity and fMRI, usually only one of the two methods is used in a single subject and thus in the whole study (but see below). Classical model systems of sensory processing such as the visual system of cats and monkeys have only recently been studied using fMRI (Logo-thetis et al., 1999; Kim et al., 2000; Duong et al., 2001; Rainer et al., 2001).
Second, the stimuli used in an experiment are usually either specific to the question at hand or are tailored to yield strong responses with the particular method applied. Single unit recordings in the primary visual cortex, for example, often stimulate with gratings whose properties are optimized to elicit strong responses of the neuron recorded. Only few studies exist that allow comparing results obtained using fMRI and electrophysiology with the same stimulation paradigm. Furthermore, as a result of tailoring the stimuli, most studies use stimuli that have a completely different structure than the every day input processed by the system under investigation. However, recent results indicate that sensory processing is adapted to natural stimuli and that results obtained using artifi-cial stimuli might not directly generalize to the processing of every day stimuli (Creutzfeldt and Nothdurft, 1978; Dan et al., 1996; Baddeley et al., 1997; Vinje and Gallant, 2001, 2002; Smyth et al., 2003; Weliky et al., 2003). Little is known about the relation between results from fMRI and electrophysiology upon stimulation with natural stimuli, and whether the relation depends on the type of stimulus used.
Only recently, a number of studies brought progress to a comparison of fMRI and electrophysiology. For example, combinations of fMRI with both simultaneous and separately recorded electroencephalographic signals in humans and animals (Menon et al., 1997; Bonmassar et al., 1999; Brinker et al., 1999; Ogawa et al., 2000) showed qualitative and quantita-tive agreement between these two methods. Recording a direct measure of neuronal activity, the firing rate of individual cells, another group of studies compared spiking activity and BOLD signals in the visual system. Two studies recorded firing rates of neurons in the motion selective area MT of monkeys and BOLD responses from the MT homologue in humans. Heeger and coworkers (Heeger et al., 1999) found similar levels of motion opponency in both experiments, indicating a qualitative agreement. Changing the coherence of stimulus motion in a parameterized way, Rees and colleagues (Rees et al., 2000) found that BOLD and firing rates were directly proportional. A similar result was obtained in a different experiment comparing contrast response curves of BOLD and spikes in the primary visual cortex (Heeger et al., 2000). Summarizing, these studies suggest that the BOLD signal is a good representative of spiking activity and that fMRI can be used to infer properties of spiking activity in a non-invasive manner.
However, there is increasing evidence that the match of fMRI and spiking activity might not hold in general and that other measures of neuronal activity than firing rates might better correspond to the BOLD signal. Evidence for this comes from simultaneous recordings of local field potentials (LFPs), multi-unit activity and BOLD signals in the primary visual
cortex of anesthetized monkeys (Logothetis et al., 2001). In general, both the LFPs and the spiking activity correlated with the changes in the BOLD signal. At many recording sites, however, the LFP correlated slightly better with the hemo-dynamic response. An even stronger dissociation between spiking activity and hemodynamic responses was demon-strated in the rat cerebellar cortex (Mathiesen et al., 1998, 2000). Using different stimulation paradigms, these authors demonstrated a correlated increase of LFPs and cerebral blood flow in the absence of spiking activity. Given that LFPs measure local subthreshold potentials in dendrites and somata (Mitzdorf, 1985, 1987; Juergens et al., 1999), these studies suggest that the fMRI signal represents more the input to a local region of the brain than the spiking activity within this region (Logothetis, 2003).
In the present study, we compare fMRI-BOLD activations with three electrophysiological measures of neuronal activity in the visual system of the cat for a set of stimuli with different global structure. More specifically, BOLD responses in the primary and higher visual areas of anesthetized cats to gratings, natural movies and noise patterns were measured. Using the same set of stimuli, LFPs over a wide range of frequencies, aggregate high frequency activity (analog-Mua) and spiking activity were recorded in alert animals. We ask how well these three measures of neuronal activity correspond to the BOLD signal. First, the magnitudes of the stimulus driven responses in each of the four signals are compared. Second, we obtain rela-tions between the activarela-tions elicited by the different stimuli in the fMRI experiments. We then calculate the number of recording sites in the physiology experiments at which the relative activity for the different stimuli obeys the same rela-tions. This is done separately for different frequencies and frequency ranges of the LFP, the analog-Mua and the spiking activity.
Materials and Methods
Visual Stimuli
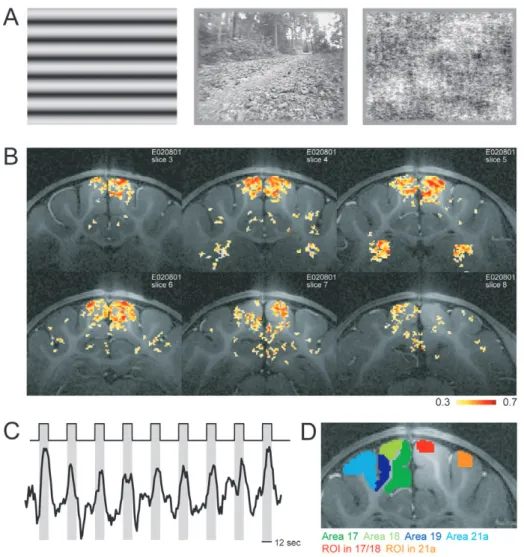
Given that stimuli with different global structure, such as drifting grat-ings and complex noise patterns, can elicit markedly different activity patterns (Lehky et al., 1992; Reid et al., 1992; Kruse and Eckhorn, 1996; Baddeley et al., 1997), and given that a comparison of electro-physiology and fMRI might depend on the stimulus used, we chose the following set of stimuli to compare these two methods (Fig. 1A).
Sinewave Gratings
The drifting sinewave gratings had a spatial frequency of 0.2 cycles/ degree and a temporal frequency of 4 Hz. These frequency parameters are in a range yielding strong activations in the primary visual areas (Movshon et al., 1978). The orientation of the grating was chosen randomly at each presentation from one of three equally spaced orientations (0°, 60°, 120°). Each presentation of the grating included both directions of drift perpendicular to the orientation of the grating.
Natural Movies
These movie clips were recorded from a camera mounted to a cat’s head while the animal was exploring different environments such as forests and meadows. These videos incorporate the specific body and head movements of a cat and are an approximation to the natural visual input of the cat (for details see Kayser et al., 2003a). In total three such movie clips were used.
Pink Pixel Noise
For each natural movie a stimulus was created which has the same second order correlations of pixel intensities but random higher order structure. These stimuli were constructed by computing the
space–time Fourier transform over all movie frames and replacing the phase at each frequency by a random value between 0 and 2π. The inverse Fourier transform was applied to obtain the new stimulus. These movie clips have the same spatio-temporal frequency contrast as the original movies but lack the higher order structure that leads to (moving) objects in the original movies. In total three pixel noise stimuli were used, each constructed from one of the three natural movies.
fMRI — Animal Preparation
The fMRI experiments were conducted on anesthetized and paralyzed cats. For preparation the animals were anesthetized with ketamine (20 mg/kg, Phoenix Inc., St Joseph, MO) and xylazine (1.1 mg/kg, Phoenix Inc.). They were orally intubated and ventilated with O2 and
N2O (3:7). During the experiment they were continuously
anes-thetized with 0.8–1.3% isoflurane and paralyzed with pancronium (0.4 mg/kg per h). The eyes were dilated with atropin sulfate, and phenylepherine hydrochloride was applied to retract the nictitating membranes and paralyze accommodation. The eyes were fit with appropriate contact lenses to focus the stimulus onto the retina. The animals were placed in a custom build stereotaxic frame made out of Plexiglas, which allows accurate positioning within the magnet. Endtidal CO2 and body temperature were monitored continuously
and kept in the desired range (3.5–4%, 37–38°C, respectively). All procedures were approved by the Institutional Animal Care and Use Committee (IACUC).
fMRI — Data Acquisition
Experiments were performed on a 9.4 Tesla horizontal magnet (Magnex, Yarnton, UK) with a 31 cm bore and equipped with a unity INOVA console (Varian, Mountain View, CA) and a 30 Gauss/cm magnetic field gradient insert (ID = 11 cm, 300 µs rise time, Magnex). A quadrature surface coil (4 cm diameter) was used and attached to the stereotaxic frame. In each session both functional and anatomical data were acquired. Functional data were acquired using a gradient-echo Echo-Planar Imaging (GE-EPI) sequence (TR = 150 ms, TE = 15
ms), 13 coronal slices (2 mm thickness) and a native resolution of 64 × 64 voxels on a field of view of 3 × 3 cm. For analysis, the slices were zero padded to a size of 128 × 128 voxels yielding a nominal resolution of 230 × 230 µm. The anatomical data were obtained using a Turbo-FLASH multi-slice sequence. The visual stimuli were rear projected onto a screen (10 cm diameter) 8 cm in front of the animal. The stim-ulus presentation was controlled using custom written software based on the psychophysics toolbox extensions (Brainard, 1997; Pelli, 1997) and triggered from the MR scanner. Stimuli were shown in a block design with each block containing three repeats of each stimulus in a pseudorandom order. Each stimulus lasted 12 s and the stimuli were separated by a uniform gray screen of the same mean luminance as the stimuli but lasting 24 s. In each block one of the three natural movie clips, the corresponding pixel noise and one of the three orien-tations of the grating were used. For each animal we acquired func-tional data from at least nine stimulation blocks.
fMRI — Regions of Interest (ROI)
The ROIs were chosen based on the anatomical scans. These were manually aligned with the functional data correcting for the different field of views and pixel resolutions. Two sets of ROIs were used in the present study. First, ROIs containing regions similar to those from which the electrophysiological data were obtained: the representa-tion of the central visual field in areas 17/18 on the posterior lateral gyrus and in area 21a on the suprasylvian gyrus. Thus one ROI was defined as the region on the posterior lateral gyrus in two consecutive slices with similar Horsley–Clarke coordinates as in the electro-physiology recordings. Similar, a second ROI was defined as the region on the suprasylvian gyrus in two consecutive slices. The second set of ROIs consisted of the entire visual areas 17, 18, 19 and 21a, and thus comprised the first set of ROIs. These visual areas were identified on the anatomy scans using standard literature (Palmer et
al., 1978; Tusa et al., 1978, 1979; Tusa and Palmer, 1980). For each
animal all ROIs were defined on both hemispheres. Examples of the ROIs are shown in Figure 1.
fMRI — Data Analysis
Functional data were analyzed using Matlab (Mathworks Inc., Natick, MA, USA). First, the time series of each voxel was preprocessed: data points from the first 6 s of the time series were discarded to avoid tran-sient effects of magnetic saturation and possible linear trends were removed. Functional activations were determined for each region of interest either using all voxels within the ROI or using only a subset of
active voxels. These active voxels were determined using a correlation
analysis. The correlation of the time series with a boxcar function representing the stimulus paradigm was computed. This boxcar func-tion was shifted according to the hemodynamic delay, which was esti-mated for each animal separately. This correlation map was thresholded at a correlation value of 0.25 and a cluster criterion elim-inating voxels with less than four neighbors exceeding this threshold was applied. As a control correlation thresholds of 0.1 and 0 were used as well.
The response to a particular stimulus was computed as the average per cent change in the BOLD signal between stimulus and blank screen. For a given voxel and stimulus this number was computed by averaging the time series of the three presentations of this stimulus within a block and computing the per cent change of the signal between stimulus and blank screen. The signal value during the blank was defined as the average of two windows, one before the stimulus (11 till 2 s before stimulus onset) and one after stimulus offset (10 till 19 s after stimulus offset). The value during the stimulus presentation was defined as the average of a 9 s window starting 3 s after stimulus onset. Finally, the response within an ROI was defined as the average of the per cent change of either all voxels or all active voxels within this area. From the data of each stimulus block one activity value for each ROI and stimulus was obtained. The average activity for each animal and stimulus was then computed as the average across stimula-tion blocks.
Electrophysiology — Recording Sites
Electrophysiological signals were recorded in five alert cats using chronically implanted electrodes (for details of implantation see Kayser et al., 2003b). In each animal a small microdrive containing four bundles of movable electrodes was implanted. Two bundles were placed over areas 17/18 and two over area 21a at locations of the central visual representation. In detail, the two bundles in areas 17/18 were implanted at stereotaxic coordinates P: –3, L: +2 and L: +4; the two bundles in area 21a were implanted at P: –3, L +7 and L +9. Recordings were performed along these four penetrations at sites of different depths in supra granular, granular and infra-granular layers. We did not systematically study the receptive field location of the different recording sites but they were well within the central 5° of the visual field. Furthermore, measurements of spatial frequency tuning, carried out for a subset of the recording sites, showed that the spatial frequency chosen for the grating stimulus was close to optimal for these sites. Given that the penetrations were roughly orthogonal, receptive field location and spatial frequency should not vary dramat-ically between sites along each penetration (Hubel and Wiesel, 1962). Using standard histological techniques, we verified in three animals that the electrodes were positioned in the desired locations of the visual areas and that the electrode tracks passed through all cortical layers.
Electrophysiology — Recording Procedures
For recording the animals were restrained and their head was fixed to allow a stable visual stimulation. The stimuli were identical to those in the fMRI experiments and presented in a pseudo-random block design together with other stimuli not reported here. Stimuli were presented on a 19-inch Monitor (Hitachi, 120 Hz refresh rate, placed 50 cm from the animal) and lasted 2 s. Consecutive stimuli were separated by blank screens of the same length. During a recording session each stimulus was presented ∼40 times. Broadband signals between 5 and 5000 Hz were recorded using a 24-Channel preamplifier (Neurotrack) and finally amplified and digitized at 20 000 Hz using a Synamp system (Neuroscan, El Paso, TX, USA). Further details of the recording procedures are reported elsewhere (Kayser et al., 2003b). All procedures were in accordance with the national guidelines for use of
experimental animals and conformed to the National Institutes of Health and Society for Neuroscience (US) regulations.
Electrophysiology — Data Analysis
Three measures of neuronal activity were extracted from the recorded broadband signals: LFPs, a measure of aggregate high-frequency activity (analog-Mua) and spiking activity. The activity in the LFP was obtained by low-pass filtering the recorded signals below 500 Hz and applying a time localized Fourier analysis (spectrogram). The Fourier amplitudes were computed for windows of 160 ms length overlaid with a Hanning window, zero-padded to 256 ms and using an overlap of neighboring windows of 152 ms; leading to a nominal temporal resolution of 8 ms. To isolate stimulus locked changes in power, the spectrogram was normalized: the per cent change of the power at each frequency was computed with respect to a window during the blank preceding the stimulus (from 800 to 100 ms before stimulus onset). From each spectrogram a modulation curve characterizing the average activity at different frequencies was computed: the normal-ized spectrogram was averaged over a window starting 200 ms after stimulus onset till stimulus offset.
The analog-Mua was extracted by high-pass filtering the recorded signal above 500 Hz, rectifying and low-pass filtering at 200 Hz. Similar as for the LFP, the stimulus induced activity was computed as the per cent change from blank to stimulus. The average activity of the analog-Mua was computed as the average per cent signal change in the same window as the modulation curve of the LFP was computed (200 ms after stimulus onset till stimulus offset).
Multi-unit spiking activity was extracted by high-pass filtering the recorded signal above 500 Hz and applying a threshold of three standard deviations of the signal. Units that did not show a modulation for any stimulus of at least a factor of two compared to the blank (i.e. spontaneous activity) were discarded. On average the spontaneous activity of this multi-unit signal was 11.5 ± 4.1 spikes/s. Visual inspec-tion showed the reliability of this automated measure.
Results
fMRI Measurements in the Cat Visual System
The fMRI experiments were performed on anesthetized animals in a 9.4 Tesla horizontal magnet using a quadrature surface coil placed over the posterior part of the skull. The field of view covered a large part of the visual cortex, most notably the primary and secondary visual areas. For the present analysis we used only data from animals that showed reliable hemodynamic responses during the entire experiment. This was the case in five out of eight animals. In the remaining three experiments either no hemodynamic response could be obtained at all or responses repeatedly vanished and appeared again. This would happen on the timescale of roughly half an hour. In these experiments no stable state could be reached. In contrast, from the animals included in this study we obtained data from at least nine stimulation blocks each and the response strength was stable over several hours.
Voxels showing significant stimulus driven responses were identified using correlation analysis and clustering. Reliable activity was observed in the primary and secondary visual areas, in the posteromedial lateral suprasylvian area and in the thalamus (Fig. 1B). The response strength of a voxel for a given stimulus was computed as the per cent change in the BOLD signal compared to the blank period. Figure 1C shows an example of the signal from a ROI on the posterior lateral gyrus. Clearly the signal is modulated by the visual stimulation and the strength of the signal increase depends on the stimulus. Together with the functional data, high-resolution anatomy scans were obtained. These were used to identify the visual areas 17, 18, 19 and 21a as indicated on the left hemisphere in
Figure 1D. In addition, two ROIs based on the location of the recording sites in the physiology experiments were used. Examples of these ROIs are shown on the right hemisphere in Figure 1D.
fMRI Results
The following paragraph compares the hemodynamic responses to the different stimuli in the electrophysiology-based ROIs. In order to have an estimate of the visually evoked BOLD response within a ROI, the per cent signal change was averaged over all active voxels in that region. Figure 2 sum-marizes the average hemodynamic response for all animals, stimuli and the two areas of interest. In the primary visual cortex, the natural movies evoked the smallest responses (0.56% averaged across animals, cf. Table 1) whereas gratings are an effective stimulus and evoked the strongest responses (1.1%). The noise stimulus lead to stronger responses than the natural movies, but weaker than the gratings (0.66%). Area 21a showed the same tendencies, however, the overall response strength was higher than in the primary area (1.48, 0.74 and
1.21% for gratings, natural movies and pixel noise, respec-tively).
There is a difference in the average level of activation between animals. To compare the responses to different stimuli irrespectively of this variation, we compute the relative activation for different stimuli within each animal. Differences between stimuli consistent across animals are extracted by counting which relation between stimuli occurred in at least four out of the five animals. With this method one finds that in the primary areas gratings elicited stronger responses than natural movies and than the pixel noise. Furthermore, the pixel noise caused stronger activations than the natural movies. Simi-larly, in area 21a were the responses to gratings stronger than those for natural movies and the pixel noise. However, there was no consistent difference between natural movies and pixel noise in this ROI.
In the above analysis there are two arbitrary choices. First, the ROIs were restricted to regions similar to those that were used to sample the electrophysiological data. However, since the two experiments were not conducted in the same group of Figure 1. Stimulus paradigm and example activations. (A) Example frames from the three types of stimuli: sinewave gratings, natural movies and pixel noise (from left to right).
(B) Activation maps color-coded on the anatomy scans. The correlation of the BOLD signal with the stimulus paradigm is shown. Slices range from anterior to posterior (top left to bottom right). Active voxels are most prominent in the primary visual areas and in the thalamus (top right slice). (C) Stimulation paradigm: stimuli (12 s, gray bars) were separated by uniform blank screens (24 s, white area). The black trace shows the BOLD signal obtained from a region of interest on the posterior lateral gyrus. (D) Example from an anatomy scan together with the different ROIs. On the left hemisphere the ROIs representing the different visual areas are shown: dark green: A17; light green: A18; dark blue: A19; light blue: A21a. On the right hemisphere the ROIs based on the recording sites in the electrophysiology experiments are indicated: red: ROI in areas 17/18, orange: ROI in area 21a.
animals, the border of these regions is arbitrary. Second, a fixed correlation threshold of 0.25 was used to identify active voxels. However, this threshold sets a limit for the average activity and thus could also influence the relative activity between stimuli. We made two controls to evaluate the influ-ence of these choices.
The first control used the entire visual areas as ROIs to compute the average activities for the different stimuli. Figure 3A shows the average hemodynamic response to the different stimuli in areas 17/18 and 21a for one animal. Although the magnitude of the response differs compared to the ROIs based
on the physiology experiments, the relative activity for different stimuli was similar. The same result is found in all animals. Thus, changing the definition of the ROI changes the average magnitude of the hemodynamic responses, but the relations between the activities for the different stimuli found above hold also the when entire anatomical areas are used as ROI.
The second control used different correlation thresholds to determine the set of voxels included in the average. Besides a threshold of 0.25 as above, thresholds of 0.1 and 0 together with the clustering criterion and a threshold of –1 without clus-tering were used. In the last case all voxels within an ROI were included in the average. As expected, the average activity decreases with decreasing threshold: 0.98, 0.71, 0.41 and 0.07% for thresholds of 0.25, 0.1, 0 and –1, respectively (numbers averaged across all animals, stimuli and ROIs). Figure 3B compares the relative activities for the different stimuli and correlation thresholds taking this difference in the overall response strength into account. Although the magnitude of the relative response to different stimuli depends on the correla-tion threshold, the three relacorrela-tions between the stimuli reported above hold for all values of the correlation threshold: for all thresholds is the response to gratings stronger than that to the natural movies and the pixel noise; furthermore is the response to the pixel noise stronger than that to the natural movies. A similar effect of the choice of the correlation threshold is found in all animals. This indicates that the results reported above do not depend on the specific choice of which voxels are included in the ROIs. But the relative responses to the different stimuli are a property of the visual areas and not of a particular small population of voxels.
Electrophysiology Experiments
In a different group of animals we recorded broadband signals in areas 17/18 and area 21a of alert cats. From these recordings three measures of neuronal activity were extracted, each capturing a different aspect of the underlying processes. First, LFPs which were defined as the low frequency component (5–250 Hz) of the recorded signal and are a measure of local aggregate dendro-somatic potentials (Freeman, 1975; Mitzdorf, 1985, 1987; Juergens et al., 1999; Logothetis, 2003). Second, a measure of aggregate high frequency activity (analog-Mua; 0.5–3 kHz), which is influenced by the spiking activity in a larger region around the electrode tip (Buchwald and Grover, 1970; Gail et al., 2000; Super et al., 2003). This measure was obtained as a low-pass filtered version of the high frequency Figure 2. Average BOLD responses. Shown is the average per cent change in the
BOLD signal for the different stimuli, animals and ROIs. The average was computed across all active voxels (correlation threshold of 0.25) and the ROIs based on the physiology experiments. The bars denote the average and the error bars denote the SEM over stimulation blocks. The different types of stimuli are color-coded (black: gratings; dark gray: natural movies; light gray: pixel noise).
Table 1
Average response strength
The table lists the response strength averaged across animals separately for the different stimuli and areas. The numbers for the three electrophysiological measures of activity represent the average across all recording sites in the respective area, the BOLD responses were averaged across all active voxels in the physiology-based ROIs. The response of the LFP was averaged over the frequency range from 4 to 250 Hz. All numbers are in units of per cent change.
Stimuli Signal
LFP Analog-Mua Spikes BOLD
Area 17/18 Area 21a Area 17/18 Area 21a Area 17/18 Area 21a Area 17/18 Area 21a
Gratings 10.0 9.8 2.0 1.0 43 46 1.1 1.48
Natural movies 16.1 13.5 4.5 2.3 284 192 0.56 0.74
signal. Last, spiking activity of single or small populations of units (Adrian and Zotterman, 1929; Hubel and Wiesel, 1962). To allow a comparison with the fMRI data, the activations in these three measures are expressed in units of per cent change from blank to stimulus.
Example data from one recording session are shown in Figure 4A. The activity in the LFP was quantified using a time localized Fourier analysis. To quantify stimulus induced changes in the power, the spectrogram is normalized at each frequency with respect to the blank period. The example of such a normalized spectrogram in Figure 4A (top panel) shows a transient response after stimulus onset followed by sustained activity that selectively activates different frequency bands. Averaging the activity pattern across time yields a modulation curve quan-tifying the average response at individual frequencies for a given stimulus. Examples of such modulation curves from two animals, one from areas 17/18 and one from area 21a, are shown in Figure 4B,C (top panels). The amplitude of the response depends strongly on the frequency of the LFP. Whereas low frequencies often show a decrease in power, frequencies in the gamma range show increases in the order of 50%. Although the shape of the modulation curves varies between animals, the relative activities for different stimuli show a consistent pattern across animals (Kayser et al., 2003b). Comparing the total response strength across frequencies and animals (Table 1) reveals that gratings lead to weaker activa-tions than both the natural movies and the pixel noise and that the latter lead to responses of similar strength.
An example of the high frequency activity measured in the analog-Mua is shown in Figure 4A (middle trace). It is charac-terized by a short transient response followed by a tonic
response pattern similar to the LFP. Figure 4B and C (middle panel) show the average of this tonic response across recording sites and animals. The responses are stronger in areas 17/18 compared to area 21a by a factor of two. Further-more, gratings elicit roughly half the response as the other two stimuli, which were similar in response strength (Table 1). An example peristimulus–time histogram of the spiking activity is shown in Figure 4A (bottom panel). Compared to the other measures of neuronal activity, the firing rates show the strongest activations (Fig. 4B,C, bottom panel).
Comparison of Average BOLD and Neural Response Strength
The activations in the BOLD signal and the neuronal activities described above are all quantified in units of per cent signal change and can thus be compared directly (Table 1). The amplitudes of the BOLD activations averaged across animals and stimuli are 0.77% for the primary areas and 1.14% for the higher area. This relatively low amplitude is in agreement with other fMRI studies using anesthetized felines (Kim et al., 2000). In contrast, the modulations of the LFP averaged across frequencies and stimuli are stronger by an order of magnitude: 14.3% in the primary area and 12.4% in the higher area. However, as seen above the modulation depends strongly on the frequency and can reach 60% in the gamma range while being small at high frequencies. In fact, the analog-Mua, which is directly constructed from the high frequency components of the recorded signal, shows a much weaker activation magni-tude than the average LFP: 3.7 and 1.7% in the primary and higher area, respectively. This is on the same order of magni-tude as the BOLD responses. In contrast to this are the modu-lations of the thresholded spiking activity much stronger: 195% in the primary areas and 147% in the higher area. These results agree well with findings from simultaneous recordings of fMRI and electrophysiology in the monkey visual system that showed a much stronger neuronal than hemodynamic response (Logothetis et al., 2001). Together, these results point to an underestimation of the reliability and strength of the neuronal activations by BOLD measurements.
Comparison of BOLD and Neural Responses Across Recording Sites
From the BOLD activations we derived three relations between the different stimuli that were consistent across animals: grat-ings elicit stronger responses than the pixel noise; the pixel noise elicits stronger responses than the natural movies and the gratings elicit stronger responses than the natural movies. Looking at the average responses measured in the physiology experiments (Table 1) reveals that on average the LFP is not in agreement with the first two relations but with the last one.
The following paragraphs extend this comparison to indi-vidual recording sites and count the number of recording sites in the physiology experiments at which the relative activity for the different stimuli obeys the same relations as in the fMRI. This is done separately for the different frequencies of the LFP, for the analog-Mua and the firing rates. Note that applying a similar criterion to the fMRI data would not lead to a 100% match, since some of the differences between stimuli that form the basis of this comparison were only found in four out of five animals.
Counting the number of recording sites in areas 17/18 at which the response of the LFP to gratings exceeds that to natural Figure 3. BOLD responses averaged over entire visual areas and using different
correlation thresholds. (A) Per cent change in the BOLD signal averaged over all active voxels in the ROIs comprising the entire visual areas 17/18 and 21a for one animal (animal no. 3). As in Figure 2 the bars denote the average and the error bars denote the SEM over stimulation blocks; stimuli are color-coded. (B) Control using different correlation thresholds to compute the average BOLD response in the two physiology-based ROIs (again for animal no. 3). The results from the different thresholds are color-coded: 0.25, 0.1, 0 and –1 from black to increasing light gray. The different curves were shifted vertically to allow a better comparison of different thresholds despite differences in the overall level of activity (see text).
movies yields the curve shown in Figure 5A. The number of recording sites that are in agreement with the relations from the fMRI depends on the LFP frequency. The best match is found in the gamma range (88% at 42 Hz) and the percentage decreases quickly at low and high frequencies. Averaged across frequencies this results in a match of 27%. Figure 5B shows the same analysis for relation between the activities for gratings and pixel noise. Again, the number of recording sites that are in agreement with the fMRI depends on the frequency (peak of 88% at 39 Hz) and the average match is 29%. In contrast, the comparison of pixel noise to natural movies is less dependent on the frequency (Fig. 5C; maximum of 68% at 29 Hz; 51% aver-aged across frequencies). A similar result is found when the same analysis is performed on the recordings from area 21a (data not shown). The comparisons involving gratings show strong frequency dependence with similar peaks (89% at 39 Hz for gratings > natural movies and 87% at 46 Hz for gratings > noise). The comparison of the two complex stimuli shows a weaker frequency dependency (maximum 72% at 25 Hz). Aver-aged across frequencies this yields a match of 30, 29 and 57% for the three relations. As a consequence, we note that a comparison of results from fMRI and LFPs can strongly depend on two factors: the frequency band of the LFP used and the types of stimuli involved.
Next we compare the responses of the analog-Mua to the different stimuli. Comparing the responses to gratings to that to the pixel noise, the analog-Mua matches the fMRI at ∼20% of the recording sites in areas 17/18 (Fig. 5A); in area 21a the same percentage is reached. Comparing the responses for grat-ings to that for natural movies yields the same result. In contrast, comparing the responses to the pixel noise to that to the natural movies, the analog-Mua agrees with the fMRI at 65%
in area 18 (Fig. 5C); in area 21a the match is 57%. Overall, the comparison of the analog-Mua to the fMRI yields a similar match as found for the LFP.
Last, we compare the results from the spiking activity with the fMRI. Looking at the comparisons involving gratings, the spiking activity yields a worse match with the fMRI than does the analog-Mua. At no site was the firing rate for the gratings higher than for the natural movies. Only at 20% of the sites in areas 17/18 and 5% in area 21a was the firing rate for the grat-ings higher than for the pixel noise. Comparing the activity for the two complex stimuli, the spiking activity matches the fMRI at 46% of the sites in areas 17/18 and 50% in area 21a. Thus, the comparison of the spiking activity to the fMRI for the complex stimuli yields a worse match than does the LFP or the analog-Mua.
The outcome of the above comparison of fMRI responses and the different measures of neuronal activity is dependent on the type of stimuli used. The comparisons involving gratings show a strong influence of the frequencies of the LFP. However, when using only complex stimuli the details about frequency ranges used become less important. We hypothe-sized that this frequency dependence should become even weaker when only natural stimuli are used. From the BOLD activations for the three individual natural movies we extracted their relative activations. On average across animals the three natural movies induced different BOLD responses (1.15, 1.05 and 0.87%) and the difference of the activity induced by these movies is consistent in four out of five animals. The curve in Figure 5D shows the number of recording sites in areas 17/18 at which the LFP obeyed these relations. Indeed, the depend-ence of this curve on the frequency axis is small and yields an average of 56%. A similar comparison with the activations from Figure 4. Electrophysiology experiments. (A) Example activity in the LFP, analog-Mua and spiking activity during the presentation of a natural movie clip. Top panel: normalized
spectrogram of the LFP; middle panel: analog-Mua; bottom panel: peristimulus time histogram of multi-unit spikes, all averaged over 40 repeats of the stimulus. All responses are expressed in units of signal change from blank to stimulus. The dashed line below the spectrogram indicates tonic part of the response over which the modulation curves were computed. (B, C). Average response strength in the primary (B) and the higher visual areas (C). Top: modulation curves of the LFP for the different stimuli and one animal each (n = 49 sites for areas 17/18; n = 9 sites for area 21a). Middle: response in the analog-Mua (n = 42 sites; five animals). Bottom: response in the spiking activity (n = 15 and 18 sites, respectively; three animals). The different types of stimuli are color-coded (black: gratings; dark gray: natural movies; light gray: pixel noise).
the analog-Mua yields a match of 68%. In sharp contrast, a comparison with the spiking activity shows that only 25% of the recording sites show the same relative activations for the different natural movies. The results obtained from area 21a are qualitatively and quantitatively similar (53, 62 and 30% for the LFP, the analog-Mua and the spiking activity). Thus, when only natural stimuli are considered, a comparison of LFPs and BOLD responses becomes insensitive to the range of frequencies used. Furthermore, the dissociation between activations in the LFPs and in the analog-Mua on the one hand and the thresh-olded spiking activity on the other hand becomes stronger and the spiking responses show a weak concordance with the BOLD responses.
In the above comparisons single frequencies of the LFP were used. However, studies analyzing LFPs often use the average power in a given frequency band as the signal characterizing the activity in the LFP. We made a similar comparison between LFPs and the results from the fMRI as above, using the average power in different frequency bands instead of single frequen-cies. The results from these comparisons (Fig. 6) are in good agreement with those from single frequencies. Comparing grat-ings to natural movies or pixel noise shows a strong depend-ence on the frequency interval used, with the peak occurring for the interval from 35 to 54 Hz. The comparison of the two classes of complex stimuli, natural movies and pixel noise, yields a maximum for the interval of 19–31 Hz and a minimum in the range of 50–100 Hz. Similar, the comparison between
the different natural movies yields a good match with a maximum in the range of 15–31 Hz and a minimum for inter-vals between 50 and 100 Hz. Altogether, these results show that independently of the stimuli used, the match of BOLD acti-vations and LFPs is strongest for frequency intervals roughly in the range of 20–50 Hz.
Discussion
The present study compares neuronal activities measured using electrophysiological methods to the fMRI-BOLD signal. The LFP gave a good agreement with the BOLD signal only in a limited frequency range when different types of stimuli were mixed, e.g. gratings and complex stimuli. When comparing the activities for complex or natural stimuli, the frequency depend-ence of the match between LFP and BOLD response was much reduced. Under these conditions the analog-Mua achieved a comparable match to the BOLD signal as the LFP. The classical localized measure of neuronal activity, the thresholded spiking activity, showed a different behavior. Irrespective of the stimuli used for the comparison, the firing rates and BOLD acti-vations for different stimuli never agreed at more than 50% of the recording sites and the spiking activity performed poor at predicting the BOLD responses. Summarizing, the comparison of electrophysiology and fMRI data depends on two factors. First, the definition of the neural activity extracted from elec-trical signals recorded using microelectrodes. Second, the type Figure 5. Neural activity consistent with fMRI results. For each of the three measures of neuronal activity recorded in the physiology experiments the figure shows the percentage
of recording sites at which the activity for the different stimuli obeys the relations that were obtained from the BOLD responses: (A) wave gratings > natural movies; (B) sine-wave gratings > pixel noise; (C) pixel noise > natural movies; (D) relative activity for the different natural movies. The data include 167 LFP recording sites (five animals), 42 analog-Mua sites (five animals) and 33 multi-unit sites (three animals).
of stimulation used, which in the present case is the type of visual stimulus.
Overall, the best match of LFPs and fMRI-BOLD signals was found in the gamma frequency range of the LFP. Neuronal activity in this frequency range has been observed in the visual cortex under a variety of stimulation paradigms (Singer and Gray, 1995). The precise origin of this phenomenon is still not resolved and its significance with respect to coding global stim-ulus properties is hotly debated (Singer, 1999; Shadlen and Movshon, 1999). Most models addressing these experimental data assign a prominent role to inhibitory mechanisms (Von der Marlsburg, 1999). Inhibitory interactions between neurons do not increase the overall spike rate but consume energy and lead to an increased blood flow, as supported by experimental results obtained in the cerebellum (Mathiesen et al., 2000). As a result, fMRI measurements are sensitive to this type of process. Thus, the data presented here are compatible with the speculation, that by virtue of inhibitory processes, fMRI meas-urements are sensitive to activity in the gamma frequency range.
An important point requiring discussion is the fact that the animals in the fMRI experiments were anesthetized. In general, the use of anesthesia is very prominent in animal research because it eases the experiment and allows prolonged time for data acquisition. Some experiments, like the fMRI scans with feline subjects in the present study, were unfeasible without anesthesia, due to the gradient noise during functional scans utilizing the fast Echo-planar Imaging (EPI) sequences. The effects of anesthetics on the responses can be variable. Even
anesthetics of the same class, like halothane and isoflurane, have been reported to have differential effects on global meas-ures of brain activity (Villeneuve and Casanova, 2003). However, anesthetics can alter the response properties of neurons. For example, the spatio-temporal dynamics of sponta-neous and stimulus evoked responses is altered by urethane anesthesia in the rat (Erchova et al., 2002). Furthermore, recep-tive field properties can be altered both in the visual cortex (Robertson, 1965; Lee, 1970) and the thalamus (Friedberg et al., 1999). However, the BOLD signal can be assumed to be relatively insensitive to such changes of temporal response dynamics as it measures a highly ‘smoothed’ version of the underlying neuronal responses at a timescale of hundreds of milliseconds (rather than the millisecond scale of the under-lying neuronal responses). Furthermore, effects of anesthetics seem to be more prominent in paradigms requiring visual attention as indicated by the disappearance of contextual effects like figure ground modulation during anesthesia (Lamme et al., 1998). Such an effect might be visible also in fMRI experiments as the BOLD signal is more sensitive to atten-tional effects than firing rates (Heeger and Ress, 2002). However such effects of the extra classical receptive field play a minor role in the present stimulation paradigm. Modulations of responses by anesthetics have been assessed in fMRI experi-ments as well. Effects of sub-anesthetic doses of Isoflurane are noticeable in many cortical areas but seem to spare primary visual areas (Heinke and Schwarzbauer, 2001). Along similar lines, the effect of ketamine on neuronal responsiveness as measured by the BOLD signal occurs only at high doses and shortly (<1 h) after injection (Leopold et al., 2002). Thus, anesthesia has little effects on the primary visual areas and especially on paradigms that do not require selective visual attention. Based on this, we conclude that the use of anes-thetics supposedly has a limited effect on the comparison of the fMRI-BOLD responses from anesthetized animals with electrophysiological signals recorded in the alert animal presented here.
Despite its wide use in neuroscience research, the neural origin of the BOLD signal is still debated. Recently, evidence was put forward that the BOLD signal corresponds well to firing rates of single units measured in the same visual area. Indirect comparisons of fMRI measurements in humans and recordings of firing rates in monkeys showed a qualitative (Heeger et al., 1999) and also a quantitative (Heeger et al., 2000; Rees et al., 2000) agreement. However, simultaneous recordings of LFPs, spiking activity and hemodynamic responses in monkey visual cortex (Logothetis et al., 2001) and rat cerebellum (Mathiesen et al., 1998, 2000) provided strong evidence that the signals measured using fMRI are stronger coupled to LFP activity than to firing rates. Since the LFPs reflect synchronized components of dendro-somatic potentials and subthreshold fluctuations (Mitzdorf, 1985, 1987; Juergens et al., 1999) this led to the conclusion that the fMRI is more sensitive to the input to a local region of the brain than to its spiking output (Logothetis et al., 2001; Logothetis, 2003). The results of the present study support this view that the BOLD signal reflects local subthreshold processes more than spiking activity.
Notes
We would like to thank Gudrun Möller and Rodrigo Salazar for helping with the electrophysiological experiments and Itamar Ronen for
Figure 6. Frequency ranges of the LFP consistent with the fMRI results. For each
possible frequency range of the LFP the graph shows the percentage of recording sites at which the activity for the different stimuli obeys the relations that were obtained from the BOLD responses (similar analysis as in Fig. 5 for the LFP, but using frequency intervals instead of single frequencies). The comparison of the activity for different stimuli is based on the average power in frequency bands whose lower border is given by the frequency on the x-axis and whose upper border is given by the frequency on the
y-axis. The relations between stimuli are: (A) sine-wave gratings > natural movies; (B)
sine-wave gratings > pixel noise; (C) pixel noise > natural movies; (D) relative activity for different natural movies.
helping with the fMRI experiments. Furthermore we thank the refe-rees for their constructive and helpful comments. This work was financially supported by the Center for Neuroscience Zurich, the Swiss National Science Foundation (Grant No. 31–65 415.01), the EU/ BBW (IST-2000–28127, 01.0208–1), the National Institutes of Health (RR08079, MH61937), the Keck Foundation and the Human Frontiers Science Program.
Address correspondence to C. Kayser, Institute of Neuroinfor-matics, University & ETH Zurich, Winterthurerstrasse 190, 8057 Zurich, Switzerland. Email: [email protected].
References
Adrian ED, Zotterman Y (1929) The impulses produced by sensory nerve-endings, Part 2. The response of a single end-organ. J Physiol (Lond) 61:151–171.
Baddeley R, Abbott LF, Booth MCA, Sengpiel F, Freeman T, Wakeman EA, Rolls E (1997) Reponses of neurons in primary and inferior temporal visual cortices to natural scenes. Proc R Soc Lond B 264:1775–1783.
Bandettini PA, Wong EC, Hinks RS, Tikofsky RS, Hyde JS (1992) Time course E.P.I. of human brain function during task activation. Magn Reson Med 25:390–397.
Bonmassar G, Anami K, Ives J, Belliveau JW (1999) Visual evoked potential (VEP) measured by simultaneous 64-channel EEG and 3T fMRI., Neuroreport 10:1893–1897.
Brainard DH (1997) The psychophysics toolbox. Spat Vis 10:433–436. Brinker G, Bock C, Busch E, Krep H, Hossmann KA, Hoehn-Berlage M (1999) Simultaneous recording of evoked potentials and T2-weighted MR images during somatosensory stimulation of rat. Magn Reson Med 41:469–473.
Buchwald JS, Grover FS (1970) Amplitudes of background fast activity characteristic of specific brain sites. J Neurophysiol 33:148–159. Creutzfeldt OD, Nothdurft HC (1978) Representation of complex
visual stimuli in the brain. Naturwissenschaften 65:307–318. Dan Y, Atick JJ, Reid RC (1996) Efficient coding of natural scenes in
the lateral geniculate nucleus: experimental test of a computa-tional theory. J Neurosci 16:3351–3362.
Duong TQ, Kim DS, Ugurbil K, Kim, SG (2001) Localized cerebral blood flow response at submillimeter columnar resolution. Proc Natl Acad Sci USA 98:10904–10909.
Erchova IA, Lebedev MA, Diamond ME (2002) Somatosensory cortical neuronal population activity across states of anaesthesia. Eur J Neurosci 15:744–752.
Freeman W (1975) Mass action in the nervous system. New York: Academic Press.
Friedberg MH, Lee SM, Ebner FF (1999) Modulation of receptive field properties of the thalamic somatosensory neurons by the depth of anaesthesia. J Neurophysiol 81:2243–2252.
Gail A, Brinksmeyer HJ, Eckhorn R (2000) Contour decouples gamma activity across texture representation in monkey striate cortex. Cereb Cortex 10:840–850.
Heeger DJ, Ress D (2002) What does fMRI tell us about neuronal activity? Nat Rev Neurosci 3:142–151.
Heeger DJ, Boynton GM, Demb JB, Seidemann E, Newsome WT (1999) Motion opponency in visual cortex. J Neurosci 19:7162–7174. Heeger DJ, Huk AC, Geisler WS, Albrecht DG (2000) Spikes versus
BOLD: what does neuroimaging tell us about neuronal activity? Nat Neurosci 3:631–633.
Heinke W, Schwarzbauer C (2001) Subanesthetic isoflurane affects task-induced brain activation in a highly specific manner: a func-tional magnetic resonance imaging study. Anesthesiology 94:973–981.
Hubel DH, Wiesel TN (1962) Receptive fields, binocular interaction and functional architecture in the cat’s visual cortex. J Physiol (Lond) 160:106–154.
Juergens E, Guettler A, Eckhorn R (1999) Visual stimulation elicits locked and induced gamma oscillations in monkey intracortical and EEG-potentials but not in human EEG. Exp Brain Res 129:247–259.
Kayser C, Einhäuser W, König P (2003a) Temporal correlations of orientations in natural scenes. Neurocomputing 52:117–123.
Kayser C, Salazar RF, König P (2003b) Responses to natural scenes in cat V1. J Neurophysiol 90:1910–1920.
Kim DS, Duong TQ, Kim SG (2000) High-resolution mapping of iso-orientation columns by fMRI. Nat Neurosci 3:164–169.
Kruse W, Eckhorn R (1996) Inhibition of sustained gamma oscillations (35–80 Hz) by fast transient responses in cat visual cortex. Proc Natl Acad Sci USA 93:6112–6117.
Kwong KK, Belliveau JW, Chesler DA, Goldberg IE, Weisskoff RM, Poncelet BP, Kennedy DN, Hoppel BE, Cohen MS, Turner R (1992) Dynamic magnetic resonance imaging of human brain activity during primary sensory stimulation. Proc Natl Acad Sci USA 89:5675–5679.
Lamme VA, Zipser K, Spekreijse H (1998) Figure-ground activity in primary visual cortex is suppressed by anesthesia. Proc Natl Acad Sci USA 95:3263–3268.
Lee B (1970) Effect of anesthetics upon visual responses in the cats’ striate cortex. J Physiol 207:604–606.
Lehky SR, Sejnowski TJ, Desimone R (1992) Predicting responses of nonlinear neurons in monkey striate cortex to complex patterns. J Neurosci 12:3568–3581.
Leopold DA, Plettenberg HK, Logothetis NK (2002) Visual processing in the ketamine-anesthetized monkey. Optokinetic and blood oxygenation level-dependent responses. Exp Brain Res 143:359–372.
Logothetis NK (2003) The underpinnings of the BOLD functional magnetic resonance imaging signal. J Neurosci 23:3963–3971. Logothetis NK, Guggenberger H, Peled S, Pauls J (1999) Functional
imaging of the monkey brain. Nat Neurosci 2:555–562.
Logothetis NK, Pauls J, Augath M, Trinath T, Oeltermann A (2001) Neurophysiological investigation of the basis of the fMRI signal. Nature 412:150–157.
Mathiesen C, Caesar K, Akgoren N, Lauritzen M (1998) Modification of activity-dependent increases of cerebral blood flow by excitatory synaptic activity in spikes in rat cerebellar cortex. J Physiol (Lond) 512:555–566.
Mathiesen C, Caesar K, Lauritzen M (2000) Temporal coupling between neuronal activity and blood flow in rat cerebellar cortex as indicated by field potential analysis. J Physiol (Lond) 523:235–246.
Menon V, Ford JM, Lim KO, Glover GH, Pfefferbaum A (1997) Combined event-related fMRI and EEG evidence for temporal–pari-etal cortex activation during target detection. Neuroreport 8:3029–3037.
Mitzdorf U (1985) Current source-density method and application in cat cerebral cortex: investigation of evoked potentials and EEG phenomena. Physiol Rev 65:37–100.
Mitzdorf U (1987) Properties of the evoked potential generators: current source-density analysis of visually evoked potentials in the cat cortex. Int J Neurosci 33:33–59.
Movshon JA, Thompson ID, Tolhurst DJ (1978) Spatial and temporal contrast sensitivity of neurons in areas 17 and 18 of the cat’s visual cortex. J Physiol (Lond) 283:101–120.
Ogawa S, Tank DW, Menon R, Ellermann JM, Kim SG, Merkle H, Ugurbil K (1992) Intrinsic signal changes accompanying sensory stimulation: functional brain mapping with magnetic resonance imaging. Proc Natl Acad Sci USA 89:5951–5955.
Ogawa S, Lee TM, Stepnoski R, Chen, W Zhu XH, Ugurbil K (2000) An approach to probe some neural systems interaction by functional MRI at neural time scale down to milliseconds. Proc Natl Acad Sci USA 97:11026–11031.
Palmer LA, Rosenquist AC, Tusa RJ (1978) The retinotopic organiza-tion of lateral suprasylvian visual areas in the cat. J Comp Neurol 177:237–256.
Pelli DG (1997) The VideoToolbox software for visual psychophysics: transforming numbers into movies. Spat Vis 10:437–442.
Rainer G, Augath M, Trinath T, Logothetis NK (2001) Nonmonotonic noise tuning of BOLD fMRI signal to natural images in the visual cortex of the anesthetized monkey. Curr Biol 11:846–854. Rees G, Friston K, Koch C (2000) A direct quantitative relationship
between the functional properties of human and macaque V5. Nat Neurosci 3:716–723.
Reid RC, Victor JD, Shapley RM (1992) Broadband temporal stimuli decrease the integration time of neurons in cat striate cortex. Vis Neurosci 9:39–45.
Robertson AD (1965) Anesthesia and receptive fields. Nature 205:80–83.
Shadlen MN, Movshon JA (1999) Synchrony unbound: a critical evalu-ation of the temporal binding hypothesis. Neuron 24:67–77. Singer W (1999) Neuronal synchrony: a versatile code for the
defini-tion of correladefini-tions? Neuron 24:49–65.
Singer W, Gray CM (1995) Visual feature integration and the temporal correlation hypothesis. Annu Rev Neurosci 18:555–586.
Smyth D, Willmore B, Baker GF, Thompson ID, Tolhurst DJ (2003) The receptive field organization of simple cells in primary visual cortex of ferrets under natural scene stimulation. J Neurosci 23:4746–4759.
Super H, van der Togt C, Spekreijse H, Lamme VAF (2003) Internal state of monkey primary visual cortex (V1) predicts figure-ground perception. J Neurosci 22:3407–3414.
Tusa RJ, Palmer LA (1980) Retinotopic organization of areas 20 and 21 in the cat. J Comp Neurol 193:147–164.
Tusa RJ, Palmer LA, Rosenquist AC (1978) The retinotopic organiza-tion of area 17 (striate cortex) in the cat. J Comp Neurol 177:213–235.
Tusa RJ, Rosenquist AC, Palmer LA (1979) Retinotopic organization of areas 18 and 19 in the cat. J Comp Neurol 185:657–678.
Villeneuve MY, Casanova C (2003) On the use of isoflurane versus halothane in the study of visual response properties of single cells in the primary visual cortex. J Neurosci Methods 15:19–31. Vinje WE, Gallant JL (2001) Sparse coding and decorrelation in
primary visual cortex during natural vision. Science 287:1273–1276.
Vinje WE, Gallant JL (2002) Natural stimulation of the nonclassical receptive field increases information transmission efficiency in V1. J Neurosci 22:2904–2915.
Von der Marlsburg C (1999) The what and why of binding: the modeler’s perspective. Neuron 24:95–104.
Weliky M, Fiser J, Hunt RH, Wagner DN (2003) Coding of natural scenes in primary visual cortex. Neuron 37:703–718.