ARTICLE
Magmatic-dominated fluid evolution in the Jurassic Nambija
gold skarn deposits (southeastern Ecuador)
Jean Vallance&Lluís Fontboté&Massimo Chiaradia&
Agnès Markowski&Susanne Schmidt&
Torsten Vennemann
Received: 3 January 2009 / Accepted: 11 March 2009 / Published online: 31 March 2009 # Springer-Verlag 2009
Abstract The Jurassic (approximately 145 Ma) Nambija oxidized gold skarns are hosted by the Triassic volcanosedi-mentary Piuntza unit in the sub-Andean zone of southeastern Ecuador. The skarns consist dominantly of granditic garnet (Ad20–98) with subordinate pyroxene (Di46–92Hd17–42Jo0–19) and epidote and are spatially associated with porphyritic quartz-diorite to granodiorite intrusions. Endoskarn is developed at the intrusion margins and grades inwards into a potassic alteration zone. Exoskarn has an outer K- and Na-enriched zone in the volcanosedimentary unit. Gold mineralization is associated with the weakly developed retrograde alteration of the exoskarn and occurs mainly in sulfide-poor vugs and milky quartz veins and veinlets in association with hematite. Fluid inclusion data for the main
part of the prograde stage indicate the coexistence of high-temperature (500°C to >600°C), high-salinity (up to 65 wt. % eq. NaCl), and moderate- to low-salinity aqueous-carbonic fluids interpreted to have been trapped at pressures around 100–120 MPa, corresponding to about 4-km depth.
Lower-temperature (510–300°C) and moderate- to
low-salinity (23–2 wt.% eq. NaCl) aqueous fluids are recorded in garnet and epidote of the end of the prograde stage. The microthermometric data (Th from 513°C to 318°C and
salinity from 1.0 to 23 wt.% eq. NaCl) and δ18O values
between 6.2‰ and 11.5‰ for gold-bearing milky quartz from the retrograde stage suggest that the ore-forming fluid was dominantly magmatic. Pressures during the early retrograde stage were in the range of 50–100 MPa, in line
with the evidence for CO2effervescence and probable local
boiling. The dominance of magmatic low-saline to moder-ately saline oxidizing fluids during the retrograde stage is consistent with the depth of the skarn system, which could have delayed the ingression of external fluids until relatively low temperatures were reached. The resulting low water-to-rock ratios explain the weak retrograde alteration and the compositional variability of chlorite, essentially controlled by host rock compositions. Gold was precipitated at this stage as a result of cooling and pH
increase related to CO2effervescence, which both result in
destabilization of gold-bearing chloride complexes. Signif-icant ingression of external fluids took place after gold
deposition only, as recorded by δ18O values of 0.4‰ to
6.2‰ for fluids depositing quartz (below 350°C) in sulfide-rich barren veins. Low-temperature (<300°C) meteoric
fluids (δ18
Owater between−10.0‰ and −2.0‰) are respon-sible for the precipitation of late comb quartz and calcite in cavities and veins and indicate mixing with cooler fluids of higher salinities (about 100°C and 25 wt.% eq. NaCl). The latter are similar to low-temperature fluids (202–74.5°C)
DOI 10.1007/s00126-009-0238-2
Editorial handling: B. Lehmann
J. Vallance (*)
:
L. Fontboté:
M. Chiaradia:
S. Schmidt Section des Sciences de la Terre et de l’Environnement, Université de Genève,Rue des Maraîchers 13, 1205, Geneva, Switzerland
e-mail: [email protected] J. Vallance
Pan American Silver Peru SAC,
Av. La Floresta 497, Of. 301, Chacarilla del Estanque, San Borja, Lima, Peru
A. Markowski
Isotopengeologie und Mineralische Rohstoffe, ETH-Zentrum, C61.1, Sonneggstrasse 5, 8092,
Zurich, Switzerland T. Vennemann
Institut de Minéralogie et Géochimie, Université de Lausanne, L’Anthropôle,
with δ18O values of −0.5‰ to 3.1‰ and salinities in the
range of 21.1 to 17.3 wt.% eq. CaCl2, trapped in calcite of
late veins and interpreted as basinal brines. Nambija represents a deep equivalent of the oxidized gold skarn
class, the presence of CO2 in the fluids being partly a
consequence of the relatively deep setting at about 4-km depth. As in other Au-bearing skarn deposits, not only the prograde stage but also the gold-precipitating retrograde stage is dominated by fluids of magmatic origin.
Keywords Gold . Skarn . Aqueous-carbonic fluids . Oxygen isotope . Chlorite . Nambija . Ecuador
Introduction
Skarns are an important source of gold either as the main commodity or as a by-product. Skarns from which gold is extracted as the unique or main commodity are known as
gold skarns (e.g., Meinert2000) and have been subdivided
into reduced, oxidized, magnesian, and metamorphic types according to the mineralogy of the dominant silicate phase
(characterized either by Fe2+, Fe3+, or Mg2+) or the
geological context (e.g., metamorphism-related for meta-morphic gold skarns). The majority of gold production from skarns is derived from oxidized skarns in which gold is mined as a by-product of copper. Most of these skarns contain <1 g/t Au, although in Cu-rich ores Au can reach
higher grades (Meinert2000). Few detailed fluid inclusions
studies on the fluid evolution in oxidized gold skarn deposits are, however, available in the literature (e.g., Mc Coy and
Wabu gold skarns, Brooks et al.1991; Brooks1994; Allen
and Aslund1998).
The Nambija oxidized gold skarn district is one of the
main gold producers of Ecuador (see Chiaradia et al.2009)
and is economically and scientifically interesting because of a high average gold grade of 15 g/t Au, with some ore zones having grades as high as 300 g/t Au. These features set Nambija apart from most oxidized gold skarns and have prompted this detailed study of the physicochemical evolution of the ore fluids in the skarns.
Nambija is located in the sub-Andean zone of
southeast-ern Ecuador, 40 km west of the Peruvian border (Fig.1). The
district includes several mines detailed in Fig.1 and in the
companion paper of Chiaradia et al. (2009).
The results of previous studies on the Nambija district
(Vallance et al.2003; Fontboté et al.2004; Markowski et al.
2006; Chiaradia et al.2009) have shown that the
prograde-stage skarn, consisting dominantly of granditic garnet with subordinate pyroxene and epidote, is of the oxidized type and is associated in time and space with granodioritic and quartz-dioritic porphyritic intrusions of the Jurassic Pangui
porphyry belt (Gendall et al.2000; Chiaradia et al.2009).
No mineralogical zonation has been observed at the mine scale, except at Fortuna. The main ore mineral associated with gold is hematite indicating oxidizing conditions at the time of gold deposition. U–Pb age determinations of magmatic zircon and endoskarn titanite from porphyritic intrusions at Fortuna and Campanillas as well as Re–Os ages of post-gold molybdenite is indistinguishable and constrain gold deposition at approximately 145 Ma
(Chiaradia et al. 2009). This suggests that the Nambija
district is part of the same metallogenic event responsible for the Late Jurassic El Pangui porphyry Cu belt in the sub-Andean zone of southeastern Ecuador (Gendall et al.
2000; Chiaradia et al.2009). The results point to a direct
relationship between skarnification and gold ore as
previ-ously suggested by Hammarstrom (1992).
The present contribution refines certain aspects of the description of skarn and K and Na metasomatism affecting both the porphyritic intrusions and the volcaniclastic host rocks. The main focus is placed on the nature and evolution of the hydrothermal fluid in the Nambija oxidized gold skarn deposits. This is obtained through newly acquired microthermometric and Raman data, as well as stable isotope analyses of quartz and calcite. The study integrates
previous fluid inclusion data of Fontboté et al. (2004) and
Markowski et al. (2006). The data suggest that both the
prograde skarn and the weakly developed retrograde alteration were dominated by magmatic fluids and that the mineralization process at Nambija took place at deeper levels than other oxidized gold skarns.
Geological setting
The regional geology and geochronology of the Nambija district is summarized in the companion paper (Chiaradia
et al. 2009) and in previous work (Vallance et al. 2003;
Fontboté et al. 2004; Markowski et al. 2006). Briefly, the
skarn bodies are hosted by the Triassic volcanosedimentary Piuntza unit, which occurs as a roof pendant within the Jurassic-I-type granodioritic to tonalitic Zamora Batholith. The Piuntza unit and the Zamora Batholith are cut by several felsic porphyritic intrusions (quartz-diorite to granodiorite at the Fortuna, Cambana, and Campanillas
deposits, Fig. 1), which form outcrops of several tens to
hundreds of meters in length, as well as by dikes up to 5–7 m thick. Some of these intrusions, like Cumay, 2 km north of
the Fortuna mine (Fig.1), are mineralized with copper and
molybdenum or with copper and gold (Prodeminca 2000),
and all are overprinted by extensive K–Na metasomatism.
Plagioclase is the most abundant phenocryst phase together with K-feldspar in a quartzo-feldspathic groundmass. Biotite is rare, and green hornblende is the main mafic mineral. Two of these porphyritic intrusions have been
dated at 145.38±0.14 Ma (U–Pb on zircon, Chiaradia et al. 2009).
Four main sets of structures are found in the Nambija
district (Fig. 1). The first is represented by a conjugate
system of N–S dextral reverse faults (which limit the district to the east and to the west) and NE-trending steeply dipping faults with locally sinistral displacement and/or tensional character. The main gold mineralization and most retrograde
alteration minerals studied in the present work are controlled by these NE-striking faults. A second set, identified in the
Guaysimi mine (Fig. 1), consists of ENE–WSW- to
E–W-trending steeply dipping normal faults in part sealed by calcite. The third set cuts the previous structures and consists of NW-striking reverse faults and thrust planes dipping 10– 40° to SW. A fourth set of E-striking steeply dipping normal dextral faults crosscuts all previous structures.
1 km Campanillas Nambija Guaysimi Cambana N San Carlos de las Minas a b c d e f j k l m n Cumay Fortuna DTR414 DTR415 DTR416 DTR391 DTR417 DTR340 h o p Hornblende-feldspar porphyry
Area with discontinuous skarn bodies
Quartzite, limestone Volcanic and volcaniclastic rocks on ridges
Piuntza unit
Biotite-muscovite schist Isimanchi
unit Gold prospect and mine
Zamora Batholith Granodiorite-diorite-monzogranite
Porphyry Cu-Mo and Cu-Au prospects
Samples taken outside the mines and showing potassic alteration and/or endoskarn (underlined references = porphyritic intrusion sample)
955000 954000 750000 750000 DTR523 DTR525 DTR524 0 100 200 km PiÒon Zamora Batholith Amazon craton Nambija area Pangui Jurassic porphyry copper belt Accreted oceanic terranes Quito Western Co rdillera Inter -Andean V alley Colombia Ecuador Peru Peru Pacific Ocean N Coastal plain sub-Andean Zone Portovelo i g 0° 79°W Ea ste rn Co rdill era Cu skarn prospect Condor` Sultana
del
Fig. 1 Structural map of Ecuador (modified from Litherland et al.
1994; Pratt et al.2005) showing the location of the Nambija district and the Zamora Batholith and simplified geologic map of the Nambija district (modified from Prodeminca2000) with location of the samples taken outside the mines. a Cumay Cu–Mo porphyry (prospect), b Fortuna Cuerpo 3 (prospect), c Fortuna Mine 1 (abandoned workings), d Fortuna Mine 2 and Southern Sector (open pit), e Cambana (open pit), f Campanillas-Katy (abandoned workings), g Campanillas main present workings (open pit and underground), h Nambija-El Arco
(open pit and underground), i Nambija-El Playón-Mapasingue (underground), j Nambija-El Tierrero gold skarn and Cu–Mo porphyry (open pit and underground), k Nambija-El Diamante (prospect), l David Cu–Mo porphyry (prospect), m Guaysimi-Banderas (open pit), n Guaysimi central (open pit), o Cerro Colorado-Tumi Cu–Au porphyry (prospect), p Sultana del Cóndor-Bruce (open pit and underground), q Sultana del Cóndor central (open pit and under-ground), r Sultana del Cóndor-Toscón (open pit and underground)
Analytical methods
Microthermometric analyses were made on 70- to 100-µm-thick doubly polished rock sections. A Linkam THMSG600 heating and freezing stage mounted on a DMLB Leica microscope equipped with a Nikon ×100 long-working-distance lens was used for the microthermometric
measure-ments, as described by Shepherd (1981). The system was
calibrated with synthetic fluid inclusions at−56.6°C, 0.0°C,
and 374.1°C (Sterner and Bodnar1984). Low-temperature
measurements have an uncertainty of ±0.1°C, whereas high-temperature measurements have a precision of ±1°C.
Salinities were calculated in the NaCl–H2O system from
final ice melting temperatures between 0.0°C and−21.1°C,
using equations published in Bodnar and Vityk (1994) and
in the CaCl2–H2O system for ice melting temperatures
below −21.1°C with a eutectic around −52°C, using the
equation of Oakes et al. (1990). Salinities of halite-bearing
(±sylvite-bearing) inclusions were calculated using the
equation of Sterner et al. (1988) and the computer program
AqSo1e of Bakker and Brown (2003). Bulk compositions
and isochores of aqueous-carbonic fluid inclusions were modeled with the ICE, Q2, NOSALT, BULK, and ISOC
computer programs of Bakker and Brown (2003).
Raman measurements were conducted using a Jobin-Yvon Labram Raman microprobe with a modified Olympus microscope. Raman spectra were recorded using an incident laser wavelength of 532 nm from a Coherent DPSS 534 neodymium-doped yttrium aluminum garnet laser following
the procedures of Dubessy et al. (1989) and Burke (2001).
Chlorites were analyzed at the Institute of Mineralogy and Geochemistry of Lausanne (Switzerland) on a Cameca Camebax SX 50 electron microprobe using a 15-nA beam current and a 15-kV acceleration voltage.
Oxygen isotope analyses were made at the Institute of Mineralogy and Geochemistry of Lausanne in Switzerland.
The oxygen isotope composition (16O, 18O) of the quartz
samples were measured using a method similar to that
described by Sharp (1990) and Rumble and Hoering (1994)
and that is described in more detail in Kasemann et al.
(2001). Between 0.5 and 2 mg of sample was loaded onto a
small Pt sample holder and pumped out to a vacuum of
about 10−6 mbar. After prefluorination of the sample
chamber overnight, the samples were heated with a CO2
laser in 50 mbar of pure F2. Excess F2was separated from
the O2 produced by conversion to Cl2 using KCl held at
150°C. The extracted O2was collected on a molecular sieve
(13×) and subsequently expanded into the inlet of a Finnigan MAT 253 isotope ratio mass spectrometer. Oxygen isotope
compositions are given in the standardδ notation, expressed
relative to the Vienna Standard Mean Ocean Water in per
mill (‰). Replicate oxygen isotope analyses of the standard
used (Ls-1 Qtz, n=6) had an average precision of ±0.08‰
(one sigma) for δ18O. The accuracy of δ18O values is
commonly better than 0.2‰ compared to accepted δ18O
values for NBS-28 of 9.64‰ and UWG-2 of 5.8‰ (Valley
et al. 1995). The C– and O– isotope composition of the
carbonates was measured with a GasBench II connected to a Finnigan MAT DeltaPlus XL mass spectrometer, using a He-carrier gas system according to a method adapted after Spoetl
and Vennemann (2003). Sample values were normalized
using an in-house standard calibrated againstδ13C andδ18O
values of NBS-19 (+1.95‰ and −2.20‰, relative to Vienna PeeDee Belemnite (VPDB)). External reproducibility for the analyses estimated from replicate analyses of the in-house
standard (n=6) is ±0.07‰ for δ13C and 0.08‰ for δ18
O.
Skarns and gold quartz veins in the Nambija district
Exoskarn and endoskarn have replaced the Piuntza unit lithologies and the outer parts of the porphyritic intrusions, respectively. The endoskarn shows a gradual transition to an inner potassic alteration zone within the porphyritic intrusions, whereas the garnet-pyroxene exoskarn grades into an outer zone of K and Na metasomatism affecting the Piuntza unit volcanosedimentary rocks.
Endoskarn in porphyritic intrusion and inner potassic alteration
An endoskarn consisting of K-feldspar, actinolite, diopside, Na-rich plagioclase, titanite, quartz, apatite, and pyrite occurs at the margins of the porphyritic quartz-diorite intrusion at
Fortuna (Markowski et al. 2006). Na-rich plagioclase and
potassium feldspar have replaced the groundmass (up to
5.3 wt.% Na2O and 3.6 wt.% K2O) and the cores of the
Ca-rich plagioclase phenocrysts. Hornblende has generally not been replaced except very locally where it is replaced by actinolite and very minor diopside. The best-studied example with inner potassic alteration occurs at Fortuna, where the main alteration assemblage consists of K-feldspar + titanite
and subordinate biotite + magnetite. K2O concentrations
can be as high as 4.8 wt.%. Potassic feldspar typically has replaced most of the groundmass and forms overgrowths on the plagioclase phenocrysts, occasionally completely replacing it. Hornblende is mostly unaltered, only locally having been replaced by K-feldspar + titanite and sub-ordinately by biotite + magnetite and/or titanite.
Quartz ± K-feldspar veins up to 1 cm thick occur in the
porphyritic quartz-diorite intrusion at Fortuna (Fig. 3) and
have a low sulfide (pyrite only) content (<1%). These veins
show similar features to the“B veins” of porphyry systems
(nomenclature of Gustafson and Hunt 1975) but are more
continuous because they can be followed for several meters along an average NE–SW orientation with steep dips. The
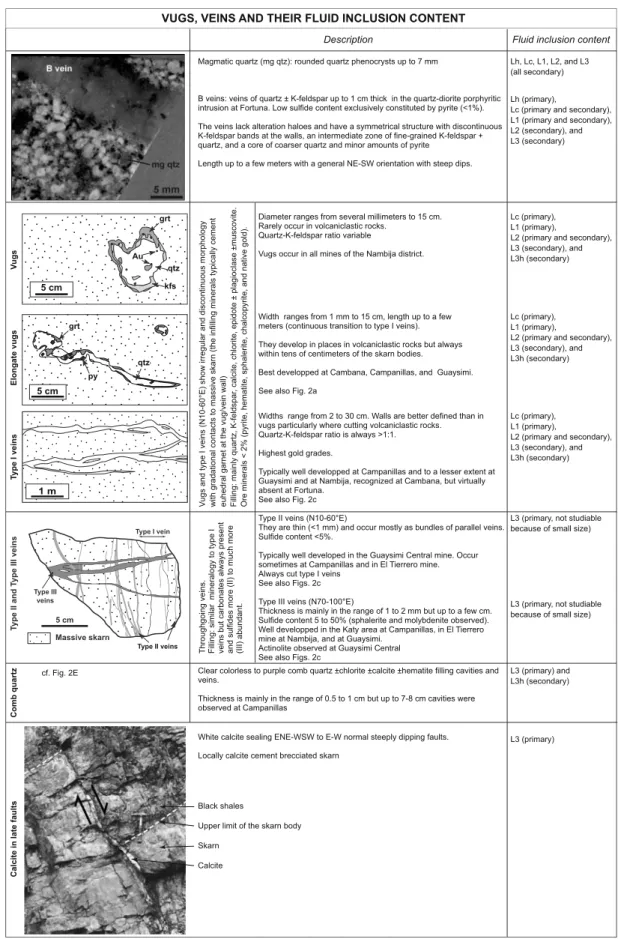
Diameter ranges from several millimeters to 15 cm. Rarely occur in volcaniclastic rocks.
Quartz-K-feldspar ratio variable
Vugs occur in all mines of the Nambija district.
Width ranges from 1 mm to 15 cm, length up to a few meters (continuous transition to type I veins). They develop in places in volcaniclastic rocks but always within tens of centimeters of the skarn bodies. Best developped at Cambana, Campanillas, and Guaysimi. See also Fig. 2a
Widths range from 2 to 30 cm. Walls are better defined than in vugs particularly where cutting volcaniclastic rocks. Quartz-K-feldspar ratio is always >1:1. Highest gold grades.
Typically well developped at Campanillas and to a lesser extent at Guaysimi and at Nambija, recognized at Cambana, but virtually absent at Fortuna.
See also Fig. 2c
T ype I veins 1 m V ugs Au 5 cm grt qtz kfs Elongate vugs 5 cm py grt qtz V
ugs and type I veins (N10-60°E) show irregular and discontinuous morphology
with gradational contacts to massive skarn (the infilling minerals typically cement euhedral garnet at the vug/vein wall) Filling: mainly quartz, K-feldspar
, calcite, chlorite, epidote ± plagioclase ±muscovite.
Ore minerals < 2% (pyrite, hematite, sphalerite, chalcopyrite, and native gold).
Fluid inclusion content Magmatic quartz (mg qtz): rounded quartz phenocrysts up to 7 mm
B veins: veins of quartz ± K-feldspar up to 1 cm thick in the quartz-diorite porphyritic intrusion at Fortuna. Low sulfide content exclusively constituted by pyrite (<1%). The veins lack alteration haloes and have a symmetrical structure with discontinuous K-feldspar bands at the walls, an intermediate zone of fine-grained K-feldspar + quartz, and a core of coarser quartz and minor amounts of pyrite
Length up to a few meters with a general NE-SW orientation with steep dips. Description
Lh, Lc, L1, L2, and L3 (all secondary)
Lc (primary), L1 (primary),
L2 (primary and secondary), L3 (secondary), and L3h (secondary) Lh (primary),
Lc (primary and secondary), L1 (primary and secondary), L2 (secondary), and L3 (secondary)
Lc (primary), L1 (primary),
L2 (primary and secondary), L3 (secondary), and L3h (secondary)
Lc (primary), L1 (primary),
L2 (primary and secondary), L3 (secondary), and L3h (secondary)
Type II veins (N10-60°E)
They are thin (<1 mm) and occur mostly as bundles of parallel veins. Sulfide content <5%.
Typically well developed in the Guaysimi Central mine. Occur sometimes at Campanillas and in El Tierrero mine. Always cut type I veins
See also Figs. 2c Type III veins (N70-100°E)
Thickness is mainly in the range of 1 to 2 mm but up to a few cm. Sulfide content 5 to 50% (sphalerite and molybdenite observed). Well developped in the Katy area at Campanillas, in El Tierrero mine at Nambija, and at Guaysimi.
Actinolite observed at Guaysimi Central See also Figs. 2c
Type II veins
Throughgoing veins. Filling: similar mineralogy to type I veins but carbonates always present and sulfides more (II) to much more (III) abundant.
Calcite in late faults
Clear colorless to purple comb quartz ±chlorite ±calcite ±hematite filling cavities and veins.
Thickness is mainly in the range of 0.5 to 1 cm but up to 7-8 cm cavities were observed at Campanillas
Comb quartz
1 cm
White calcite sealing ENE-WSW to E-W normal steeply dipping faults. Locally calcite cement brecciated skarn
Skarn Calcite Black shales
Upper limit of the skarn body
L3 (primary, not studiable because of small size)
L3 (primary, not studiable because of small size)
L3 (primary) and L3h (secondary)
L3 (primary) VUGS, VEINS AND THEIR FLUID INCLUSION CONTENT
cf. Fig. 2E
Fig. 2 Main features of retrograde vugs and veins (modified from Fontboté et al.2004). Fluid inclusion types hosted in the infilling minerals are also indicated
veins lack alteration haloes and have a symmetrical structure with discontinuous K-feldspar bands at the walls, an intermediate zone of fine-grained K-feldspar + quartz, and a core of coarser quartz and minor amounts of pyrite.
At Campanillas, the endoskarn (although not completely obliterating the original rock texture) is more developed, with hornblende replaced by diopside and titanite (euhedral and twinned grains up to 7 mm in size) and diopside that has, in turn, been replaced by actinolite.
Garnet-pyroxene exoskarn and outer potassic-sodic alteration
The exoskarn occurs as massive, coarse-grained, and usually concordant bands that replaces mainly fine-grained
volcaniclastic rocks (Fig.2a). Less reactive or less permeable
rock units such as quartzite, shale, and black shale are generally not skarnified. Carbonate rocks have only been recognized in drill core at the Nambija-El Diamante prospect and as a 30-cm-long and 5-cm-thick lens in massive garnet
skarn at Guaysimi. At Fortuna, Markowski et al. (2006)
recognized rare bioclasts.
The following main exoskarn types occur in the Nambija
district (modified from Fontboté et al.2004and Markowski
et al.2006). An almost monomineralic massive brown garnet
skarn (Ad20–98) forms the main part of the calc-silicate
bodies. A green pyroxene (Di46–92Hd17–42Jo0–19)-epidote
skarn has developed at the margin of the brown garnet skarn at the outcrop scale and at the deposit scale at Fortuna. Patches of blue–green skarn occur within the brown garnet skarn as transitions to areas affected by retrograde alteration
(Fig.2a). The blue–green garnet skarn consists of
dominant-ly euhedral granditic garnet (Ad9–99), with minor amounts of
pyroxene and epidote, in a matrix of anhedral milky quartz
with occasional K-feldspar (Fig.2b, d). All skarn types and
volcaniclastic rocks are crosscut by honey-yellow andraditic
garnet bands (Ad29–100), which occur also as clusters.
A halo of K and Na metasomatism affects the volcani-clastic rocks of the Piuntza unit at the outer margin of the
exoskarn (Markowski et al. 2006). Mineral associations
related to K and Na metasomatism include Na-rich plagioclase, K-feldspar, pyroxene, actinolite with minor epidote, titanite, and rare garnet. Approaching the skarn, the original volcaniclastic texture is progressively obliterated, with 0.5- to 2-cm-thick discontinuous K-feldspar-albite/ oligoclase rims against the pyroxene-epidote skarn and more exceptionally against the brown garnet skarn.
Retrograde stage and gold quartz veins
Gold mineralization is associated with the retrograde stage of the skarn, which is weakly developed and does not obliterate the prograde stage textures. Minerals of the retrograde stage are quartz, K-feldspar, calcite, chlorite, and
hematite, ±plagioclase, ±muscovite, plus minor amounts of epidote, pyrite, chalcopyrite, hematite, sphalerite, and gold. The retrograde overprint occurs mainly as mineral infillings in structurally controlled (N 010°–060° E) elongated vugs and up to several-centimeters-wide quartz-bearing veins of
type I, type II, and type III (Figs.2a, c, d and 3). Anhedral
milky quartz, similar to that forming the matrix of the blue– green garnet skarn, constitutes most of the filling of vugs and
type I veins (Fig.2a, c, d and3). Garnet occurs locally on the
vug walls and in type I veins, suggesting a continuous transition from blue–green garnet skarn to type I veins. Gold deposition occurred preferentially in vugs and types I and II veins where hematite is the only opaque mineral in addition
to native gold (Fig. 2c). Later sulfide-rich type III veins,
which contain more than 50% of total sulfides (mainly
pyrite) of the deposits, do not contain gold (Figs.2c and3).
A late barren assemblage of clear colorless to purple comb quartz, ±chlorite, ±calcite, and ±hematite filling cavities and
veins has been identified mainly in Campanillas (Fig.2e).
The late retrograde stage is also recognized in the porphyritic intrusions, both in the endoskarn and the inner potassic zone. It is characterized by the formation of chlorite + epidote at the expense of diopside and early actinolite and of sericite + quartz at the expense of K-feldspar. Small amounts of euhedral pyrite and subordinate
Fig. 3 Selected samples from the Nambija district showing typical skarn, vein, and retrograde mineral fabrics. a Massive brown garnet skarn (bsk) in fine-grained Na-metasomatized volcaniclastic rocks (vr). Patches of blue–green garnet skarn (bgsk) occur within the brown garnet skarn and show transition to vugs and elongated vugs mainly filled with milky quartz (core) and K-feldspar (walls). Sample DTR361, Guaysimi central pit. b Photomicrograph of blue–green garnet skarn. Euhedral anisotropic granditic garnet (grd) with isotropic late honey-yellow andraditic garnet overgrowth (ad) occurs in a matrix of milky quartz (qtz). The red arrows show a vein (type II) filled with quartz showing the same crystallographic orientation as host milky quartz. Sample DTR380, Campanillas mine (transmitted light, crossed polars). c Photograph of typical irregular high-grade type I vein in brown garnet skarn (bsk) in Guaysimi central pit. The vein is cut parallel to strike. It is mainly filled with K-feldspar (kfs) and Na-rich plagioclase (pl) at the walls and milky quartz (qtz) in the core. Other retrograde minerals are chlorite (chl) and hematite (hm). Gold (Au) builds grains up to several millimeters in size. The type I vein is cut by a thin type II vein and by late sulfide-rich type III veins. Sample DTR365. d Photomicrograph of milky quartz and K-feldspar filling a vug within the brown garnet skarn. Sample DTR334, Cambana mine (transmitted light, crossed polar). e Photograph of comb quartz (comb qtz) and hematite filling cavities within the brown garnet skarn. Sample DTR37, Campanillas mine. f Photomicrograph of calcite and zoned chlorite with yellowish Mg-rich core (Mg-chl) and dark green Fe-rich rims (Fe-chl), at the contact with late honey-yellow garnet in a type I vein. The garnet grain is zoned from andraditic core (ad grt) to granditic rim (gr grt). Sample DTR327, Campanillas mine (transmitted light, parallel polars). g Photomicro-graph showing Mg-rich pale chlorite replacing preferentially diopsidic pyroxene (px) in pyroxene-rich blue–green garnet skarn. Sample DTR309, Cambana mine (transmitted light, parallel polars)
chalcopyrite as disseminations and in through-going veins
(type III veins, Fig.3) are ascribed to this alteration stage.
Fluid inclusions: previous studies
Shepherd (1988 in Litherland et al.1994, 2000 in
Prodeminca2000; personal communication 2003) carried
out the first fluid inclusion study on the Nambija
mineral-ization. He measured two-phase fluid inclusions in quartz from gold-bearing veins obtaining minimum trapping temperatures of between 220°C and 150°C and salinities ranging from 2 to 12 wt.% eq. NaCl with the mode at 2– 4 wt.% eq. NaCl. Calcite occurring in the same veins displayed lower homogenization temperatures (140– 130°C) and higher salinities (15–24 wt.% eq. NaCl). Laser ablation inductively coupled plasma mass spec-trometry bulk analyses of the low-salinity fluid inclusions
from molybdenite-bearing quartz veins (our type III veins) of El Tierrero mine indicate low Fe, Pb, and Zn contents with, in places, presence of chalcopyrite grains (Shepherd
2000 in Prodeminca2000).
Fluid inclusions: results from this study
Data of 355 fluid inclusions are presented and discussed, of
which 85 are from the study of Markowski et al. (2006).
Data were collected on fluid inclusions from skarn samples (n=244) and from magmatic quartz of the potassic alteration zone and/or endoskarn in the Campanillas (n=51) and Fortuna (n=44) porphyritic intrusion, as well as from B veins related to K-alteration at Fortuna (n=16). Part of the data set
has been preliminarily discussed by Fontboté et al. (2004).
Fluid inclusions of the skarn samples were investigated in skarn minerals (pyroxene, garnet, epidote, quartz), in calcite from vugs and type I veins, and in calcite from late faults of samples collected at Fortuna (n=85), Cambana (n= 34), Campanillas (n = 44), Nambija (n = 19), and Guaysimi (n = 62). Garnet of the dominant brown skarn is too opaque (in part due to the presence of titanium oxide needles) for fluid inclusion studies. No fluid inclusions could be analyzed from type II and type III veins due to their small size (<3 µm).
In general, the fluid inclusions were difficult to characterize because they are both rare and small. An approach based on “Fluid inclusion assemblages” (Goldstein and Reynolds
1994) could not be applied. In addition, aberrant minimal
temperature and trapping pressures and certain shapes (see below) suggest compositional and density re-equilibration. Despite these limitations, consistent fluid inclusion popula-tions could be identified by selecting the most reliable data, on which the present study is based.
Fluid inclusions have been divided into five populations (Lh, Lc, L1, L2, and L3h) on the basis of host mineral, number of phases at room temperature, and
microthermomet-ric and Raman analysis (Figs.4and 5 and Tables 1and 2).
Below, a detailed description of each one of these popula-tions is given.
Type Lh fluid inclusions
Halite-bearing type Lh fluid inclusions (Fig.4a, b, c) occur
in pyroxene from both green pyroxene-epidote skarn and endoskarn, in magmatic quartz of altered porphyritic intru-sions, and rarely in quartz from B veins in porphyritic intrusions. They have diameters from 5 to 25 µm and contain up to five solid phases. In addition to halite, which typically crystallizes as cubes, sylvite and hematite have been identified
(Fig.4a, b). Other translucent, roundish, acicular, or
hex-agonal mineral phases could not be identified by Raman
spectrometry. Some of them melt at higher temperatures than the melting temperature of halite, and others are not affected by heating. They are possibly iron chlorides. Type Lh fluid inclusions in pyroxene and in fine-grained quartz of B veins are primary. Those in magmatic quartz from altered porphyritic intrusions are considered to be secondary. Type Lh fluid inclusions in magmatic quartz, and to a lesser extent in B vein quartz, show re-equilibration and necking
down features (Fig.4b, c) with variable vapor-to-liquid and
liquid-to-salt ratios, the vapor bubble being occasionally absent. No microthermometric analyses could be carried out on fluid inclusions in pyroxene of the endoskarn because of the opacity of the mineral.
Melting temperatures of halite (±sylvite) indicate salin-ities between 30.9 and 65.6 wt.% eq. NaCl. The vapor bubble in pyroxene Lh fluid inclusions represents 10% to 30% of the inclusion volume. Most pyroxene Lh inclusions homogenize to the liquid phase by bubble disappearance between 412°C and >600°C (i.e., above the working limit of the fluid inclusion stage) with a strong mode between
430°C and 490°C (Fig. 5). Four fluid inclusions show
temperature of bubble disappearance of <400°C and in one case halite dissolution occurs after the bubble disappear-ance at the final phase transition, suggesting necking down or re-equilibration processes.
In all studied Lh fluid inclusions in magmatic quartz from the altered porphyritic intrusions, bubble disappear-ance occurs before halite melting, between 107°C and 192°C. Most of them decrepitated before total homogeni-zation, possibly due to the high internal pressure charac-teristic of homogenization by halite melting (Bodnar
1994). This feature, the extreme range of measured halite
melting temperatures (187 to >>450°C, which corresponds to 31.2 to >>53 wt.% eq. NaCl), and the low temperature of bubble disappearance all point to necking down and/or
re-equilibration processes (Fig.4b, c). Because of their small
size, only one measurement could be made in Lh fluid inclusions from a B vein which gave a salinity of 65.6 wt.% eq. NaCl and a homogenization temperature of >600°C.
Type Lc fluid inclusions
Type Lc consists of fluid inclusions in which CO2has been
identified by microthermometry or Raman spectroscopy. Lc
fluid inclusions include relatively CO2-rich inclusions in
magmatic quartz (secondary, in part along fractures) and in B vein quartz (primary and secondary) of altered porphy-ritic intrusions. Another type of Lc primary fluid inclusions,
which is characterized by very low CO2 concentration
(probably less than ~1 mol% since no phase transition
involving CO2is observed by microthermometry, the CO2
being only identified by Raman spectroscopy), occurs in endoskarn pyroxene (coexisting with primary Lh
inclusions), blue–green skarn garnet, and milky quartz of vugs and type I veins. The size of the Lc inclusions varies from 5 to 20 µm with a gas-to-liquid ratio between 0.2 and 1 and they do not contain any daughter mineral. A
significant part of CO2-rich Lc fluid inclusions occurring
in magmatic quartz and spatially associated with Lh inclusions shows re-equilibration and necking down fea-tures similar to those observed in Lh inclusions. An Lc fluid inclusion surrounded by clusters of small inclusions is
shown in Fig.4e. This feature is typical for re-equilibration
under conditions of internal underpressure due to nearly isothermal compression or to isobaric cooling (Vityk and
Bodnar1995). The first process is unlikely to have occurred
at Nambija since there are no indications of deformation that might suggest compression during the <1-My lifetime of the Nambija magmatic-hydrothermal system (Chiaradia
et al.2009).
Melting temperatures of CO2-rich phases are between
−59.5°C and −57.7°C pointing to the presence of volatile
species other than CO2. Melting temperatures of clathrate,
when observable, range from −4.7°C to 10.7°C and CO2
homogenization temperatures, when observable, range from −25°C to 29.9°C and occur to the gas or liquid phase.
Raman spectrometry analyses were conducted on 43 Lc
fluid inclusions (Table2). Among the volatile phases, CO2
is dominant (with 94 to 100 mol%) and N2makes up to 6%
of the volatile phase. H2S was identified in 40% of the
inclusions and traces of CH4 were recorded in two fluid
inclusions from magmatic quartz of the porphyritic intru-sions. Modeling of bulk compositions of aqueous-carbonic fluid inclusions using melting temperature of ice and clathrate and homogenization temperature of the volatile
phase indicate that water, CO2, and N2contents are in the
range of 98.4 to 44.1, 55 to 1.6, and 1.3 to 0.0 mol%,
10 µm
A
10 µmB
20 µmC
5 µmD
20 µmE
5 µmF
NaCl KCl NaCl KCl Fe-chloride? hm NaCl S VFig. 4 Photomicrographs of the main fluid inclusion types. a Halite-bearing (NaCl) and sylvite-Halite-bearing (KCl) Lh fluid inclusion in pyroxene in blue–green garnet skarn (sample DTR135, Fortuna Cuerpo 3). b Multisolid (salts and hematite) Lh secondary fluid inclusions in magmatic quartz of the Campanillas altered porphyritic intrusion. The inclusions show sealed thin connecting tubes (arrows) typical for necking down phenomena. Note also a lower vapor-to-liquid ratio than in a (sample DTR69). c Halite-bearing Lh secondary fluid inclusions showing necking down in magmatic quartz of the Campanillas altered porphyritic intrusion. Necking down occurred
after the formation of the daughter crystals (sample DTR69). d High-density aqueous-carbonic Lc fluid inclusion in magmatic quartz of the Fortuna altered porphyritic intrusion (sample DTR64). e Aqueous-carbonic Lc fluid inclusion deformation of the walls (arrow) and a halo of small secondary fluid inclusions in magmatic quartz of the Campanillas altered porphyritic intrusion (sample DTR69). These features are typical for re-equilibration under conditions of internal underpressure. f Aqueous liquid-rich L1 fluid inclusion in garnet of the blue–green garnet skarn (sample DTR135, Fortuna Cuerpo 3)
respectively, with salinities between 20 and 1.9 wt.% eq. NaCl. The bulk composition of type Lc fluid inclusions, for which not all microthermometric parameters could be measured because of low volatile content or poor con-ditions of observation, was calculated ignoring salts. Type Lc fluid inclusions affected by necking down in the magmatic quartz of the altered porphyritic intrusions show
strong dispersion of densities and CO2contents, and most
of them decrepitate before homogenization. Total homog-enization occurs to the liquid, critical, or vapor phase between 565°C and 294°C. Fluid inclusions showing the highest temperature homogenize to the vapor phase and occur in magmatic quartz of the altered porphyritic
intrusions and in B veins. It should be noted that fluid inclusions showing re-equilibration features were ob-served only in the magmatic quartz and to a lesser extent in B veins and in pyroxene of the pyroxene-epidote skarn, i.e., re-equilibrated fluid inclusions appear to be the “oldest” and trapped at the highest temperatures.
Some Lc inclusions have CO2contents so low that it was
only identified by Raman spectroscopy. These CO2-poor
inclusions do not show re-equilibration or necking down features and frequently occur together with two-phase aqueous fluid inclusions, in particular in garnet of the blue– green skarn, suggesting that there is a transition between Lc and L1/L2 fluid inclusions.
0 100 200 300 400 500 600 0 10 20 30 40 50 60
Salinity (wt% eq. NaCl)
Th (°C)
Magmatic qtz (secondary) qtz-kfs B vein
Pyroxene Blue-green skarn garnet and epidote honey-yellow cluster grt + ep
Milky quartz
Calcite in vugs and type I veins Calcite in late faults 0 100 200 300 400 500 600 Th (°C) L3 (low temperature, homogenization to vapor) L3h (low temperature, halite-bearing) Lh (halite-bearing) Lc (CO2-bearing) L1 (homogenization to liquid) L2 (homogenization to vapor)
A
B
Comb quartz Late honey-yellow garnet Blue-green skarn garnet * wt% eq. CaCl2Fig. 5 Binary plots of tempera-ture of liquid or vapor disap-pearance (Th) vs. salinity. a Data ordered by fluid inclusions type (nomenclature is explained in the text). b Same data ordered by host mineral. Earlier aqueous-carbonic fluid inclu-sions are not presented as their high internal density resulting from necking down leads to decrepitation before total homogenization. Asterisk, for this field, the CaCl2equivalent instead of NaCl equivalent has been plotted for fluid inclusions in calcite, comb quartz, and secondary fluid inclusions in magmatic quartz of this field
T able 1 Summary of microthermometric data of fluid inclusions from the Nambija skarn deposits Stage Fluid inclusion type Host mineral Location Number Microthermometric data Tm CO 2 (°C) Th CO 2 (°C) Tm ice (°C) Tm cl (°C) Tm NaCl (°C) Tm KCl (°C) Th L – V (°C) Th total (°C) Salinity Prograde stage Lh high-temperature, halite bearing Pyroxene a, B vein quartz Fortuna, Cambana, Nambija-El Playon, Nambija-El T ierrero 48 –– − 26 to − 49 – 542 to 180 107 to 53 >600 to 412 >600 to 412 65.6 to 30.9 wt.% eq. NaCl Lh with possible necking down Pyroxene, magmatic quartz b Fortuna, Cambana, Campanillas 9 –– – – >450 to 187 – 379 to 107 >450 to 187 >53 to 31.2 wt.% eq. NaCl Prograde stage and retrograde stage over 310°C Lc high to intermediate temperature, CO 2 bearing Magmatic quartz**, B vein quartz, blue – green skarn garnet, milky quartz
Fortuna, Campanillas, Guaysi
34 − 57.7 to −59.5 29 to − 25 − 1.1 to − 15.2 8.2 to − 4.7 –– 565 to 294 565 to 294 18.8 to 1.9 wt.% eq NaCl Lc with possible necking down Magmatic quartz b Fortuna 9 − 58.1 to −59.3 29.8 to 27 – 10.7 to − 1.5 –– 420, 443 c 420, 443 c 20 to 4.3 wt.% eq. NaCl L1 intermediate temperature, vapor rich, aqueous Blue –green skarn and blue –green skarn and cluster epidote, milky quartz, B vein quartz, and magmatic quartz b
Fortuna, Campanillas, Nambija-El T
ierrero, Guay-simi 11 –– − 0.6 to − 13.6 –– – 513 to 341 513 to 341 17.4 to 1.0 wt.% eq. NaCl L2 intermediate temperature, liquid rich, aqueous Blue –green skarn and cluster garnet, cluster epidote, pyroxene, milky quartz, B vein quartz, and magmatic quartz b Fortuna, Cambana,
Campanillas, Nambija-El Playon,
Nambija-El T ierrero, Guaysimi 32 –– − 1.2 to − 21 –– – 455 to 318 455 to 318 23.0 to 2.1 wt.% eq. NaCl Retrograde stage below 310°C L3 low temperature, liquid rich, aqueous Comb quartz, calcite from vug, milky quartz b, B vein quartz b, and magmatic quartz b
Fortuna, Campanillas, Guaysimi
169 –– − 0.1 to − 31 –– – 302 to 94 302 to 94 23 to 0.2 wt.% eq. NaCl 21.5 to 25.2 wt.% eq. CaCl2 d L3h low temperature, halite bearing Comb quartz and milky quartz b Fortuna, Campanillas 9 –– – – >420 to 175 – 217 to 105 >420 to 175 30.8 to >50.0 wt. % eq. NaCl Late faults L3 low temperature, liquid rich, aqueous Calcite in late fau Guaysimi 34 –– – – – – 205 to 74.5 205 to 74.5 21.1 to 17.3 wt.% eq. NaCl Fluid inclusion types are defined in the text. Italic denotes necking down TmCO 2 melting temperature of solid CO 2 , Th CO 2 homogenization temperature of CO 2 , Tm ice melting temperature of ice, Tm cl melting temperature of clathrate, Tm NaCl melting temperature of halite, Tm KCl melting temperature of sylvite, Th L– V temperature of liquid or vapor bubble disappearance a Always primary bAlways secondary cOnly two values most of the fluid inclusions decrepitate before homogenization d Salinities were calculated in the H2 O –CaCl 2 system when Tm ice is below − 21.1°C
T able 2 Chemical compositions obtained by Raman spectroscopy of selected fluid inclusions and corresponding microthermometric data, from the Nambija ska rn deposits Sample and reference inclusion Host mineral Microthermometry V olatile phase Density (g/cm 3 ) Bulk composition NaCl (wt. %) Density (g/cm 3 ) Tm CO 2 Tm ice Tm cl Th CO 2 Mode Th Mode % vol. CO 2 CH 4 N2 H2 SH 2 OC O2 CH 4 N2 NaCl DTR64-8136-2.1.1 Magmatic quartz a − 58.9 no no 27.3 L 27.3 L 100 95.3 0.0 4.7 – 0.70 0.0 95.3 0.0 4.7 0.0 0.0 0.70 DTR64-8137-2.1.1 − 58.2 no − 1.5 29.5 V >250 L 2 0 97.5 0.0 2.5 − 0.26 88.3 5.0 0.0 0.0 6.7 20.0 0.94 DTR64-8137-3.1.1 − 58.1 no 5.1 29.0 L >240 no 40 98.4 0.0 1.6 X 0.55 78.5 18.6 0.0 0.3 2.6 9.5 0.89 DTR64-8137-3.2.1 − 58.2 no 10.7 29.8 L d – 30 100.0 0.0 0.0 X 0.66 87.4 12.6 0.0 0.0 0.0 0.0 0.88 DTR64-8137-3.3.1 − 59.3 no 2.9 29.4 L d – 80 98.3 0.0 1.7 – 0.55 43.2 53.9 0.0 0.9 2.0 13.2 0.76 DTR184a-1.1.1 − 58.9 no 8.1 29.9 L >270 – 40 97.4 0.0 2.6 X 0.56 80.2 18.3 0.0 0.4 1.1 4.3 0.88 DTR184a-1.2.2 − 58.5 no 2.1 no no 443 C 2 0 98.5 0.0 1.5 – 0.03 98.0 2.0 0.0 0.0 0.0 0.0 0.83 DTR184a-1.2.6 − 59.3 no 2.9 27.0 V d – 20 97.7 0.0 2.3 – 0.23 90.7 5.0 0.0 0.1 4.2 13.1 0.92 DTR184a-1.4.1 − 59.3 no 7.3 28.4 L 420 V 3 0 96.4 0.0 3.6 – 0.58 84.4 13.6 0.0 0.4 1.6 6.0 0.92 DTR64-8136-2.2.1 − 59.1 no no 21.0 V 21.0 V 100 97.5 0.0 2.5 X 0.21 0.0 97.5 0.0 2.5 0.0 0.0 0.21 DTR64-8136-2.2.3 − 58.3 no no − 25.0 V − 25.0 V 100 99.4 0.0 0.6 X 0.04 0.0 99.4 0.0 0.6 0.0 0.0 0.04 DTR64-8136-2.2.6 no no no − 5.0 V − 5.0 V 100 99.0 0.0 1.0 X 0.09 0.0 99.0 0.0 1.0 0.0 0.0 0.09 DTR64-8137-1.1.1 − 58.9 no 7.2 21.0 V 329 V 7 0 94.3 0.0 5.7 X 0.16 81.7 15.8 0.0 0.8 1.7 5.8 0.42 DTR64-8137-1.1.2 − 58.7 no 6.5 12.8 V >270 V 7 0 100.0 0.0 0.0 – 0.15 82.6 15.6 0.0 0.0 1.8 6.6 0.41 DTR64-8137-1.2.1 − 58.9 no 5.3 21.4 V 294 V 7 0 99.4 0.0 0.6 X 0.20 77.5 20.2 0.0 0.1 2.2 8.9 0.46 DTR64-8137-1.3.1 − 59.3 no no 22.0 V 22.0 V 100 97.9 0.0 2.1 X 0.22 0.0 97.9 0.0 2.1 0.0 0.0 0.22 DTR64-8137-1.3.2 − 58.9 no no 21.0 V d – 100 98.8 0.0 1.2 – 0.21 0.0 98.8 0.0 1.2 0.0 0.0 0.21 DTR64-8137-2.2.1 − 57.7 no 1.9 29.0 V 426 L 5 0 98.4 0.0 1.6 – 0.26 82.7 12.7 0.0 0.2 4.4 14.6 0.68 DTR69-5.2.1 no no no no no 371 V 7 0 98.1 0.0 1.9 X n c n c n c n c n c n c n c n c DTR184a-1.2.1 − 58.1 − 5.1 1.2 no no 406 C 4 0 98.5 0.0 1.5 X 0.04 95.4 2.9 0.0 0.0 1.7 5.5 0.62 DTR184a-1.2.5 − 58.3 no 4.5 no no 447 C 3 0 97.3 0.0 2.7 – 0.04 97.3 2.7 0.0 0.0 0.0 0.0 0.73 DTR184a-1.4.4 − 59.5 no 7.5 no no 406 V 3 0 97.0 0.3 2.7 – 0.06 96.5 3.5 0.0 0.0 0.0 0.0 0.72 DTR184a-1.6.1 no no 5.5 no no 397 C 5 0 99.0 0.0 1.0 X 0.05 96.0 4.0 0.0 0.0 0.0 0.0 0.52 DTR184a-2.1.3 no no 3.9 no no 427 V 7 0 94.8 0.0 5.2 – 0.04 94.4 5.4 0.0 0.2 0.0 0.0 0.34 DTR184a-2.1.7 no no 8.2 no no 405 V 6 0 100.0 0.0 0.0 – 0.07 93.5 6.5 0.0 0.0 0.0 0.0 0.46 DTR184a-2.1.8 − 58.4 no 6.9 no no 506 V 5 0 99.3 0.0 0.7 X 0.06 95.5 4.5 0.0 0.0 0.0 0.0 0.55 DTR184a-2.1.10 no no 4.1 no no 468 V 5 0 98.2 0.0 1.8 – 0.04 96.5 3.5 0.0 0.0 0.0 0.0 0.53 DTR184a-2.1.13 no − 5.0 4.1 no no 448 V 5 0 97.7 0.0 2.3 – 0.05 94.3 4.2 0.0 0.1 1.4 4.7 0.55 DTR184a-2.1.14 no − 5.0 4.5 no no 422 V 5 0 97.0 0.0 3.0 X 0.06 94.2 4.3 0.0 0.1 1.4 4.6 0.55 DTR184a2.1.16 no − 4.0 7.1 no no 404 V 4 0 100.0 0.0 0.0 X 0.07 94.6 4.4 0.0 0.0 1.0 3.3 0.66 DTR184a-1.2.4 − 58.9 no 5.1 no no 407 L 3 0 96.1 0.0 3.9 – 0.05 97.2 2.8 0.0 0.0 0.0 0.0 0.71 DTR184a-1.6.3 − 59.2 no 5.5 14.5 V 366 L 5 0 97.0 0.0 3.0 X 0.16 88.0 9.2 0.0 0.2 2.6 8.6 0.60 DTR184a-2.1.1 no − 2.0 − 4.7 no no 355 L 3 0 97.0 0.0 3.0 X 0.02 96.8 1.6 0.0 0.0 1.6 5.2 0.72
Type L1 fluid inclusions
Type L1 fluid inclusions are vapor-rich two-phase aqueous fluid inclusions that homogenize to the vapor or critical phase between 513°C and 341°C. They occur in magmatic quartz of the altered porphyritic intrusions, in endoskarn pyroxene, in quartz of the B veins, in garnet and epidote from clusters and blue–green skarn, and in milky quartz of vugs and type I veins. They are primary in garnet, epidote, and milky quartz of vugs and type I veins and secondary in magmatic quartz of the altered porphyritic intrusions. Salinities range from 17.4 to
1.0 wt.% eq. NaCl and initial melting of ice below−21.1°C
indicates the presence of significant amounts of cations other
than Na+. The highest homogenization temperatures and
salinities were encountered in blue–green skarn garnet. Type L2 fluid inclusions
Type L2 fluid inclusions are two-phase liquid-rich aqueous fluid inclusions with vapor-to-liquid ratio between 0.2 and 0.5 having homogenization temperatures to the liquid phase in the range of 455°C to 318°C and salinities in the range of 23 to 2.1 wt.% eq. NaCl. They occur in magmatic quartz of the altered porphyritic intrusions, in B vein quartz, in
pyroxene, in late garnet and epidote from clusters (Fig.4f)
and blue–green skarn, and in milky quartz of vugs and type I veins. Type L2 fluid inclusions are primary in pyroxene,
late garnet, and epidote from clusters (Fig. 4f) and blue–
green skarn and in part in milky quartz of vugs and type I veins. Type L2 fluid inclusions in magmatic quartz of the altered porphyritic intrusions and most of those occurring in milky quartz of vugs and type I veins are secondary. Occasionally, L2 fluid inclusions contain a translucent solid that does not melt during heating and was identified as calcite by Raman spectroscopy. Initial melting of ice below −21.1°C indicates the presence of significant amounts of
cations other than Na+.
Type L3 fluid inclusions
Type L3 are two-phase liquid-rich aqueous fluid inclusions with low vapor content (vapor-to-liquid ratio around 0.05) and homogenization temperatures below 300°C. They constitute the most abundant fluid inclusion type and occur in all fluid-inclusion-bearing minerals except calc-silicates. They are primary only in late comb quartz and in cavities-and vein-filling calcite as well as in calcite sealing late normal faults. Type L3 fluid inclusions show initial melting
temperature of ice below−21.1°C and up to −52°C, which is
the eutectic of the H2O–NaCl–CaCl2system. Final melting
temperatures of ice are between −31°C and −0.1°C.
Salinities of fluid inclusions having melting temperature
of ice between−21.1°C and −31°C have been calculated in
DTR184b-1.4.1 no − 7.4 3.1 no no 413 V 4 0 97.6 0.0 2.4 – 0.06 93.8 3.7 0.0 0.1 2.4 7.8 0.66 DTR184b-1.4.2 no − 4.5 − 4.7 no no 414 V 5 0 98.6 0.0 1.4 – 0.02 96.3 2.1 0.0 0.0 1.6 5.2 0.52 DTR184b-1.4.3 no − 5.4 − 1.4 no no >520 V 4 0 98.2 0.0 1.8 – 0.03 95.7 2.5 0.0 0.0 1.8 5.9 0.62 DTR184b-1.4.4 no 3.5 no no 399 C 4 0 100.0 0.0 0.0 – 0.04 97.2 2.8 0.0 0.0 0.0 0.0 0.63 DTR184b-2.2.2 B vein quartz − 58.1 no no no no d – 100 96.4 0.0 3.6 – nc 0.0 96.4 0.0 3.6 0.0 0.0 nc DTR184b-2.2.4 − 58.0 no no no no d – 100 96.2 0.0 3.8 – nc 0.0 96.2 0.0 3.8 0.0 0.0 nc DTR184b-2.2.5 − 58.0 no 3.7 5.0 V 565 V 5 0 98.4 0.0 1.6 – 0.1 1 89.1 7.3 0.0 0.0 3.6 1 1.6 0.60 DTR 136-3.1.3 BGSK garnet ** no − 15.2 no no no 454 L 3 0 92.7 0.0 7.3 – nc nc nc nc nc nc 18.8 0.71 DTR365-2-2.1.1 1 milky quartz no − 1.1 no no no 417 V 6 0 94.0 0.0 6.0 – nc nc nc nc nc nc 1.9 0.48 DTR365-2-2.1.13 no − 4.2 no no no 400 V 7 0 94.9 0.0 5.1 X n c n c n c n c n c nc. 6.7 0.57 Compositions are given in mole percent. All values are in degree Celsius. CO 2 detected only by Raman spectroscopy . Fluid inclusions where both Tm ice and ThCO 2 could not be measured had to be modeled without electrolytes (i.e., 0 wt.% eq. NaCl) TmCO 2 melting temperature of solid CO 2 , Th CO 2 homogenization temperature of CO 2 , Tm ice melting temperature of ice, Tm cl melting temperature of clathrate, Th homogenization temperature, L liquid, C critical, V vapor . Italic Th values decrepitation, d non-observed due to decrepitation, no not observed, X presence of H2 S, nc not computable and considered as aqueous fluid inclusion aAlways secondary bBlue –green skarn garnet
the H2O–CaCl2system. Thus, salinities range from 23.5 to
0.2 wt.% eq. NaCl and from 25.2 to 21.3 wt.% eq. CaCl2.
Type L3 fluid inclusions homogenize to the liquid phase in the range of 302°C to 74.5°C, the lowest Th and highest salinities typically being found in calcite from late faults
(Figs. 5 and 6). These L3 fluid inclusions are similar to
those analyzed by Shepherd (1988 in Litherland et al.,
1994; 2000 in Prodeminca2000; personal communication
2003).
Halite-bearing (up to 30% in volume) two-phase liquid-rich aqueous fluid inclusions have been defined as subtype L3h. They are recognized only at Fortuna and Campanillas, where they occur as primary fluid inclusions in comb quartz and in fractures together with L3 fluid inclusions, in magmatic quartz of the altered porphyritic intrusions, and
in milky quartz of vugs and type I veins. Vapor-to-liquid ratio is the same as in the L3 fluid inclusions (around 0.05). On heating, the vapor bubble disappears between 95°C and 217°C and total homogenization occurs by halite dissolu-tion between 175°C and >420°C, which corresponds to salinities between 30.8 and >50 wt.% eq. NaCl. Similar to Lh inclusions in magmatic quartz of the altered porphyritic intrusions, most of the L3h fluid inclusions decrepitate before total halite dissolution due to internal overpressures.
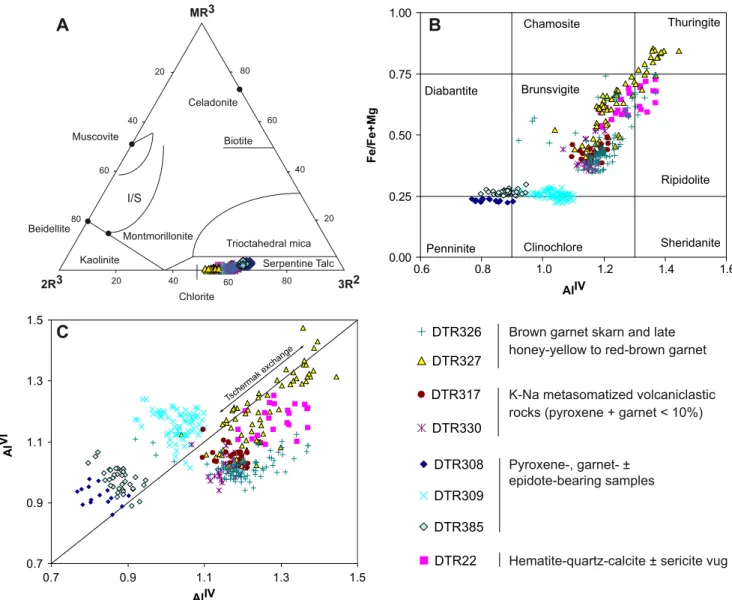
Chlorite thermometry
Chlorite is the most abundant Mg- and Fe-bearing phase of the retrograde mineral assemblage and replaces both
DTR327
DTR330 DTR317
DTR326 Brown garnet skarn and late honey-yellow to red-brown garnet
K-Na metasomatized volcaniclastic rocks (pyroxene + garnet < 10%)
DTR308 DTR309 DTR385
Pyroxene-, garnet- ± epidote-bearing samples
DTR22 Hematite-quartz-calcite ± sericite vug AlIV Fe /F e + M g Thuringite Chamosite Ripidolite Sheridanite Clinochlore Penninite Brunsvigite Diabantite
B
0.00 0.25 0.75 1.00 0.6 0.8 1.0 1.2 1.4 1.6 0.50 0.7 0.9 1.1 1.3 1.5 0.7 0.9 1.1 1.3 1.5 AlIV Al VIC
20 40 60 80 20 40 60 80 20 40 60 80 2R3 3R2 MR3 Beidellite Montmorillonite Celadonite Chlorite Serpentine Talc Biotite Muscovite Kaolinite Trioctahedral mica I/SA
Tschermak exch angeFig. 6 Chlorite geochemistry. a Triangular plot of Velde (1985) showing that almost all analyses plot in the field of chlorite (chlorite of samples DTR308 and DTR385 exhibits some Ca). I/S interstratified illite/smectite. MR3=K + Na + 2Ca, 2R3=(Al− (K + Na +2Ca)) / 2,
3R2 = Fe + Mg + Mn / 3. b Iron number vs. silica classification diagram of Foster (1962). c Octahedral alumina (AlVI) vs. tetrahedral alumina plot (AlIV)
pyroxene and garnet. It is finely intergrown with gold and calcite, suggesting a coeval formation with the latter. Under the optical microscope, the color of chlorite ranges from pale yellow to dark green reflecting variations in the Fe content, as previously noted at Fortuna (Markowski et al.
2006). Microprobe analyses were carried out on retrograde
chlorite to calculate formation temperatures using chlorite
geothermometers (Cathelineau1988, Jowett1991). To avoid
calcite contamination, only samples with relatively coarse-grained chlorite were selected from Cambana (DTR308, DTR309) and Campanillas (DTR22, DTR327, and DTR330;
see Fig. 7 and Table3). Chlorite structural formulae were
calculated on the basis of 14 oxygens.
In Velde’s (1985) diagram (Fig.7a), all samples plots in
the chlorite field, except samples DTR308 and DTR385, in which Ca contents are up to 0.04 cations point to a smectite
component. In Foster’s (1962) diagram, two chlorite groups
can be distinguished on the basis of chlorite Fe number and the occurrence of chlorite in association or not with pyroxene
(Fig.7):
– Chlorite in pyroxene-bearing samples (DTR308, DTR309, and DTR385) has low Fe numbers (0.22 to 0.3) and relatively high silica content with no
correla-tion between Fe number and Si. Manganese content varies from 0.13 to 0.26 cations. Chlorite from samples DTR308 and DTR385 contains up to 0.4 wt.% CaO indicating the presence of a smectite component. – Chlorite in pyroxene-free samples with variable garnet
contents (DTR22, DTR317, DTR326, DTR327, and DTR330) has Fe numbers ranging from 0.35 to 0.86, with variations also within single grains (samples
DTR326 and DTR327; Figs.2f and7). The Fe numbers
correlate positively with tetrahedral alumina (AlIV).
Manganese cation numbers vary from 0.62 to 3.10 and correlate weakly with iron and total alumina.
The same two groups are distinguished on the basis of the
ratio of AlVI to AlIV. In chlorite of pyroxene-free samples,
Al distribution (Fig. 7c) is governed by the “Tschermak
exchange” (MgVI
SiIV⬄ AlVIAlIV). The pyroxene-bearing
samples DTR308 and DTR309, however, show a negative correlation between the tetrahedral and octahedral alumina
(Fig. 7c), and tetrahedral Al distribution is a function of
vacancies in the octahedral site.
Cathelineau’s (1988) and Jowett’s (1991)
geothermom-eters are based on the tetrahedral alumina content, which, in principle, increases with temperature. The chlorite
-10 -5 0 5 0 5 10 15 20 25 30 Igneous calcite Marine limestone
Calcite in comb quartz cavities and veins Late faults calcite
B
-15 -10 -5 0 5 10 15
Milky quartz of gold-rich type I veins Milky quartz of other vugs and type I veins Type III veins
Comb quartz
Calcite of comb qtz cavities Late fault calcite
400±50°C 300±50°C 175±25°C 175±25°C 140±20°C
A
400±50°C Primary magmatic waterFig. 7 a Plot of oxygen isotope compositions of quartz and cal-cite from the Nambija skarns. Oxygen isotope compositions of the depositing fluids are calculated using the fraction-ation equfraction-ations of Matsuhisa et al. (1979) for quartz and O’Neil et al. (1969) for calcite using temperatures deduced from the fluid inclusion study. Field of primary magmatic water is from Sheppard (1986). b Plot of theδ13C andδ18O values of calcite from comb quartz cavities and veins and calcite in late faults. Fields of igneous calcite and marine limestone are from Bowman (1998)
geothermometer can be applied only if no smectite layers are intergrown with chlorite and for chlorite with Fe numbers <0.6. The chlorite of samples DTR308 and DTR385 contains smectite layers and is, therefore, unsuitable for geothermometry. Likewise, chlorite from pyroxene-free sam-ples cannot be used as a geothermometer because its Al distribution is governed by the Tschermak exchange and does not reflect the formation temperature (Cathelineau personal communication 2007). Sample DTR309 is the only sample meeting the criteria for chlorite geothermometry. However, correlation between tetrahedral and octahedral alumina is poor
(Fig. 7c) casting doubts on the calculated temperatures.
Chlorite analyzed by Markowski et al. (2006) at Fortuna
shows a similar pattern, with increasing Fe number and with
increasing tetrahedral alumina and Al distribution governed by the Tschermak exchange. The same concerns on the validity of the chlorite geothermometer may apply for the
temperatures published by Hammarstrom (1992) on Nambija
samples.
Stable isotope geochemistry
Samples and analytical techniques
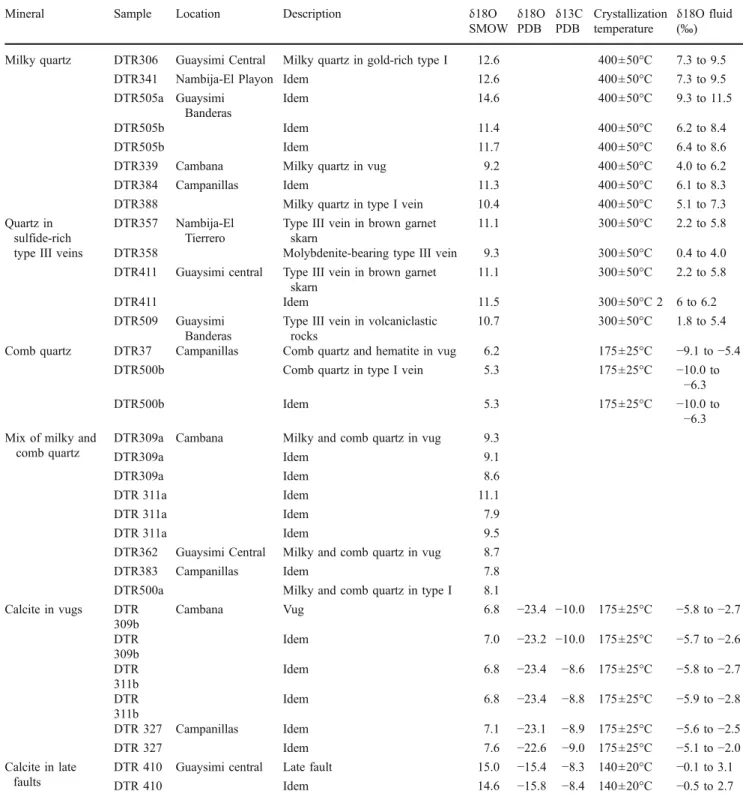
Oxygen isotope compositions were measured for milky quartz from vugs and type I veins, for quartz of type III veins, and for comb quartz of cavities and veins. Carbon
Table 3 Microprobe analyses and calculated formation temperature of representative various chlorite parageneses from the Nambija district
Sample label location DTR 327 DTR 327 DTR 22 DTR 22 DTR 317 DTR 330 DTR 385 DTR 309 DTR 308
4_16 6_11 3_3 1b_2 1_4 3_4 3_10 4_12 3_4
Campanillas mine Cambana mine
Strongly zoned chlorite in vugs from brown garnet skarn
Vug filled by chlorite, quartz, hematite, calcite, and sericite Chlorite replacing grt in KNa metasomatized volcaniclastic rocks Chlorite replacing px in blue–green garnet skarn Chlorite in type II vein in the green pyroxene-epidote skarn Chlorite in post-ore veinlets in green pxep skarn
SiO2 23.53 28.32 25.95 24.07 27.04 27.86 30.71 30.55 32.17 Al2O3 20.51 19.41 18.24 18.76 18.17 18.33 15.62 19.43 15.07 FeO 39.17 21.35 29.65 29.95 21.40 19.15 15.15 13.70 13.79 MgO 3.73 18.32 11.63 11.57 16.90 19.60 23.15 23.60 25.25 MnO 3.60 3.24 3.28 3.48 4.03 4.13 2.35 2.41 1.72 CaO 0.03 0.04 0.05 nd 0.09 nd 0.14 0.10 0.26 Na2O nd nd 0.05 nd nd nd 0.01 nd nd K2O 0.02 nd 0.11 0.02 0.02 0.01 0.01 nd 0.01 TiO2 0.02 0.03 nd 0.11 0.04 nd nd nd 0.01 H2Oa 9.4 9.3 11.1 12.1 12.3 10.9 12.9 10.2 11.7 Total 100.0 100.0 100.0 100.0 100.0 100.0 100.0 100.0 100.0
Structural formula on the basis of 14 oxygens
Si 2.64 2.85 2.81 2.66 2.85 2.85 3.11 2.97 3.17 AlIV 1.36 1.15 1.19 1.34 1.15 1.15 0.89 1.03 0.83 Al 2.71 2.31 2.33 2.44 2.26 2.21 1.86 2.22 1.75 AlVI 1.35 1.16 1.14 1.10 1.11 1.06 0.97 1.19 0.93 Fe 3.68 1.80 2.69 2.77 1.89 1.64 1.28 1.11 1.14 Mg 0.62 2.75 1.88 1.90 2.65 2.99 3.49 3.41 3.71 Mn 0.34 0.28 0.30 0.33 0.36 0.36 0.20 0.20 0.14 Ca 0.00 0.00 0.01 0.00 0.01 0.00 0.01 0.01 0.03 Na 0.00 0.00 0.01 0.00 0.00 0.00 0.00 0.00 0.00 K 0.00 0.00 0.01 0.00 0.00 0.00 0.00 0.00 0.00 Ti 0.00 0.00 0.00 0.01 0.00 0.00 0.00 0.00 0.00 Fe/(Fe + Mg) 0.86 0.40 0.59 0.59 0.42 0.35 0.27 0.25 0.23
Conditions of probe analyses are 15 nA for beam current and 15 kV for acceleration voltage. All iron is calculated as ferrous nd not detected
and oxygen isotope compositions of calcite from comb quartz cavities and veins and calcite in late faults were also measured.
Milky quartz of vugs and type I veins
Theδ18O values of milky quartz of vugs and type I veins
vary from 14.6‰ to 9.2‰ (Fig. 8a and Table 4). Milky
quartz in samples from gold-rich type I veins has higher
δ18O values (14.6‰ to 11.5‰) than milky quartz of
gold-poor vugs and type I veins (11.3‰ to 9.2‰). The temperature of milky quartz deposition is estimated at 450°C to 350°C on the basis of the fluid inclusion study. Using the
fractionation equation of Matsuhisa et al. (1979) and quartz
deposition temperatures estimated at 450°C to 350°C on the
basis of the fluid inclusion studies, the calculated δ18O
values of water in equilibrium with milky quartz of gold-rich
type I veins are 6.2‰ to 11.5‰. Slightly lower δ18Owater
values (4.0‰ to 8.3‰) are obtained for milky quartz
depositing fluids in other vugs and type I veins (Fig. 8a
and Table4).
Type III vein quartz
Type III vein quartz has δ18O values between 11.5‰ and
9.3‰ (Fig. 8a and Table 4), the molybdenite-bearing
sample DTR358 of the El Tierrero mine having the lowest
value (Table 4). It is difficult to constrain the formation
temperature of type III veins as no analyzable fluid inclusions have been found. However, as type III veins are assigned to the retrograde alteration because of their chlorite, sericite, epidote, and calcite assemblage, a forma-tion temperature between 250°C and 350°C has been
assumed. The calculated equilibrium δ18Owater values of
fluids that formed the quartz are between 0.4‰ and 6.2‰
(Fig. 8a and Table4).
Late comb quartz and calcite filling cavities and veins
Two comb quartz samples in late assemblages of quartz, ±chlorite, ±calcite, and ±hematite filling cavities and veins
haveδ18O values of 6.2 (clear comb quartz, Figs.2e and8a
and Table 4) and 5.3 (purple comb quartz, Fig. 8a and
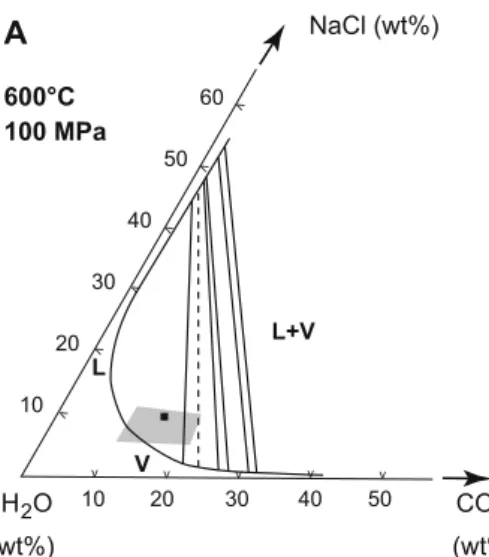
T (°C) P (MPa) 0 50 100 150 200 250 300 350 400 200 300 400 500 600 700 800 WSGS L (40) + V 4 km lithostatic cp1 4 km hydrostatic cp2 L (30) + V 9.69 mol% CO2, 6 wt% eq. NaCl PT estimate for the prograde stage
cp3
cp1: critical point for the mixture 10 mol% CO2 + 90 mol% H2O (Takenouchi and Kennedy 1964) cp2: critical point for a 10 wt% eq NaCl aqueous fluid (Knight and Bodnar 1989)
cp3: critical point for the mixture 9.69 mol% CO2 + 88.57 mol% H2O + 1.74 mol% NaCl or 6 wt% NaCl (Diamond 2003) L-V curves (with salinities in wt% eq. NaCl in parenthesis) are from Khaibullin and Borisov (1966) and Bodnar et al. (1985)
Isochore of Lc fluid inclusions Isochore of Lh fluid inclusions
Isochore of Lc fluid inclusions showing
necking down or reequilibration features Lh fluid inclusion homogenization temperature
Isochore of possibly reequilibrated Lc
fluid inclusions Isochore of selected L1 and L2 fluid inclusions
Lc fluid inclusion homogenization
temperature L1 and L2 fluid inclusion homogenization temperature
L (10) + V Late prograde and
retrograde stage
Fig. 8 Pressure–temperature plot of the isochores of all Lc aqueous-carbonic fluid inclu-sions and of four selected Lh halite-bearing fluid inclusions. The field of isochores of Lh inclusions with homogenization temperatures over 450°C is also represented. Isochores of Lc aqueous-carbonic fluid inclu-sions showing necking down features (dashed lines) are generally steep and indicate unrealistically high pressures. See detailed explanation in text. WSGS water saturated
Table4). Fluid inclusions of the L3 and L3h types observed in this comb quartz allowed us to estimate formation
temperature in the range of 150°C to 200°C (Fig.5b). For
these temperatures, the equilibriumδ18Owatervalues of comb
quartz precipitating fluids lie between −10.0‰ and −5.4‰
(Fig.8a and Table4).
Calcite in the same late assemblage filling cavities and
veins hasδ18O values of 7.6‰ to 6.8‰ and δ13C values of
Table 4 Summary of oxygen isotope compositions for quartz and of oxygen and carbon isotope compositions for calcite of the Nambija district deposits
Mineral Sample Location Description δ18O δ18O δ13C Crystallization δ18O fluid
SMOW PDB PDB temperature (‰)
Milky quartz DTR306 Guaysimi Central Milky quartz in gold-rich type I 12.6 400±50°C 7.3 to 9.5
DTR341 Nambija-El Playon Idem 12.6 400±50°C 7.3 to 9.5
DTR505a Guaysimi Banderas
Idem 14.6 400±50°C 9.3 to 11.5
DTR505b Idem 11.4 400±50°C 6.2 to 8.4
DTR505b Idem 11.7 400±50°C 6.4 to 8.6
DTR339 Cambana Milky quartz in vug 9.2 400±50°C 4.0 to 6.2
DTR384 Campanillas Idem 11.3 400±50°C 6.1 to 8.3
DTR388 Milky quartz in type I vein 10.4 400±50°C 5.1 to 7.3
Quartz in sulfide-rich type III veins
DTR357 Nambija-El Tierrero
Type III vein in brown garnet skarn
11.1 300±50°C 2.2 to 5.8
DTR358 Molybdenite-bearing type III vein 9.3 300±50°C 0.4 to 4.0
DTR411 Guaysimi central Type III vein in brown garnet skarn
11.1 300±50°C 2.2 to 5.8
DTR411 Idem 11.5 300±50°C 2 6 to 6.2
DTR509 Guaysimi Banderas
Type III vein in volcaniclastic rocks
10.7 300±50°C 1.8 to 5.4
Comb quartz DTR37 Campanillas Comb quartz and hematite in vug 6.2 175±25°C −9.1 to −5.4
DTR500b Comb quartz in type I vein 5.3 175±25°C −10.0 to
−6.3
DTR500b Idem 5.3 175±25°C −10.0 to
−6.3 Mix of milky and
comb quartz
DTR309a Cambana Milky and comb quartz in vug 9.3
DTR309a Idem 9.1
DTR309a Idem 8.6
DTR 311a Idem 11.1
DTR 311a Idem 7.9
DTR 311a Idem 9.5
DTR362 Guaysimi Central Milky and comb quartz in vug 8.7
DTR383 Campanillas Idem 7.8
DTR500a Milky and comb quartz in type I 8.1
Calcite in vugs DTR 309b Cambana Vug 6.8 −23.4 −10.0 175±25°C −5.8 to −2.7 DTR 309b Idem 7.0 −23.2 −10.0 175±25°C −5.7 to −2.6 DTR 311b Idem 6.8 −23.4 −8.6 175±25°C −5.8 to −2.7 DTR 311b Idem 6.8 −23.4 −8.8 175±25°C −5.9 to −2.8 DTR 327 Campanillas Idem 7.1 −23.1 −8.9 175±25°C −5.6 to −2.5 DTR 327 Idem 7.6 −22.6 −9.0 175±25°C −5.1 to −2.0 Calcite in late faults
DTR 410 Guaysimi central Late fault 15.0 −15.4 −8.3 140±20°C −0.1 to 3.1
DTR 410 Idem 14.6 −15.8 −8.4 140±20°C −0.5 to 2.7
Isotopic compositions for fluids are calculated at temperatures derived from the fluid inclusion study and the mineral assemblages, the quartz-H2O fractionation curve from Matsuhisa et al. (1979), and the calcite-H2O fractionation curve from O’Neil et al. (1969)