HAL Id: hal-02445555
https://hal.archives-ouvertes.fr/hal-02445555
Submitted on 11 Nov 2020HAL is a multi-disciplinary open access
archive for the deposit and dissemination of sci-entific research documents, whether they are pub-lished or not. The documents may come from teaching and research institutions in France or abroad, or from public or private research centers.
L’archive ouverte pluridisciplinaire HAL, est destinée au dépôt et à la diffusion de documents scientifiques de niveau recherche, publiés ou non, émanant des établissements d’enseignement et de recherche français ou étrangers, des laboratoires publics ou privés.
Hugo Schweke, Marie-Hélène Mucchielli, Sophie Sacquin-Mora, Wanying Bei,
Anne Lopes
To cite this version:
Hugo Schweke, Marie-Hélène Mucchielli, Sophie Sacquin-Mora, Wanying Bei, Anne Lopes. Protein interaction energy landscapes are shaped by functional and also non-functional partners. Journal of Molecular Biology, Elsevier, 2020, 432 (4), pp.1183. �10.1016/j.jmb.2019.12.047�. �hal-02445555�
Title
1
Protein interaction energy landscapes are shaped by functional and also non-functional 2 partners 3 4 5
Authors
6 Hugo Schweke1 , Marie-Hélène Mucchielli1,2 , Sophie Sacquin-Mora3 , Wanying Bei1 , Anne 7 Lopes1 8 9 10 11Authors affiliations
12 1Institute for Integrative Biology of the Cell (I2BC), CEA, CNRS, Univ. Paris-Sud, 13
Université Paris-Saclay, 91198, Gif-sur-Yvette cedex, France 14
2
Sorbonne Universités, UPMC Univ Paris 06, UFR927, F-75005 Paris, France. 15
3
Laboratoire de Biochimie Théorique, UPR 9080 CNRS Institut de Biologie Physico-16
Chimique, Paris, France 17 18 19
Author contributions
20 HS performed research 21 HS, MHM, SSM, WB, AL analyzed data 22 HS, MHM, AL designed research 23HS, MHM, AL wrote the paper 24
AL conceived the project 25
The authors declare no conflict of interest. 26
27 28
Corresponding author
29
Anne Lopes, Institute for Integrative Biology of the Cell (I2BC), CEA, CNRS, Univ. Paris-30
Sud, Université Paris-Saclay, 1 avenue de la Terrasse, 91198 Gif-sur-Yvette, France. 31 Tel: +33 (0)1 69 15 35 60 32 email: anne.lopes@u-psud.fr 33 34 35 36
The authors have declared that no competing interests exist. 37
Abstract
38
In the crowded cell, a strong selective pressure operates on the proteome to limit the 39
competition between functional and non-functional protein-protein interactions. We 40
developed an original theoretical framework in order to interrogate how this competition 41
constrains the behavior of proteins with respect to their partners or random encounters. Our 42
theoretical framework relies on a two-dimensional (2D) representation of interaction energy 43
landscapes with 2D energy maps that reflect in a synthetic way the propensity of a protein to 44
interact with another protein. We investigated the propensity of protein surfaces to interact 45
with functional and arbitrary partners and asked whether their interaction propensity is 46
conserved during the evolution. Therefore, we performed several thousands of cross-docking 47
simulations to systematically characterize the whole energy landscapes of 74 proteins 48
interacting with different sets of homologs, corresponding to their functional partner's family 49
or arbitrary protein families. Then, we systematically compared the energy maps resulting 50
from the docking of a given protein with the different protein families of the dataset. 51
Strikingly, we show that the interaction propensity not only of the binding site but also of the 52
rest of the protein surface is conserved for docking partners belonging to the same protein 53
family. Interestingly, this observation holds for docked proteins corresponding to true but also 54
to arbitrary partners. Our theoretical framework enables the characterization of the energy 55
behavior of a protein in interaction with hundreds of selected partners and opens the way for 56
further developments to study the behavior of proteins in a specific environment. 57
Introduction
58
Biomolecular interactions are central for many physiological processes and are of utmost 59
importance for the functioning of the cell. Particularly protein-protein interactions have 60
attracted a wealth of studies these last decades [1–5]. The concentration of proteins in a cell 61
has been estimated to be approximately 2-4 million proteins per cubic micron [6]. In such a 62
highly crowded environment, proteins constantly encounter each other and numerous non-63
specific interactions are likely to occur [7–10]. For example, in the cytosol of S. cerevisiae a 64
protein can encounter up to 2000 different proteins [11]. In this complex jigsaw puzzle, each 65
protein has evolved to bind the right piece(s) in the right way (positive design) and to prevent 66
misassembly and non-functional interactions (negative design) [12–16]). 67
Consequently, positive design constrains the physico-chemical properties and the evolution of 68
protein-protein interfaces. Indeed, a strong selection pressure operates on binding sites to 69
maintain the functional assembly including the functional partner and the functional binding 70
mode. For example, homologs sharing at least 30% sequence identity almost invariably 71
interact in the same way [17]. Conversely, negative design prevents proteins to be trapped in 72
the numerous competing non-functional interactions inherent to the crowded environment of 73
the cell. Many studies were reported on the relationship between the propensity of proteins for 74
promiscuous interactions and their abundances or surface properties [18–21]. Particularly, it 75
has been shown that the misinteraction avoidance shapes the evolution and physico-chemical 76
properties of abundant proteins, resulting in a slower evolution and less sticky surfaces than 77
what is observed for less abundant ones [18,22–26]. The whole surface of abundant proteins 78
is thus constrained, preventing them to engage deleterious non-specific interactions that could 79
be of dramatic impact for the cell at high concentration [25]. Recently, it has been shown in E. 80
coli that the net charge as well as the charge distribution on protein surfaces affect the
diffusion coefficients of proteins in the cytoplasm [19,27]. Positively charged proteins move 82
up to 100 times more slowly as they get caught in non-specific interactions with ribosomes 83
which are negatively charged and therefore, shape the composition of the cytoplasmic 84
proteome [27]. 85
All these studies show that both positive and negative design effectively operate on the whole 86
protein surface. Binding sites are constrained to maintain functional assemblies (i.e. 87
functional binding modes and functional partners) while the rest of the surface is constrained 88
to avoid non-functional assemblies. Consequently, these constraints should shape the energy 89
landscapes of functional but also non-functional interactions so that non-functional 90
interactions do not prevail over functional ones. This should have consequences (i) on the 91
evolution of the propensity of a protein to interact with its environment (including functional 92
and non-functional partners) and (ii) on the evolution of the interaction propensity of the 93
whole surface of proteins, non-interacting surfaces being in constant competition with 94
functional binding sites. We can hypothesize that the interaction propensity of the whole 95
surface of proteins is constrained during evolution in order to (i) ensure that proteins correctly 96
bind functional partners, and (ii) limit non-functional assemblies as well as interactions with 97
non-functional partners. 98
In this work, we focus on protein surfaces as a proxy for functional and non-functional 99
protein-protein interactions. We investigate their interaction energy landscapes with native 100
and non-native partners and ask whether their interaction propensity is conserved during 101
evolution. With this aim in mind, we performed large-scale docking simulations to 102
characterize interactions involving either native or native-related (i.e. partners of their 103
homologs) partners or arbitrary partners. Docking simulations enable the characterization of 104
all possible interactions involving either functional or arbitrary partners, and thus to simulate 105
the interaction of arbitrary partners which is very difficult to address with experimental 106
approaches. Docking algorithms are now fast enough for large-scale applications and allow 107
for the characterization of interaction energy landscapes for thousand of protein couples. 108
Typically, a docking simulation takes from a few minutes to a couple of hours on modern 109
processors [28–30], opening the way for extensive cross-docking experiments [31–35]. 110
Protein docking enables the exploration of the interaction propensity of the whole protein 111
surface by simulating alternative binding modes. Here, we performed a cross-docking 112
experiment involving 74 selected proteins docked with their native-related partners and their 113
corresponding homologs, as well as arbitrary partners and their corresponding homologs. We 114
represented the interaction energy landscapes resulting from each docking calculation with a 115
two dimensional (2D) energy map in order to (i) characterize the propensity of all surface 116
regions of a protein to interact with a given partner (either native-related or not) and (ii) easily 117
compare the energy maps resulting from the docking of a same protein with different sets of 118
homologous partners, thus addressing the evolution of the propensity of a protein to interact 119
with homologous partners either native or arbitrary. 120
Results
121 122
The interaction propensity of the whole surface of the human ubiquitin
carboxyl-123
terminal hydrolase 14 is conserved for homologous protein ligands, be they functional
124
partners or random encounters
125
If positive and negative design constraint the propensity of the whole surface of proteins to 126
interact with their functional partners or random encounters, this should shape the evolution 127
of interaction energy landscapes of functional protein pairs but also of random encounter 128
pairs. Consequently, we expect that the interaction energy landscape involving a protein pair 129
(functional or arbitrary) is conserved for a homologous pair. Testing this hypothesis involves 130
being able to characterize the interaction propensity of the whole surface of a protein. 131
Therefore we designed a procedure based on a two-dimensional (2D) representation of 132
docking energy landscapes with 2D energy maps which reflect the propensity of a protein (i.e. 133
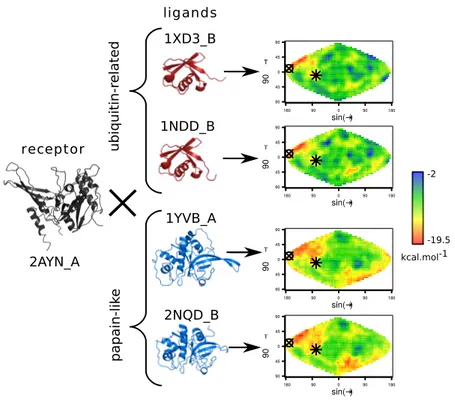
the receptor) to interact with the docked partner (i.e. the ligand) (Materials and Methods, Fig 134
1A-C). The procedure is asymmetrical and the resulting energy map provides the distribution 135
of all docking energies over the whole receptor surface thus reflecting the propensity of the 136
receptor to interact with the docked ligand. Fig 2 represents the energy maps computed for the 137
receptor 2AYN_A, the human ubiquitin carboxyl-terminal hydrolase 14 (family UCH) 138
docked with (i) its native partner (1XD3_B, ubiquitin-related family), a homolog of its partner 139
(defined as a native-related partner) (1NDD_B) and (ii) two arbitrary homologous ligands 140
(1YVB_A and 1NQD_B from the papain-like family). For all four ligands, either native-141
related or arbitrary partners, docking calculations lead to an accumulation of low-energy 142
solutions (hot regions in red) around the two experimentally known binding sites of the 143
receptor. The first one corresponds to the interaction site with the native partner, ubiquitin 144
(pdb id 2ayo). The second one corresponds to its homodimerisation site (pdb id 2ayn). This 145
indicates that native-related but also arbitrary partners tend to bind onto the native binding 146
sites of native partners as observed in earlier studies [34,36]. Indeed, the low energy solutions 147
tend to accumulate systematically in the vicinity of the two native interaction sites. Whereas 148
the low energy solutions obtained for both ligand families accumulate around the native 149
binding sites of 2AYN_A, the two ligand families display clear differences in the rest of the 150
map. Indeed, the energy maps obtained with the ligands of the ubiquitin-like family both 151
reveal two sharp hot regions around the native sites and a subset of well-defined cold regions 152
(i.e. blue regions corresponding to high energy solutions) placed in the same area in the map’s 153
upper-right quadrant. In contrast, the energy maps obtained for the ligands of the papain-like 154
family display a large hot region around the two native binding sites of the receptor, 155
extending to the upper-left and bottom-right regions of the map and suggesting a large 156
promiscuous binding region for these ligands. The interaction propensity of the two binding 157
sites of 2AYN_A but also of the other regions of its surface seems to be conserved for 158
homologous ligands and specific to each ligand family whether the ligands correspond to 159
native-related partners or not (Fig 2). 160
Generalization to a large set of proteins
161
We asked whether this observation could be generalized to a large set of proteins. Therefore 162
we built a database comprising 74 protein structures divided into 12 families of homologs (S1 163
Table and Materials and Methods). Each family displays different degrees of structural 164
variability and sequence divergence in order to see the impact of these properties on the 165
conservation of the interaction propensity inside a protein family. Each family has at least one 166
native-related partner family (S1 Fig). For a protein A, we refer as native-related partners its 167
native partner (when its three dimensional (3D) structure is available) and native partners of 168
proteins that are homologous to the protein A. Arbitrary pairs refer to pairs of proteins for 169
which no interaction has been experimentally characterized in the Protein Data Bank neither 170
for their respective homologs [37]. Docking calculations are performed with the ATTRACT 171
software [30]. Each protein (namely the receptor) is docked with the 74 proteins (namely the 172
ligands) of the dataset (Fig 3A and Materials and Methods) and the 74 corresponding energy 173
maps are calculated (Fig 3B and Materials and Methods). The 74 resulting energy maps are 174
compared together with a Manhattan distance and all the energy map distances are stored in 175
an energy map distance (EMD) matrix (Fig 3C and Materials and Methods). Each matrix 176
entry (i,j) corresponds to the distance di,j between the energy maps of ligands i and j docked
177
with a receptor k (Fig 3C and Materials and Methods). Consequently, a small distance di,j
178
between ligands i and j docked with a receptor k, reflects a high similarity of their energy 179
maps. In other words, the interaction propensity of the surface of the receptor k is similar for 180
both ligands i and j. One should notice that energy maps computed for two unrelated 181
receptors are not comparable since their surfaces are not comparable as well. Therefore, the 182
procedure is asymmetrical and receptor-centered. It only compares energy maps calculated for 183
different ligands docked with the same receptor. In order to prevent any bias from the choice 184
of the receptor, each of the 74 proteins plays alternately the role of receptor and ligand. 185
Consequently, the protocol presented in Fig 3 is repeated for the entire dataset where each 186
protein plays the role of the receptor and is docked with the 74 proteins that play the role of 187
ligands, thus resulting in 74 EMD matrices. In order to quantify the extent to which the 188
interaction propensity of a receptor is conserved for homologous ligands, we evaluated to 189
what extent distances calculated between homologous ligand pairs were smaller than 190
distances calculated between random pairs. Fig 4 represents the boxplots of energy map 191
distances calculated between random ligand pairs or between homologous ligand pairs docked 192
with their native-related receptor or with the other receptors of the dataset. Homologous 193
ligands display significantly lower energy map distances than random ligand pairs (Wilcoxon 194
test p = 0) indicating that energy maps produced by homologous ligands are more similar than 195
those produced by non-homologous ligands. Interestingly, this observation holds whether the 196
receptor-ligand pair is a native pair or not. This suggests that the interaction propensity of a 197
receptor is conserved for homologous partners be they native-related or not. 198
199
Energy maps are specific to protein families
200
The results presented above prompted us to assess the extent to which the interaction 201
propensity of a receptor is specific to the ligand families it interacts with. If so, a receptor 202
should lead to energy maps that are specific to the different ligand families and we should be 203
able to retrieve homology relationships of ligands solely from the comparison of their energy 204
maps. Therefore, we tested our ability to predict the homologs of a given ligand based only on 205
the comparison of its energy maps with those of the other ligands. In order to prevent any bias 206
from the choice of the receptor, the 74 EMD matrices are averaged in an averaged distances 207
matrix (ADM) (see Materials and Methods). Each entry (i,j) of the ADM corresponds to the 208
averaged distance between two sets of 74 energy maps produced by two ligands i and j. A low 209
distance indicates that the two ligands display similar energy maps whatever the receptor is. 210
We computed a receiver operating characteristic (ROC) curve from the ADM (see Materials 211
and Methods) which evaluates our capacity to discriminate the homologs of a given ligand
212
from non-homologous ligands by comparing their respective energy maps computed with all 213
74 receptors of the dataset. The true positive set consists in the homologous protein pairs 214
while the true negative set consists in any homology-unrelated protein pair. The resulting 215
Area Under the Curve (AUC) is equal to 0.79 (Fig 5). We evaluated the robustness of the 216
ligand’s homologs prediction depending on the size of the receptor subset with a bootstrap 217
procedure by randomly removing receptor subsets of different sizes (from 1 to 73 receptors). 218
The resulting AUCs range from 0.77 to 0.79, and show that from a subset size of five 219
receptors, the resulting prediction accuracy no longer significantly varies (risk of wrongly 220
rejecting the equality of two variances (F-test) >5%), and is robust to the nature of the 221
receptor subset (S2 Fig). Finally, we evaluated the robustness of the predictions according to 222
the number of grid cells composing the energy maps. Therefore, we repeated the procedure 223
using energy maps with resolutions ranging from 144x72 to 48x24 cells. S2 Table presents 224
the AUCs calculated with different grid resolutions. The resulting AUCs range from 0.78 to 225
0.8 showing that the grid resolution has a weak influence on the map comparison. All 226
together, these results indicate that homology relationships between protein ligands can be 227
detected solely on the basis of the comparison of their energy maps. In other words, the 228
energy maps calculated for a receptor docked with a set of ligands belonging to a same family 229
are specific to this family. Interestingly, this observation holds for families displaying 230
important sequence variations (S1 Table). For example, the AUC computed for the UCH and 231
ubiquitin-related families are 0.98 and 0.88 respectively despite the fact that the average 232
sequence identity of these families does not exceed 45% (S3 Fig and S1 Table). This indicates 233
that energy maps are similar even for homologous ligands displaying large sequence 234
variations. 235
236
We then specifically investigated the energy maps of each family in order to see whether 237
some ligands behave energetically differently from their family members. On the 74 ligands, 238
only five (2L7R_A, 4BNR_A, 1BZX_A, 1QA9_A, 1YAL_B) display energy maps that are 239
significantly different from those of their related homologs (Z-tests p-values for the 240
comparison of the averaged distance of each ligand with their homologs versus the averaged 241
distance of all ligands with their homologous ligands ≤ 5%). In order to identify the factors 242
leading to differences between energy maps involving homologous ligands, we computed the 243
pairwise sequence identity and the root mean square deviation (RMSD) between the members 244
of each family. Interestingly, none of these criteria can explain the energy map differences 245
observed within families (Fisher test p of the linear model estimated on all protein families 246
>0.1) (see Fig 6B-C for the ubiquitin-related family, S4-S14B-C Fig for the other families, 247
and S3 Table for details). Fig 6A represents a subsection of the ADM for the ubiquitin-related 248
family (i.e. the energy map distances computed between all the members of the ubiquitin-like 249
family and averaged over the 74 receptors). Low distances reflect pairs of ligands with similar 250
energy behaviors (i.e. producing similar energy maps when interacting with a same receptor) 251
while high distances reveal pairs of ligands with different energy behaviors. 2L7R_A 252
distinguishes itself from the rest of the family, displaying high-energy map distances with all 253
of its homologs. RMSD and sequence identity contribute modestly to the energy map 254
distances observed in Fig 6A (Spearman correlation test pRMSD
= 0.01 and pseq
= 0.02 (S3
255
Table, Fig 6B-C)). Fig 6D shows a projection of the electrostatic potential calculated with 256
APBS [38] on the surface of the seven ubiquitin-related family members (for more details, see 257
S15 Fig and Materials and Methods). Fig 6E represents the electrostatic maps distances 258
computed between all members of the family. 2L7R_A clearly stands out, displaying a 259
negative electrostatic potential over the whole surface while its homologs harbor a remarkable 260
fifty-fifty electrostatic distribution (Fig 6D). The negatively charged surface of 2L7R_A is 261
explained by the absence of the numerous lysines that are present in the others members of 262
the family (referred by black stars, Fig 6D). Lysines are known to be essential for ubiquitin 263
function, enabling the formation of polyubiquitin chains on target proteins. Among the seven 264
lysines of the ubiquitin, K63 polyubiquitin chains are known to act in non-proteolytic events 265
while K48, K11, and the four other lysines polyubiquitin chains are presumed to be involved 266
into addressing proteins to the proteasome [39]. 2L7R_A is a soluble UBL domain resulting 267
from the cleavage of the fusion protein FAU [40]. Its function is unrelated to proteasomal 268
degradation, which might explain the lack of lysines on its surface and the differences 269
observed in its energy maps. Interestingly, the differences observed for the energy maps of 270
1YAL_B (Papain-like family) (S4 Fig) and 4BNR_A (eukaryotic proteases family) (S5 Fig) 271
regarding their related homologs can be explained by the fact that they both display a highly 272
charged surface. These two proteins are thermostable [41,42], which is not the case for their 273
related homologs, and probably explains the differences observed in their relative energy 274
maps. The V-set domain family is split into two major subgroups according to their averaged 275
energy map distances (S6A Fig). The first group corresponds to CD2 proteins (1QA9_A and 276
its unbound form 1HNF_A) and differs significantly from the second group (Z-test p = 0.03 277
and p = 0.05 respectively). The second group corresponds to CD58 (1QA9_B and its unbound 278
form 1CCZ_A) and CD48 proteins (2PTT_A). Interestingly, CD2 is known to interact with its 279
homologs (namely CD58 and CD48) through an interface with a striking electrostatic 280
complementarity [43]. The two subgroups have thus evolved distinct and specific binding 281
sites to interact together. We can hypothesize that they have different interaction propensities 282
resulting in the differences observed between their corresponding energy maps. These five 283
cases illustrate the capacity of our theoretical framework to reveal functional or biophysical 284
specificities of homologous proteins that could not be revealed by classical descriptors such 285
as RMSD or sequence identity. 286
The AUC of 0.79 calculated previously with energy maps produced with the docking of either 287
native-related or arbitrary pairs indicates that energy maps are specific to ligand families. To 288
see whether this observation is not mainly due to the native-related pairs, we repeated the 289
previous test while removing that time all energy maps computed with native-related pairs 290
and calculated the resulting ADM. We then measured our ability to retrieve the homologs of 291
each ligand by calculating the ROC curve as previously. The resulting AUC is still equal to 292
0.79, revealing that our ability to identify a ligand’s homologs is independent from the fact 293
that the corresponding energy maps were computed with native-related or arbitrary pairs (Fig 294
5). This shows that the energy maps are specific to protein families whether the docked pairs 295
are native-related or not. Consequently, the propensity of the whole protein surface to interact 296
with a given ligand is conserved and specific to the ligand family whether the ligand is native-297
related or not. This striking result may reflect both positive and negative design operating on 298
protein surfaces to maintain functional interactions and to limit random interactions that are 299
inherent to a crowded environment. 300
301
The interaction propensity of all surface regions of a receptor is evolutionary conserved
302
for homologous ligands
303
To see whether some regions contribute more to the specificity of the maps produced by 304
homologous ligands, we next dissected the effective contribution of the surface regions of the 305
receptor defined according to their docking energy value, in the identification of ligand’s 306
homologs. We discretized the energy values of each energy map into five categories, leading 307
to a palette of five energy classes (see Fig 1D and Materials and Methods). These five-classes 308
maps highlight low-energy regions (i.e. hot regions in red), intermediate-energy regions (i.e. 309
warm, lukewarm and cool regions in orange, light-green and dark-green respectively) and 310
high-energy regions (i.e. cold regions in blue). We first checked that the discretization of the 311
energy maps does not affect our ability to identify the homologs of each of the 74 ligands 312
from the comparison of their five-classes maps. The resulting AUC is 0.77 (Table 1), showing 313
that the discretization step does not lead to an important loss of information. 314
315
Then, we evaluated the contribution of each of the five energy classes separately in the 316
ligand’s homologs identification by testing our ability to retrieve the homologs of the 74 317
ligands from their one-class energy maps (either hot, warm, lukewarm, cool or cold) (see 318
Materials and Methods). Table 1 shows the resulting AUCs. Interestingly, the information
319
provided by each energy class taken separately is sufficient for discriminating the homologs 320
of a given ligand from the rest of the dataset (Table 1). The resulting AUCs range from 0.76 321
to 0.79 for the warm, lukewarm, cool and cold classes and are comparable to those obtained 322
with all classes taken together (0.77). This shows (i) that warm, lukewarm, cool, and cold 323
regions alone are sufficient to retrieve homology relationships between ligands and (ii) that 324
the localization on the receptor surface of a given energy class is specific to the ligand 325
families. Hot regions are less discriminative and lead to an AUC of 0.73. In order to see how 326
regions of an energy class are distributed over a receptor surface, we summed the one-class 327
maps of the corresponding energy class calculated for this receptor into a stacked map (S16 328
Fig – see Materials and Methods for more details). A stacked map reflects the tendency of a 329
surface region (i.e. map cells) to belong to the corresponding energy class. Fig 7 shows an 330
example of the five stacked maps (i.e. for cold, cool, lukewarm, warm and hot regions) 331
computed for the receptor 1P9D_U. Intermediates regions (i.e. warm, lukewarm and cool 332
regions) are widespread on the stacked map while cold and hot regions are localized on few 333
small spots (three and one respectively) no matter the nature of the ligand. S17 Fig shows for 334
the receptor 1P9D_U the 12 cold and hot stacked maps computed for each ligand family 335
separately. We can see that some cold spots are specific to ligand families and that their area 336
distribution is specific to families while all 12 ligand families display the same hot spot in the 337
map’s upper-right quadrant. These observations can be generalized to each receptor. On 338
average, intermediate regions are widespread on the stacked maps and cover respectively 744, 339
1164 and 631 cells for cool, lukewarm and warm regions, while cold and hot regions cover no 340
more than respectively 104 and 110 cells respectively (S18 Fig). Interestingly, hot regions are 341
more colocalized than cold ones and are restricted to 2 distinct spots on average per stacked 342
map, while cold regions are spread on 3.7 spots on average (t-Test p = 7.42e-13). These 343
results show that ligands belonging to different families tend to dock preferentially on the 344
same regions and thus lead to similar hot region distributions on the receptor surface. This 345
observation recalls those made by Fernandez-Recio et al. [36], who showed that docking 346
random proteins against a single receptor leads to an accumulation of low-energy solutions 347
around the native interaction site and who suggested that different ligands will bind 348
preferentially on the same localization. 349
350
We can hypothesize that hot regions present universal structural and biochemical features that 351
make them more prone to interact with other proteins. To test this hypothesis, we computed 352
for each protein of the dataset, the 2D projection of three protein surface descriptors (see 353
Materials and Methods and S15 Fig): the Kyte-Doolittle (KD) hydrophobicity [44], the
354
circular variance (CV) [45] and the stickiness [25]. The CV measures the density of protein 355
around an atom and is a useful descriptor to reflect the local geometry of a surface region. CV 356
values are comprised between 0 and 1. Low values reflect protruding residues and high values 357
indicate residues located in cavities. Stickiness reflects the propensity of amino acids to be 358
involved in protein-protein interfaces [25]. It is calculated as the log ratio of the residues 359
frequencies on protein surfaces versus their frequencies in protein-protein interfaces. For each 360
receptor, we calculated the correlation between the docking energy and the stickiness, 361
hydrophobicity or CV over all cells of the corresponding 2D maps. We found a significant 362
anti-correlation between the docking energy and these three descriptors (correlation test p 363
between docking energies and respectively stickiness, hydrophobicity and CV < 2.2e-16, see 364
S4 Table)). Fig 8 represents the boxplots of the stickiness, hydrophobicity and CV of each 365
energy class (see S15 Fig and Materials and Methods section for more details). We observe a 366
clear effect of these factors on the docking energy: cold regions are the less sticky, the less 367
hydrophobic and the most protruding while hot ones are the most sticky, the most 368
hydrophobic and the most planar (Tukey HSD test [46], p of the differences observed 369
between each energy classes < 2.2e-16). One should notice that stickiness has been defined 370
from a statistical analysis performed on experimentally characterized protein interfaces and 371
therefore between presumed native partners. The fact that docking energies (physics-based) 372
calculated either between native-related or arbitrary partners is anti-correlated with stickiness 373
(statistics-based) defined from native interfaces, strengthens strongly the concept of stickiness 374
as the propensity of interacting promiscuously and provides physics-based pieces of evidence 375
for sticky regions as a proxy for promiscuous interactions. 376
We show that not only the area distribution on a receptor surface of hot regions but also those 377
of intermediate and cold regions are similar for homologous ligands and are specific to ligand 378
families (AUC ranging from 0.73 to 0.79) whether the ligands are native-related or not. This 379
tendency is even stronger for intermediate and cold regions. Interestingly, the information 380
contained in the cold regions that cover on average no more than 5.0% of the energy maps is 381
sufficient to identify homology relationships between ligands. 382
Discussion
383
In this study, we address the impact of both positive and negative design on thousands of 384
interaction energy landscapes by the mean of a synthetic and efficient representation of the 385
docking energy landscapes: two-dimensional energy maps that reflect the interaction 386
propensity of the whole surface of a protein (namely the receptor) with a given partner 387
(namely the ligand). We show that the distribution on the protein surface of all regions, 388
including cold, intermediate and hot regions are similar for homologous ligands and are 389
specific to ligand families whether the ligands are native-related or arbitrary. This reveals that 390
the interaction propensity of the whole surface of proteins is constrained by functional and 391
non-functional interactions, reflecting both positive and negative design operating on the 392
whole surface of proteins, thus shaping the interaction energy landscapes of functional 393
partners and random encounters. These observations were made on a dataset of 74 protein 394
structures belonging to 12 families of structural homologs. 54 out of the 74 proteins of the 395
dataset have at least one known partner in the dataset. For the 20 remaining proteins, we were 396
not able to find evidences that they indeed interact with a protein of the dataset. However, we 397
showed that the interaction propensity of a receptor is conserved for homologous ligands 398
independently from the fact that these ligands correspond to native partners or not. Indeed, we 399
showed that ligand homology relationships could be retrieved from their energy maps 400
whether the maps were computed with native-related pairs or not (the corresponding AUCs 401
calculated with and without native pairs both equal to 0.79). 402
Most studies that aim at depicting protein interactions focus on the functional ones and on the 403
characterization of the native assembly modes [14,47–51]. Nevertheless, the importance of 404
non-specific interactions and non-native assembly modes in protein interactions is no longer 405
specific interactions on the in-cell mobility of proteins [7,19,21,27]. In addition, an important 407
literature describes the relationship between the physico-chemical properties of proteins and 408
their ability for non-specific interactions [7,19,21,25,53]. In particular, Wang et al showed 409
that the propensity for non-specific interactions is determined by multiple factors such as the 410
protein charge, the conformational flexibility and the distribution of hydrophobic residues on 411
the protein surface [19]. Finally, recent studies have demonstrated the importance of non-412
native assembly modes and non-interacting regions in the protein association process [54] and 413
showed that it is relevant to consider them for predicting protein partners and binding 414
affinities [56,57]. Particularly, Marin-Lopez et al developed a method based on the sampling 415
of the conformational space of the encounter complexes formed during the binding process 416
and showed that ΔG can be predicted accurately from the scoring of all encounter complexes 417
sampled during a docking simulation, suggesting that the knowledge of the native pose is not 418
necessary [57]. All these works highlight the importance of taking into account the whole 419
surface of proteins as well as all the binding modes of a protein pair. This calls for the 420
development of new methods that enable the systematic and physical characterization of the 421
whole surface of a protein in interaction with a given partner. Here, we address the energy 422
behavior of not only known binding sites, but also of the rest of the protein surface, which 423
plays an important role in protein interactions by constantly competing with the native 424
binding site. We show that the interaction propensity of the rest of the surface is not 425
homogeneous and displays regions with different binding energies that are specific to ligand 426
families. This may reflect the negative design operating on these regions to limit non-427
functional interactions [14,16,58]. We can hypothesize that non-interacting regions participate 428
to favor functional assemblies (i.e. functional assembly modes with functional partners) over 429
non-functional ones and are thus evolutionary constrained by non-functional assemblies. The 430
fact that cold regions seem to be more specific to ligand families than hot ones may be 431
explained by the fact that they are on average more protuberant and more charged. They thus 432
display more variability than hot ones. Indeed, there is more variability in being positively or 433
negatively charged and protuberant (with an important range of protuberant shapes) than in 434
being neutral and flat. S19 Fig presents the electrostatic potential distribution of all energy 435
classes. Cold regions display a larger variability of electrostatic potential (F-test, p < 2.2e-16) 436
than hot regions that are mainly hydrophobic thus displaying neutral charge distributions in 437
average. Consequently, a same hot region may be attractive for a large set of ligands while a 438
cold region may be unfavorable to specific set of ligands, depending on their charges, shapes 439
and other biophysical properties. 440
Moreover, we show that hot regions are very localized (4.9% of the cells of an energy map) 441
and tend to be similar no matter the ligand. Similarly to protein interfaces that have been 442
extensively characterized in previous studies [47,48,48–50], hot regions are likely to display 443
universal properties of binding, i.e. they are more hydrophobic and more planar, and thus 444
more “sticky” than the other regions. They may provide a non-specific binding patch that is 445
suitable for many ligands. However, we can hypothesize that native partners have evolved to 446
optimize their interfaces (positive design) so that native interactions prevail over non-native 447
competing ones. Then positive design results in conserved binding sites and coevolved 448
interfaces in order to maintain the charge and shape complementarity between functional 449
partners. Indeed, we have previously shown that the docking of native partners lead to more 450
favorable binding energies than the docking of non-native partners when the ligand is 451
constrained to dock around the receptor’s native binding site [33,59]. All these results suggest 452
a new physical model of protein surfaces where protein surface regions, in the crowded 453
cellular environment, serve as a proxy for regulating the competition between functional and 454
non-functional interactions. In this model, intermediate and cold regions play an important 455
role by preventing non-functional assemblies and by guiding the interaction process towards 456
functional ones and hot regions may select the functional assembly among the competing 457
ones through optimized interfaces with the native partner. This model recalls the transitive 458
model proposed by Marin-Lopez et al where a path connecting what they call “productive” 459
(near-native) and “non-productive” (non-native) assemblies can be defined [57]. This path 460
consists in distinct conformational states where each one is a macro-state of the binding 461
process involving either the native binding site of each partner, a single native binding site or 462
no native ones. The initial steps consist in macro-states which do not involve native binding 463
sites. Macro-states appearing later during the assembly process would play a mechanistic role 464
by drawing near the binding sites of the two partners. The latest stage would correspond to 465
near-native conformations where van der Waals and de-solvation energies play a major role in 466
the energy of interaction of the corresponding complexes while the electrostatic forces 467
contribute mostly in the energy of non-native assemblies [60,61]. Figure S21 shows the 468
effective electrostatic and van der Waals contributions in the total docking energy for the 469
different surface regions (i.e. cold, intermediate and hot regions). Interestingly, our results 470
concur with the observations made in [60,61] since we show that the contribution of 471
electrostatic in the total docking energy is more important in cold regions while van der 472
Waals energies predominate in hot ones. Characterizing the relationship between the macro-473
states defined by Marin-Lopez et al and the surface regions of different energy levels could 474
provide at the same time a structural, physical and readable characterization of the binding 475
process of two interacting proteins. In particular, it would be interesting to compare the 476
properties of the different macro-states (involving or not the native binding sites of the two 477
proteins) identified for functional and arbitrary pairs to see whether functional pairs displays 478
specific features that would have resulted from an optimization of the binding process. 479
In this work, we used and extended the application of the 2D energy map representation 481
developed in [36] to develop an original theoretical framework that enables the efficient, 482
automated and integrative analysis of different protein surface features. Many other surface 483
representations have been developed to characterize protein surface properties [62–67]. These 484
representations include 2D projections or more sophisticated methods such as for example 485
using 3D Zernike descriptors as a representation of the protein surface shape [68,69] which is 486
a powerful tool to compare surface properties of either homologous or unrelated proteins 487
since it does not require any prior alignment. 2D maps provide the area distribution of a given 488
feature on the whole protein surface and their discretization enables the study of a given 489
surface property (e.g. protuberance, planarity, stickiness, positively charged regions, or cold 490
and hot regions for example). The advantage with the 2D energy maps is that they are easy to 491
build and manipulate and their straightforward comparison enables (i) the study of 492
relationships between different surface properties through the comparison of their area 493
distributions on a protein surface and (ii) the highlight of the evolutionary constraints exerted 494
on a given feature by comparing its area distribution on the surfaces of homologous proteins. 495
Particularly, this enables the identification and characterization of hot regions on a protein 496
surface which can be either specific or conserved for all ligands and opens up new 497
possibilities for the development of novel methods for protein binding sites prediction and 498
their classification as functional or promiscuous in the continuity of previous developments 499
based on arbitrary docking [33,34,36,59]. 500
501
Finally, our framework provides a proxy for further protein functional characterization as 502
shown with the five proteins discussed in the Results section Energy maps are specific to 503
protein families. The comparison of their respective energy maps enables us to reveal
biophysical and functional properties that could not be revealed with classical monomeric 505
descriptors such as RMSD or sequence identity. Indeed, our framework can reflect the energy 506
behavior of a protein interacting with a subset of selected partners either functional or 507
arbitrary, thus revealing functional and systemic properties of proteins. This work goes 508
beyond the classical use of binary docking to provide a systemic point of view of protein 509
interactions, for example by exploring the propensity of a protein to interact with hundreds of 510
selected ligands, and thus addressing the behavior of a protein in a specific cellular 511
environment. Particularly, exploring the dark interactome (i.e. non-functional assemblies and 512
interactions with non-functional partners) can provide a wealth of valuable information to 513
understand mechanisms driving and regulating protein-protein interactions. Precisely, our 2D 514
energy maps based strategy enables its exploration in an efficient and automated way. 515
Materials and Methods
516 517
Protein dataset
518
The dataset comprises 74 protein structures divided into 12 families of structural homologs 519
which were selected from the protein docking benchmark 5.0. (see S1 Table for a detailed list 520
of each family). We decided to systematically remove all Antibody/Antigens complexes since 521
they display specific evolutionary properties. Indeed, they did not co-evolve to interact and 522
we can hypothesize that the evolutionary constraints operating on their interaction energy 523
landscapes are different from those of other complexes. Each family is related to at least one 524
other family (its native-related partners family) through a pair of interacting proteins for 525
which the 3D structure of the complex is characterized experimentally (except the V set 526
domain family: the two native partners are homologous and belong to the same family) (S1 527
Fig). Each family is composed of a monomer selected from the protein-protein docking 528
benchmark 5.0 [70] in its bound and unbound forms, which is called the master protein. Each 529
master protein has a native partner (for which the 3D structure of the corresponding complex 530
has been characterized experimentally) in the database, which is the master protein for 531
another family, except the V set domain family, which is a self-interacting family. When 532
available, we completed families with interologs (i.e. pairs of proteins which have interacting 533
homologs in an other organism) selected in the INTEREVOL database [71] according to the 534
following criteria: (i) experimental structure resolution better than 3.25 Å, (ii) minimum 535
alignment coverage of 75% with the rest of the family members and (iii) minimum sequence 536
identity of 30% with at least one member of the family. Since we were limited by the number 537
of available interologs, we completed families with unbound monomers homologous to the 538
master following the same criteria and by searching for their partners in the following protein-539
protein interactions databases [72–77]. We consider that all members of a family correspond 540
to native-related partners of all members of their native-related partner family. To address the 541
impact of conformational changes of a protein on its interaction energy maps, we added 542
different NMR conformers. We show that energy maps involving pairs of conformers are 543
significantly more similar than those obtained for other pairs of homologous ligands 544
(unilateral Wilcoxon test, p < 2.2e-16) showing that the conformational changes in a protein 545
(lower than 3Å) have a low impact on the resulting energy maps (S20 Fig). 546
547
Docking experiment and construction of energy maps
548
A complete cross-docking experiment was realized with the ATTRACT software [30] on the 549
74 proteins of the dataset, leading to 5476 (74 x 74) docking calculations (Fig 1A). 550
ATTRACT uses a coarse-grain reduced protein representation and a simplified energy 551
function comprising a pseudo Lennard-Jones term and an electrostatic term. The calculations 552
took approximately 20000 hours on a 2.7GHz processor. Prior to docking calculations, all 553
PDB structures were prepared with the DOCKPREP software [78]. 554
During a docking calculation, the ligand Li explores exhaustively the surface of the receptor
555
Rk (whose position is fixed during the procedure), sampling and scoring thousands of
556
different ligand docking poses (between 10000 and 50000 depending on the sizes of the 557
proteins) (Fig 1A). For each protein couple Rk-Li, a 2D energy map is computed which shows
558
the distribution of the energies of all docking solutions over the receptor surface. To compute 559
these maps, for all docking poses, the spherical coordinates (φ, θ) (with respect to the 560
receptor center of mass (CM)) of the ligand CM are represented onto a 2D map in an equal-561
area 2D sinusoidal projection (Fig 1B) (see [36] for more details). Each couple of coordinates
562
(φ, θ) is associated with the energy of the corresponding docking conformation (Fig 1B). A 563
continuous energy map is then derived from the discrete one, where the map is divided into a 564
grid of 36 x 72 cells. Each cell represents the same surface and, depending on the size of the 565
receptor, can span from 2.5 Å2
to 13Å2
. For each cell, all solutions with an energy score 566
below 2.7 kcal/mol-1
from the lowest solution of the cell are retained, according to the 567
conformations filtering protocol implemented in [33]. The average of the retained energy 568
scores is then assigned to the cell. If there is no docking solution in a cell, a score of 0 is 569
assigned to it. Finally, the energies of the cells are smoothed, by averaging the energy values 570
of each cell and of the eight surrounding neighbors (Fig 1C). 571
For each map, the energy values are discretized into five energy classes of same range leading 572
to a discrete five-colors energy map (Fig 1D). The range is calculated for each energy map 573
and spans from the minimum to the maximum scores of the map cells. The range of the 574
energy classes of the map Rk-Li is equal to (maxE – minE)/5, where maxE and minE
575
correspond to the maximal and minimal energy values in the Rk-Li map. Each five-classes
576
energy map is then split into five one-class maps, each one representing an energy class of the 577
map (Fig 1E). The continuous, five-classes and one-class energy maps are calculated for the 578
5476 energy maps. 579
580
Comparison of energy maps and identification of ligand’s homologs
581
Since, we cannot compare energy maps computed for two unrelated receptors, the procedure 582
is receptor-centered and only compares energy maps produced with different ligands docked 583
with the same receptor. The referential (i.e. the receptor) is thus the same (in other words all 584
grid cells are comparable) for all the energy maps that are compared. For each receptor R , we 585
computed a 74x74 energy map distance (EMD) matrix where each entry (i,j) corresponds to 586
the pairwise distance between the energy maps Rk-Li and Rk-Lj resulting from the docking of
587
the ligands Li and Lj on the receptor Rk (Fig 3). The pairwise distance dMan(Rk-Li, Rk-Lj)
588
between the energy maps is calculated with a Manhattan distance according to equation (1) 589 590 !!"# !!!!, !!!! = !" !!"− !!" !!! !" !!! (1) 591 592
where anm and bnm are the cells of row index n and column index m of the energy maps Rk-Li
593
and Rk-Lj respectively. Low distances reflect pairs of ligands that induce similar energy maps
594
when they are docked on the same receptor. The procedure presented in Fig 3 is repeated for 595
each receptor of the database resulting in 74 EMD matrices. The 74 EMD matrices are 596
averaged into an averaged distances matrix (ADM). Each entry (i,j) of the ADM reflects the 597
similarity of the Rk-Li and Rk-Lj energy maps averaged over all the receptors Rk in the dataset.
598
In order to estimate the extent to which family members display similar energy maps when 599
they are docked with the same receptor, we tested our ability to correctly identify the 600
homologs of the 74 ligands from the only comparison of its energy maps with those of the 601
other ligands. Because, energy maps are receptor-centered, we cannot compare the energy 602
maps computed for two unrelated receptors. The procedure consists in the comparison of 603
energy maps produced with different ligands docked with a same receptor. Two ligands (i,j) 604
are predicted as homologs according to their corresponding distance (i,j) in the ADM. Values 605
close to zero should reflect homologous ligand pairs, while values close to one should reflect 606
unrelated ligand pairs. A Receiver Operating Characteristic (ROC) curve and its Area Under 607
the Curve (AUC) are computed from the ADM. True positives (TP) are all the homologous 608
ligand pairs and predicted as such, true negatives (TN) are all the unrelated ligand pairs and 609
predicted as such. False positives (FP) are unrelated ligand pairs but incorrectly predicted as 610
homologous pairs. False negatives (FN) are homologous ligand pairs but incorrectly predicted 611
as unrelated pairs. ROC curves and AUC values were calculated with the R package pROC 612
[79]. The ligand’s homologs identification was also realized using the five-classes energy 613
maps or the one-class energy maps taken separately. The five energy class regions display 614
very different sizes, with median ranging from 63 and 66 cells for the cold and hot regions to 615
633 cells for the yellow one. To prevent any bias due to the size of the different classes, we 616
normalized the Manhattan distance by the size of the regions compared in the map. The rest 617
of the procedure is the same than those used for continuous energy maps (Fig 3). 618
To visualize the area distribution of the regions of a given energy class for all ligands on the 619
receptor surface, the 74 corresponding one-class maps are summed into a stacked map where 620
each cell’s intensity varies from 0 to 74 (S16 Fig). To remove background-image from these 621
maps, i.e. cells with low intensity (intensity < 17) and the areas of small size (< 4 cells), we 622
used a Dirichlet process mixture model simulation for image segmentation (R package 623
dpmixsim) [80].
624 625
2D projection of monomeric descriptors of protein surfaces
626
We computed KD hydrophobicity [44], stickiness [25], CV [45] maps of each protein of the 627
dataset, in order to compare their topology with the energy maps. Prior to all, proteins 628
belonging to the same families were structurally aligned with TM-align [81] in order to place 629
them in the same reference frame, making their maps comparable. Particles were generated 630
around the protein surface with a slightly modified Shrake-Rupley algorithm [82]. The 631
density of spheres is fixed at 1Å2
, representing several thousands particles per protein. Each 632
particle is located at 5Å from the surface of the protein. The CV, stickiness and KD 633
hydrophobicity values of the closest atom of the protein are attributed to each particle. We 634
also generated electrostatic maps reflecting the distribution of the contribution of the 635
electrostatic potential on a protein surface. The electrostatics potential was computed with the 636
APBS software suite [38] using the CHARMM force field [83]. In this case the procedure is
637
different as the electrostatic potential is calculated at each particle position, using the 638
multivalue executable from the APBS software suite. 639
The CV was calculated following the protocol described in [45] on the all-atom structures. 640
Stickiness and hydrophobicity were calculated on ATTRACT coarse-grain models. After 641
attributing a value to each particle, the position of their spherical coordinates is represented in 642
a 2-D sinusoidal projection, following the same protocol as described in Fig 1 and Materials 643
and Methods section Docking experiment and construction of energy maps. The map is then
644
smoothed following the protocol in Fig 1. 645
Acknowledgments
646
We thank F. Fraternali, R. Guerois, E. Laine, and M. Montes for their constructive comments 647
on the manuscript. 648
References
[1] J.I. Garzón, L. Deng, D. Murray, S. Shapira, D. Petrey, B. Honig, A computational interactome and functional annotation for the human proteome, ELife. 5 (2016) e18715. doi:10.7554/eLife.18715. [2] J. Janin, R.P. Bahadur, P. Chakrabarti, Protein–protein interaction and quaternary structure, Quart. Rev.
Biophys. 41 (2008). doi:10.1017/s0033583508004708.
[3] I. Nobeli, A.D. Favia, J.M. Thornton, Protein promiscuity and its implications for biotechnology, Nat Biotechnol. 27 (2009) 157–167. doi:10.1038/nbt1519.
[4] I.M.A. Nooren, J.M. Thornton, NEW EMBO MEMBER’S REVIEW: Diversity of protein-protein interactions, The EMBO Journal. 22 (2003) 3486–3492. doi:10.1093/emboj/cdg359.
[5] C.V. Robinson, A. Sali, W. Baumeister, The molecular sociology of the cell, Nature. 450 (2007) 973– 982. doi:10.1038/nature06523.
[6] R. Milo, What is the total number of protein molecules per cell volume? A call to rethink some published values: Insights & Perspectives, BioEssays. 35 (2013) 1050–1055. doi:10.1002/bies.201300066.
[7] S.R. McGuffee, A.H. Elcock, Diffusion, Crowding & Protein Stability in a Dynamic Molecular Model of the Bacterial Cytoplasm, PLoS Computational Biology. 6 (2010) e1000694. doi:10.1371/journal.pcbi.1000694.
[8] I. Yu, T. Mori, T. Ando, R. Harada, J. Jung, Y. Sugita, M. Feig, Biomolecular interactions modulate macromolecular structure and dynamics in atomistic model of a bacterial cytoplasm, ELife. 5 (2016). doi:10.7554/eLife.19274.
[9] J.T. Mika, B. Poolman, Macromolecule diffusion and confinement in prokaryotic cells, Curr. Opin. Biotechnol. 22 (2011) 117–126. doi:10.1016/j.copbio.2010.09.009.
[10] R.J. Ellis, Macromolecular crowding: an important but neglected aspect of the intracellular environment, Curr. Opin. Struct. Biol. 11 (2001) 114–119. doi:10.1016/S0959-440X(00)00172-X. [11] E.D. Levy, J. Kowarzyk, S.W. Michnick, High-Resolution Mapping of Protein Concentration Reveals
Principles of Proteome Architecture and Adaptation, Cell Reports. 7 (2014) 1333–1340. doi:10.1016/j.celrep.2014.04.009.
[12] J.S. Richardson, D.C. Richardson, Natural -sheet proteins use negative design to avoid edge-to-edge aggregation, Proceedings of the National Academy of Sciences. 99 (2002) 2754–2759. doi:10.1073/pnas.052706099.
[13] E.J. Deeds, O. Ashenberg, J. Gerardin, E.I. Shakhnovich, Robust protein protein interactions in crowded cellular environments, Proceedings of the National Academy of Sciences. 104 (2007) 14952– 14957. doi:10.1073/pnas.0702766104.
[14] S. Pechmann, E.D. Levy, G.G. Tartaglia, M. Vendruscolo, Physicochemical principles that regulate the competition between functional and dysfunctional association of proteins, Proceedings of the National Academy of Sciences. 106 (2009) 10159–10164. doi:10.1073/pnas.0812414106.
[15] J. Karanicolas, J.E. Corn, I. Chen, L.A. Joachimiak, O. Dym, S.H. Peck, S. Albeck, T. Unger, W. Hu, G. Liu, S. Delbecq, G. T. Montelione, C. P. Spiegel, D.R. Liu, D. Baker, A De Novo Protein Binding Pair By Computational Design and Directed Evolution, Molecular Cell. 42 (2011) 250–260. doi:10.1016/j.molcel.2011.03.010.
[16] H. Garcia-Seisdedos, C. Empereur-Mot, N. Elad, E.D. Levy, Proteins evolve on the edge of supramolecular self-assembly, Nature. 548 (2017) 244–247. doi:10.1038/nature23320.
[17] P. Aloy, H. Ceulemans, A. Stark, R.B. Russell, The Relationship Between Sequence and Interaction Divergence in Proteins, Journal of Molecular Biology. 332 (2003) 989–998. doi:10.1016/j.jmb.2003.07.006.
[18] M. Heo, S. Maslov, E. Shakhnovich, Topology of protein interaction network shapes protein abundances and strengths of their functional and nonspecific interactions, Proceedings of the National Academy of Sciences. 108 (2011) 4258–4263. doi:10.1073/pnas.1009392108.
[19] Q. Wang, A. Zhuravleva, L.M. Gierasch, Exploring Weak, Transient Protein–Protein Interactions in Crowded In Vivo Environments by In-Cell Nuclear Magnetic Resonance Spectroscopy, Biochemistry. 50 (2011) 9225–9236. doi:10.1021/bi201287e.
[20] N. Zhang, L. An, J. Li, Z. Liu, L. Yao, Quinary Interactions Weaken the Electric Field Generated by Protein Side-Chain Charges in the Cell-like Environment, J. Am. Chem. Soc. 139 (2017) 647–654. doi:10.1021/jacs.6b11058.
[21] X. Mu, S. Choi, L. Lang, D. Mowray, N.V. Dokholyan, J. Danielsson, M. Oliveberg, Physicochemical code for quinary protein interactions in Escherichia coli, Proc Natl Acad Sci USA. 114 (2017) E4556– E4563. doi:10.1073/pnas.1621227114.
[22] C. Pal, B. Papp, L.D. Hurst, Highly Expressed Genes in Yeast Evolve Slowly, Genetics. 158 (2001) 927–931.
[23] D.A. Drummond, C.O. Wilke, Mistranslation-Induced Protein Misfolding as a Dominant Constraint on Coding-Sequence Evolution, Cell. 134 (2008) 341–352. doi:10.1016/j.cell.2008.05.042.
[24] J. Zhang, S. Maslov, E.I. Shakhnovich, Constraints imposed by non-functional protein–protein interactions on gene expression and proteome size, Molecular Systems Biology. 4 (2008). doi:10.1038/msb.2008.48.
[25] E.D. Levy, S. De, S.A. Teichmann, Cellular crowding imposes global constraints on the chemistry and evolution of proteomes, Proceedings of the National Academy of Sciences. 109 (2012) 20461–20466. doi:10.1073/pnas.1209312109.
[26] J.-R. Yang, B.-Y. Liao, S.-M. Zhuang, J. Zhang, Protein misinteraction avoidance causes highly expressed proteins to evolve slowly, Proceedings of the National Academy of Sciences. 109 (2012) E831–E840. doi:10.1073/pnas.1117408109.
[27] P.E. Schavemaker, W.M. Śmigiel, B. Poolman, Ribosome surface properties may impose limits on the nature of the cytoplasmic proteome, ELife. 6 (2017) e30084. doi:10.7554/eLife.30084.
[28] D.W. Ritchie, V. Venkatraman, Ultra-fast FFT protein docking on graphics processors, Bioinformatics. 26 (2010) 2398–2405. doi:10.1093/bioinformatics/btq444.