HAL Id: hal-02176597
https://hal.archives-ouvertes.fr/hal-02176597
Submitted on 8 Jul 2019
HAL is a multi-disciplinary open access
archive for the deposit and dissemination of
sci-L’archive ouverte pluridisciplinaire HAL, est
destinée au dépôt et à la diffusion de documents
Multiple Fabric Assessment: Focus on Method
Versatility and Flexibility
Alessandro Araldi, Joan Perez, Giovanni Fusco, Takashi Fuse
To cite this version:
Alessandro Araldi, Joan Perez, Giovanni Fusco, Takashi Fuse. Multiple Fabric Assessment: Focus on
Method Versatility and Flexibility. 18th Computational Science and Its Applications – ICCSA 2018,
Jul 2018, Melbourne, Australia. �10.1007/978-3-319-95168-3_17�. �hal-02176597�
Multiple Fabric Assessment: Focus on Method
Versatility and Flexibility
Alessandro Araldi1, Joan Perez2, Giovanni Fusco1, Takashi Fuse2 1Université Côte-Azur, CNRS, ESPACE, Nice, France
2The University of Tokyo, Regional Planning and Information Laboratory, Tokyo, Japan
{alessandro.araldi,giovanni.fusco}@unice.fr [email protected] [email protected]
Abstract. Metropolitan regions are very complex spaces for geographical
analysis, above all due to their strong heterogeneity at the intra-urban level. This paper presents the progresses made by Multiple Fabric Assessment (MFA), a method specifically conceived for describing urban fabrics from the pedestrian perspective. To sum up, standard spatial units are first defined (Proximity Bands) and specific indicators are calculated at this level. Then, patterns amongst space are identified and clustered. The application of MFA method to new case studies (Marseille, Osaka, Rio de Janeiro and Brussels) has brought to highlight several peculiarities related to data availability, intrinsic urban space characteristics and aim of application. This paper collects the experiences gathered from these new case studies, highlighting key aspects that academics and practitioners should deal with, when using MFA. Our results show a versatile and flexible method, able to be adapt itself to any case study if not limited by data availability.
Keywords: Urban Fabric · Multiple Fabric Assessment · Clustering ·
Geoprocessing.
1
Introduction: Seeking Human Scale in Urban Fabric Analysis
Since Jacobs defended in The Death and Life of Great American Cities (1961) [1] that modern planning was not taking into account the needs of city-dwellers, academics and practitioners have increasingly worked on the importance of the pedestrian/citizen point of view in urban studies, policies and planning. During the previous decades, the study orientations have shifted from functional car-oriented planning (Brasilia paradigm) to more human scaled perspectives [2,3]. This evolution, initially driven and supported by socio-economic studies [1,4,5], has recently been reinforced by new topics such as health, sustainability, walkability and pedestrian security [6,7,8].In urban planning studies, this new tendency is well reflected within the several guidelines published by The National Association of City Transportation Officials (NACTO, 2013; 2015; 2017) [9-11]. These reports, mostly for the attention of urban scientists, policy makers and planners, collect principles and examples of good practices within the aim of designing aesthetic and functional streets in different urban
fabric contexts. The following opening sentence of the 2017 guideline resumes the position adopted by the aforementioned publications: ‘(the aim) […] is to inspire
leaders, inform practitioners, and empower communities to design streets that put people first’. Overall, the human scale perspective is today more and more integrated
within urban street projects and concepts in cities around the world.
In architecture, the human scale hasn’t been left behind neither, especially within given urban fabrics. The focus on palace-specific relationships between inhabitants (people) and inhabited (buildings), has overtaken the modernist approach by Le Corbusier based on abstract, mainly functional, universal needs. To name but just a few of these concepts, the “edges” defined as entities that have to be as much transparent as possible and located where ‘the city and building meet’ (Gehl, 2010, p. 79) [3]; the “active/passive storefront” also named ground floor interface [3], the “parterre” referred as a holistic urban interface including both streets and private spaces connected to them [12], etc.
Architecture and urban design studies are mostly focused at the scale of a given project: building, streets or neighborhoods, thus lacking of a deeper comprehension of the complexity of the urban forms within a metropolitan space. Understanding the range of urban fabrics within a metropolitan area can for example help new projects to be implemented and evaluated in relation to specific urban contexts. When considering and analyzing the urban heterogeneity of a whole metropolitan region, we can identify uneven capacities of spaces as regards to integrating and internalizing urban paradigms. It is a known fact that urban disparities have a direct influence on implementation of new policies, smart city technologies, architectural programs, citizen’s health, standard of livings, etc. From this perspective, urban fabrics shall be considered as the original and unique outcome of conscious and unconscious design and planning activities [13]. This outcome has an impact on the everyday perception of urban space: while walking in a city, pedestrians experience a complex spatial combination of urban fabrics with heterogeneous characteristics.
Quantitative urban geography, thanks to ever-growing data availability and powerful geoprocessing tools is well positioned to study urban fabrics and design [14], especially in large scale approach. New geoprocessing methods capable of integrating the multidimensional character of urban fabrics are regularly proposed. Mentions shall be made of the identification of typo-morphologies of urban blocks through a set of density variables [15]; surface distribution of built-up elements through fractal analysis [16-17]; historical analysis and urban fabric formation using GIS platforms and computer-aided measurement [18], inductive k-means segmentation of city blocks [19,20], etc.
Nevertheless, while architecture and urban design have well integrated the concept of human scale, urban geography approaches neglect the pedestrian perception since the aforementioned studies always adopt an aerial point of view. Configurational methods such as Space syntax [21,22] or Multiple Centrality Assessment [23,24] represent interesting propositions to study urban networks from a pedestrian-centered point of view. Yet, these approaches analyze urban networks centrality and accessibility properties. For this reason, these methods are extensively used in walkability studies but they cannot identify urban fabrics and their related features.
Multiple Fabric Assessment (abbr. MFA), has been proposed to integrate the human scale perspective in urban fabric studies through a combination of powerful geoprocessing methods [25-28]. MFA diverges considerably from most of the aforementioned studies since it is centered on urban spaces as they can be perceived by pedestrians, still sharing the same goal of identifying and characterizing urban fabrics. It also differs from configurational methods since it considers the composition of urban form elements (parcels, buildings, streets) and their geometrical and spatial relations. The objectives for MFA method are to move: (i) from manual calculations to a systematic geoprocessing method; (ii) from the planner’s aerial point of view to the pedestrian point of view; (iii) from an expert-based recognition of urban fabric types to a bottom-up inferential procedure; (iv) from small scale-analysis of neighborhoods to the analysis of a whole metropolitan area. Some of these goals go hand in hand since for example, only automated and bottom-up geoprocessing protocols allow analyzing vast metropolitan areas.
Until now, MFA has been developed through the pilot case study of the French Riviera. Several scientific collaborations have recently allowed confronting MFA to other case studies, notably Osaka (Japan) and Marseille (France) metropolitan regions as well as the urban cores of Brussels (Belgium) and Rio de Janeiro (Brazil). During the MFA’s application to these case studies, the following issues have arisen: (i) Data availability; (ii) Urban fabric peculiarities related to case studies; (iii) Final scope of MFA’s application. In this paper, the versatility of the Multiple Fabric Assessment methodological protocol is discussed considering the three aforementioned aspects. The adaptability of MFA results in cross-analysis studies between urban form and urban functioning is also discussed. The final goal of this paper is to disclose to fellow researchers solutions about methodological issues and difficulties arising when applying MFA analysis, rather than focusing on specific outcomes of a given study area. The analysis of urban fabrics in the different case studies, as produced by the application of MFA, will be the object of a future paper.
This paper is organized as follows. Section 2 provides a short reminder of the MFA methodology. Section 3 focuses on dataset minimum requirement and constitution of spatial units. Section 4 focuses on MFA’s adaptability as regards to data availability and urban-peculiarities. Section 5 presents MFA’s flexibility regarding the scope of analysis and highlights cross-analysis opportunities. Geoprocessing solutions are provided along the text. The paper concludes with a discussion on future developments, notably with the development of automated functions for MFA.
2
The Multiple Fabric Assessment Protocol
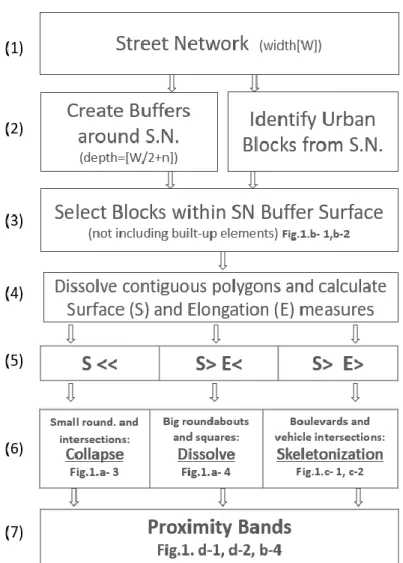
To begin with, MFA’s protocol needs standard spatial units to be analyzed. From a conceptual point of view, in MFA approach, public space cannot be reduced to boundaries with and between city blocks and buildings. They should be considered as the central component of the analysis since the city is studied from a pedestrian perspective. On the basis of this principle, MFA proposes a new spatial unit concept: the proximity band.
Proximity bands are constructed through the generalized Thiessen Polygon built for and around each street network segment, limited at a given width (10, 20 and 50 meters according to calculated indicators, Figure 1: d1-d2-b4). Squares are important elements of cities often neglected in geoprocessing algorithms such as in Space Syntax and Multiple Centrality Assessment configurational approaches. By contrast, MFA does not consider the urban space by its street network or through its properties of connectivity and centrality since it rather takes into consideration contiguous polygons with a topological structure between them. Urban morphological elements are latter gathered at this scale and analyzed. From a conceptual point of view, squares and streets are considered with the same importance. Within and around these spatial units, data are collected and indicators of urban morphology calculated.
MFA protocol can be divided into the following steps:
1) Geoprocessing algorithms that calculate specific morphological indicators for analyzing urban fabrics;
2) Identification of patterns amongst space. Local Indicator of Spatial Associations on a topological Network Constrained Space (ILINCS [29]) are used in order to identify significant spatial patterns of presence/absence of local distribution for each morphological indicator [30]. The significance of these patterns is evaluated considering the variability of each indicator within space (relative measure).
3) Clustering of local patterns through Bayesian probabilities in order to identify and characterize urban fabrics: spatial units are finally described by probability values of assignment to each resulting class.
In the French Riviera case study [25-28], high quality data about street network (used for both PB creation and indicator calculations), buildings, parcels and elevation were made available by the French National Geographic Institute (IGN). From there, 21 indicators of urban form have been implemented and calculated at the proximity band level. Data and indicators were selected after literature review, combined with field observations of the urban space characteristics of the specific case study. As discussed in the following section, different aspects of urban fabrics could emerge as essential features to be taken into account when trying to identify urban fabrics in other case studies. New York, for example, could require specific indicators to highlight patterns of building height while European cities need more attention for the features of old city centers. Sustainable experimental cities, such as Freiburg, may require a specific attention on bicycle paths, while green spaces could characterize specific fabrics in British and North American garden cities. Each city needs to be described by the set of indicators that best encompass the heterogeneity and peculiarities of its own patterns and dynamics. At the same time, data availability can positively influence or reduce the range of possible choices.
3
Dataset Minimum Requirement and Proximity Band
Construction
The bare minimum dataset required to implement MFA is composed by (i) streets and their related surfaces (ii) building footprints with heights. Depending on data sources, the street layer can be available in a polyline format with relative widths for each segment (i.e. categorical widths for the French IGN BDTOPO, Digital Road Map of Japan, Open Street Map, etc.) and/or in a polygonal format with real widths (i.e. UrbIS in Brussels). Polyline formats usually cover large regions while polygonal formats are usually delivered by local bodies and cover smaller but denser urbanized spaces.
A typical street network dataset is not well-suited for MFA application since the following problems usually arise: (1) Presence of highways, tunnels and all other elements non accessible by pedestrians; (2) Absence of pedestrian paths, such as the ones going through parks, subdivisions and building compounds; (3) Streets are usually represented by a combination of multiple lines (large avenues and boulevards, Figure 1: a2). (4) Roundabouts and large vehicle intersections usually represented by a combination of several short segments or by their fragmented perimeters (Figure 1: a1-a3- a4).
Figure 1: Network Correction Example through Geoprocessing. [1 to 4]: inconsistencies in street
network; b. [1, 2] identification of inconsistencies (Figure 2); c. [1, 2] skeletonization correction; d. [1, 2] and b. [4] Street surface (light gray) and Proximity Bands (10 and 50 meters).
When proximity bands are implemented, some inconsistencies in the partition of space can be generated. Since these inconsistencies have undesired consequences on the further MFA protocol (incoherent indicators with odd statistic distributions and distortion of topological contiguity), pre-processing the data before implementing the
proximity bands becomes a mandatory step. Avoiding this step would lead to non-significant spatial pattern identification (ILINCS) thus compromising the final clustering. While pre-processing for (1) and (2) consist of manually adding and/or erasing features, (3) and (4) require more elaborated geoprocessing algorithms. The challenge consists in finding good algorithms applicable to large case studies without forgetting that we are looking for a human scale spatial unit.
Figure 2: Network Correction Example through Geoprocessing Algorithms
Figure 2: step 1 to 4 provides an example of a simple algorithm used to identify inconsistencies. In order to correct these features, two geometrical descriptors are employed: Surface (S) and Elongation (E) implemented as the ratio between the building perimeter and the one of the circle of equivalent surface. Figure2: step 5 to 6 show the corrections carried out according to the combination of these two parameters.
Proximity Bands are ultimately implemented using the corrected network (Figure 2:
step7). The application of this corrective procedure to Marseille and Osaka street
networks, for example, results in a reduction of respectively 21,2 and 21,76% of the number of street segments. This pre-processing operation represents an important step allowing a more coherent implementation of the Proximity Bands spatial unit and for a reduction of the processing time for the following steps of the MFA methodology.
This algorithm is a heuristic of network pre-processing: more possibilities can be developed depending on data availability and quality. Other problems can also arise and influence the final partition.
Proximity Bands are more than a simple partition of space: they have a direct influence on indicator implementations and on pattern identifications through their topological network-constrained structure. In most of urban geography literature discussed in Section 1, urban fabric descriptors are intrinsic to each spatial unit. In such cases, non-consistent spatial units can simply be ignored. In MFA however, patterns of indicators are strictly dependent on the local configuration of Proximity Bands. As a result, ignoring some spatial units would result in a distortion of topological contiguity and lead to the impossibility of applying the spatial pattern identification step. Pre-processing procedures are thus mandatory in MFA.
4
Conceiving Indicators based on Data Availability and Urban
Fabric Peculiarities
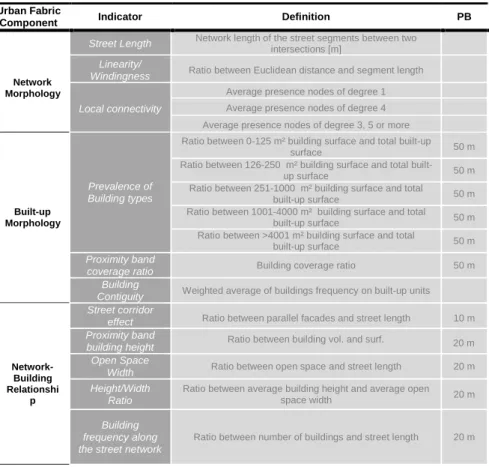
With the bare minimum dataset (streets and building footprints with heights), almost a dozen of indicators can be implemented (Table 1). Each indicator is conceived as the quantification of a particular aspect of the urban form. More accurate data (as 3D building information) or the availability of other levels of information (i.e. detailed building morphology, green spaces, sidewalks, etc.) might be used in order to implement new indicators or to improve the ones in Table 1. Conversely, the lack of data or the existence of peculiarities within certain datasets can severely limit the application of MFA. For example, the case study of Rio de Janeiro unveiled the fact that Brazilian favelas are digitized as zoned polygons within the official building dataset of Rio prefecture. Slums are covering large surface areas in numerous cities with developing economies. Since accurate datasets about slums are rarely available, MFA has up to now yet to find a solution to process these peculiar areas.
MFA can be considered as a data-driven segmentation method since for each indicator and case study, theories elaborated in urban morphology studies [31], environmental psychology1 and architecture [34, 35] are used only as general
1 In Environmental Psychology literature, the individual perception of urban spaces is influenced by the physical features, the urban design qualities, the individual reactions and their combinations [36]. The first aspect is the most objective one and is easily measurable through geoprocessing algorithms. The others lack coverage, data availability and their subjective natures make them hard to implement.
guidelines for selecting morphological indicators: urban fabrics are later identified and characterized from data analysis. Below are some examples of indicators implemented depending on both data availability and urban peculiarities of the case study at hand.
Surface Slope and Street Acclivity
:
When the urban space analyzed shows specific natural characteristics, other data are necessary. Due to a constrained topography in the French Riviera case study, the site morphology has profoundly influenced the constitution of urban fabric through time. The obtainment of a digital elevation raster model allowed calculating: (1) the surface slopes as a ratio of high-sloped spaces (>30°) within the 50 meters PB; (2) the street acclivity, computed as the average of the slope along the street axes. These two indicators have been of a paramount importance in the identification of urban fabrics within the Riviera case study. However, they have been of a slightly less importance in Marseille (less constrained) and Osaka (due to cultural habits and religious beliefs, Japanese urbanization did not develop on the hills surrounding the coastal plains) case studies. The relatively flat topography of Brussels (maximum elevation difference of 100 meters) does not show significant patterns, suggesting the non-inclusion of these indicators within the matrix.Table 1: MFA Indicators List with the Bare Minimum Dataset (streets, buildings with heights)
Urban Fabric
Component Indicator Definition PB
Network Morphology
Street Length Network length of the street segments between two intersections [m] Linearity/
Windingness Ratio between Euclidean distance and segment length
Local connectivity
Average presence nodes of degree 1 Average presence nodes of degree 4 Average presence nodes of degree 3, 5 or more
Built-up Morphology
Prevalence of Building types
Ratio between 0-125 m² building surface and total built-up
surface 50 m
Ratio between 126-250 m² building surface and total
built-up surface 50 m
Ratio between 251-1000 m² building surface and total
built-up surface 50 m
Ratio between 1001-4000 m² building surface and total
built-up surface 50 m
Ratio between >4001 m² building surface and total
built-up surface 50 m
Proximity band
coverage ratio Building coverage ratio 50 m Building
Contiguity Weighted average of buildings frequency on built-up units
Network-Building Relationshi
p
Street corridor
effect Ratio between parallel facades and street length 10 m Proximity band
building height Ratio between building vol. and surf. 20 m Open Space
Width Ratio between open space and street length 20 m Height/Width
Ratio
Ratio between average building height and average open
space width 20 m
Building frequency along the street network
Facades Horizontal alignment
:
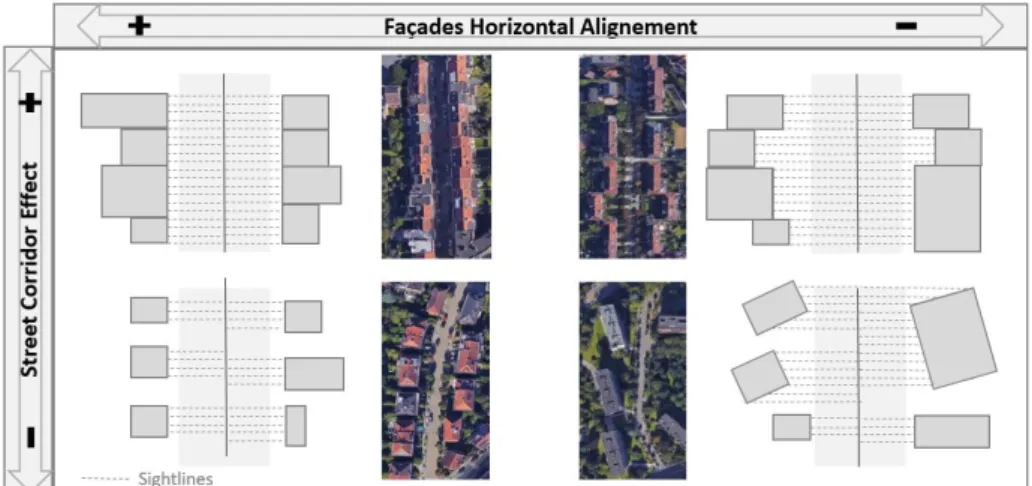
“Street Corridor Effect” indicator (Table 1) is implemented as the ratio between the total length of facades parallel to the street and its length. This indicator is intended to quantify the corridor effect (driving the sight of a pedestrian moving in a city) generated by buildings disposition along both sides of a street. This indicator is self-sufficient when the Proximity Band building coverage ratio is high as it happens in western historical centers. When this ratio is lower, such as in modern neighborhoods, peripheral areas, new planned cities, etc. the “Street Corridor Effect” may lead to partial/biased results if not combined with the following new indicator: “Facades Horizontal alignment”. This indicator provides additional information about the variability of building footprint setbacks along the street axes. The existence of whole suburbs made of contiguous aligned/ misaligned single-family homes in Osaka case study has unveiled the need of such a measurement.The combination of both “Street Corridor Effect” and “Facades Horizontal alignment” indicators can describe different kinds of urban fabrics since it represents a measure of the arrangement and coordination of built-up elements along a street (Figure 3). When linked to environmental psychology literature, high values of both indicators are related for example to safety and control perception from the pedestrian point of view.
“Facades Horizontal alignment” can be implemented through the generation of uniformly distributed sightlines perpendicular to a street segment on both sides. These sightlines, could range in the empty space between the street centerline and the building footprint1. The variability (measured as standard deviation of sightlines length)
provides the alignment of facades [0= perfectly aligned; >0 misalignment]. This variability, unlike other coverage ratio measures, is the result of an asymmetric implementation: first, distribution values (central and dispersion measures) are implemented considering left and right sightlines separately2; second, these values are
combined into a single indicator.
Vertical alignment
:
In a similar fashion than for the previous indicator, it is possible to measure the “Vertical alignment” (heights) as the variability of building heights along a street segment. As discussed in Section 2, this indicator could highlight patterns of building heights within cities known for the verticality of their urbanization. The same sightlines generated for horizontal alignment, can be used for implementing vertical alignment: the association of building height in contact with sightline extremity, provides the right and left set of measures on which the vertical variability is calculated. Figure 4 illustrates the combination between vertical and horizontal alignment.Alignment indicators have another interesting advantage (besides their urban interpretation) in their capacity to capture the variability of urban features within the Proximity Bands (other indicators are implemented as ratios or density measures). This
1The setback is considered here as the distance between the street edge and the building footprint. If a more
detailed layer is available (3D), setback generated by porches, arcades, and storefront could be calculated in order to obtain even more accurate results.
notion could be replicated in analyzing variability in facade colors, building age, or any other variables, depending on data availability.
Other indicators (which have yet to be implemented within a MFA case study)
could arise from the environmental dimension of urban space [34]. The interpretation of this specific aspect of urban space from the pedestrian point of view can generate a new family of indicators that could be integrated in MFA. For example, a measure of “street luminosity” can be calculated using street orientation, building heights and solar irradiation at the ground level. This indicator, together with Height/width ratio, (also known as the “canyon effect”), should be able to measure phenomena known for having an influence on urban air quality and temperature. All of these indicators influencing the bioclimatic form of a city can be added within MFA.
Fig. 3: “Street Corridor Effect” and “Facades Horizontal Alignment” Gradients Example
Spatial disposition and quantity of vegetation in relation to built-up elements could also be integrated. From the pedestrian point of view, three layers of greenery can be distinguished from the distance to street space (corresponding to proximity bands buffer’s distances). The first level should consider the presence of trees in the public space within and along the street surface. These elements are typically used as protection from sunrays and participate fully to the design of public space. Yet, they also induce a reduction of car speed and represent a natural barrier from accidents between motorized vehicles and pedestrians. The second level should consider vegetation density within the closest spaces to the street sides (10-20 meters) in order to include front gardens, vegetated setbacks, etc. The last layer should consider the global coverage ratio of vegetation within a deeper proximity band (50 meters) in order to detect the presence of parks and larger vegetated private areas.
Other possibilities can be found in visibility studies [37] with indicators related to natural luminosity of public spaces, sky view factor, 2D and 3D Isovists, etc. but also from the relation between sidewalk and pedestrian space. Average width of sidewalks and ratio between pedestrian dedicated space and street surface are two factors that for example boost walkability and consequently citizen health [8].
It is impossible to make an exhaustive list of potential indicators to be implemented with the exception of the first layer of information (Table 1), MFA inputs are typically not set in stone. As compared to other methods, MFA shall be fed by additional subset of indicators selected according to the aspects of urban fabrics in which a researcher is interested. It thus brings us to the next section focusing on how to choose the right combination.
5
Flexibility of MFA’s Objectives, Data Redundancy and Cross
Analysis
MFA should be considered as a flexible and robust framework allowing a researcher to focus on a wide range of topics though a major focus on pedestrian perspective.
Yet, the scope of MFA remains the detection and classification of different urban fabrics considering one or several specific aspects of urban form or urban life that should be decided before even the beginning of the data collection phase. Application of MFA could consider (separately or conjointly): i) analysis of historical processes behind observed morphologies; ii) comparative analysis within different urban contexts; iii) cross-analysis of urban form and urban functioning (or human behavior). Depending on these categories of study, we can enrich the MFA first layer of information (Table 1) through the implementation/materialization of subsets of specific or ad hoc indicators adapted to the urban peculiarities of the case study (as previously discussed).
If a wide range of data are available, an extensive number of indicators can possibly be implemented, thus raising the question on the existence of a threshold limiting the
number of inputs. As things stand, in its final phase, MFA uses a Bayesian Networks1 segmentation protocol in which outputs are not affected by multi-collinearity issues. Yet, using an extensive number of indicators as raw inputs is unequivocally increasing the complexity when interpreting the final results.
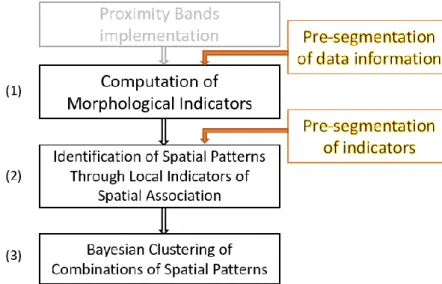
A potential solution to reduce the number of inputs is found through the application of pre-segmentation algorithms within thematic categories of indicators which are jointly describing a more specific aspect of urban fabrics. These pre-segmentations can also be performed using raw inputs before their integration at the proximity band level. At this stage, a simple k-means can for example be employed as well as more robust methods such as the one used in the last phase of the MFA protocol. The labelled outputs of these pre-segmentations then replace the former subset of indicators. The aforementioned can be considered as an optional phase within the protocol proposed in Section 2 that could be implemented both before and after the second step of MFA methodology (Figure 5) since local indicator of spatial associations are then applied to the pre-segmentations outputs.
Building types are considered in traditional studies as being one of the main components of urban fabrics when focusing on built-up forms [31]. The first application of the MFA protocol to the French Riviera, approximated building types with classes of building footprint surface. Additional indicators were used to specify the adjoining relationships among buildings, their specialization, their height, and so on. Indicators of shape, construction period or facade style could also be added. Rather than considering these indicators separately, the application of pre-segmentation of building types could lead to a reduction of the number of inputs, without any loss of
1Other segmentation algorithms in which highly correlated variables will not cause multi-collinearity issues
can be envisaged such as Super-Organizing-Maps, Random Forest, etc.
information. Several tests have been conducted for Marseille and Osaka case studies and some yielded highly satisfactory results (detailed in [39]).
Figure 6 illustrates the output of a pre-segmentation for Osaka made using the following six raw indicators about buildings: “footprint surface”, “elongation”, “convexity”, “number of adjoining neighbors”, “height”, and “specialization”. Indicators are discretized and clustered using a standard Bayesian Classifier [32]. The proportion of each building type are then calculated at the Proximity Band level in order to replace “Prevalence of Building types” and “Building contiguity” categories within Table 1.
Another peculiarity of MFA is the information about the probability of assignment of each street segment to each class resulting from the Bayesian clustering. Thus, in addition to be able to get back to the original continuous values of each indicator for each urban fabric class (as for traditional methods), it is also possible to analyze to which extent a particular Proximity Band segment belongs to each urban fabric class in probability. The study of urban fabrics and their relations to urban functioning and human behavior could be explored through the cross-analysis of MFA results with other inputs such as socio-demographic or economic data.
Fig. 6: Building Families obtained in Osaka
As illustrated in Figure 7, transportation flows, network configuration, electoral results, retail density, human health, neighborhood satisfaction, real estate values, distribution (and dynamics) of socioeconomic activity, are only some examples of field of study where MFA could bring new and deeper understanding. Thanks to
technological progress, geo-located and geocoded punctual data are more and more common. Within punctual geocoded datasets, information is localized on network using the address attributes. In such cases, it is possible to match these data directly at the point distribution level to both urban fabric results and individual MFA indicators.
Other cases include aggregated data (administrative divisions, grid patterns, etc.) and raster data. In these situations, several options can be envisaged such as recovering the MFA results on another level using the probability information, using a choropleth partition of the Generalized Thiessen Polygon to redistribute socioeconomic data on network [38], etc. Since coupling MFA results with datasets on another level has yet to be done, this last point will be discussed in the following and conclusive section.
Fig.7: MFA’s Cross-analyses Examples
6
Discussions and Future Developments
The application of MFA method to new case studies has brought to light several peculiarities related to data availability, intrinsic urban space characteristics and aim of application. This paper collects the experiences gathered from these new case studies, highlighting key aspects that academics and practitioners should deal with, when using MFA. Some solutions through geoprocessing algorithms have been provided as well as new indicators related to urban peculiarities, thus underlying the high degree of versatility and flexibility of the method.
Two fundamental limitations should be mentioned. First, lack of data or poor data quality could compromise the protocol as it has been the case for Rio de Janeiro. MFA should be considered as a framework for the study of urban fabric at the finest scale of the street level, whose patterns are identified on large-scale applications. When studying metropolitan areas and whole urban regions, the heterogeneity in indicator variabilities are keys to the success of its application. Limitations of MFA could emerge in homogenous (new planned cities) and/or small space application (villages).
The second limitation is linked to the human scale level concept which is at the origin of the method. MFA is well adapted for pedestrian (or more generally network-based) phenomena. In case of bi/tri-dimensional spatial correlations (i.e. pollution and other environmental patterns) of phenomena, other methods should be considered.
MFA researches are currently extended in several directions. Cross analyses with socio-demographic data and configurational results are currently in progress for Marseille and Osaka case studies, while new categories related to vegetation and citizen’s health are under investigations for Brussels. Diachronic analysis of urban fabric represents another interesting field of research: applying MFA to several historical datasets of the same urban region, would disclose information about the spatial evolution of urban fabrics as well as the genesis of new ones.
Programming is currently under development in order to automate network corrections, proximity band constitution and indicator calculations. The final goal would be to provide to the scientific community interested in urban studies GIS toolboxes able to perform some parts of the MFA protocol.
Acknowledgements. This research was carried out thanks to a research grant of the
Nice Côte d’Azur Chamber of Commerce and Industry (CIFRE agreement with UMR ESPACE) as well as a Grant-in-Aid for Scientific Research from the Japan Society for the Promotion of Science (JSPS). This study was supported by Joint Research Program No. 774 at CSIS, UTokyo (Zmap TOWN II 2013/14 Shapefile Osaka prefecture, Digital Road Map Database extended version 2015).
References
1. Jacobs J. (1961) The Death and Life of Great American Cities. Random House: New York. 2. Gehl J. (1987) Life Between Buildings: Using Public Space. Van Nostrand Reinhold, New
York.
3. Gehl J. (2010) Cities for People. Island Press.
4. Lynch K. (1960) The Image of the City. Cambridge (MA): MIT Press. 5. Whyte W H. (1980) The social life of small urban spaces.
6. Farr D (2008). Sustainable Urbanism. Urban Design with Nature. John Wiley & Sons. New Jersey
7. Carmona M. (2001). 11 Sustainable Urban Design-A Possible Agenda. Planning for a Sustainable Future, 165.
8. Talen E, Koschinsky J. (2014). Compact, walkable, diverse neighborhoods: Assessing effects on residents. Housing Policy Debate, 24(4), 717-750.
9. National Association of City Transportation Officials (2013) Urban Street Design Guide, NACTO Guidelines.
10. National Association of City Transportation Officials (2015) Transit Street Design Guide, NACTO Guidelines.
11. National Association of City Transportation Officials (2017) Global Street Design Guide, NACTO Guidelines.
12. Psenner A. (2014). A Smart Researching and Planning Tool for the Neuralgic Urban Zone: 3D-ZPA. In REAL CORP 2014–PLAN IT SMART! Clever Solutions for Smart Cities. Proc. of 19th Int. Conf. on Urban Planning, Regional Development and Information Society (pp. 35-44).
14. Talen E (2011). The geospatial dimension in urban design. Journal of Urban Design, 16(1), 127-149.
15. Berghauser Pont M Y, Haupt P (2010) SPACEMATRIX, Space, Density and Urban Form. Rotterdam: NAi Publishers.
16. Frankhauser P (1994). La fractalité des structures urbaines. Villes, Anthropos, Paris. 17. Thomas I et al. (2007) Fractal dimension versus density of built-up surfaces in the periphery
of Brussels. Papers in Regional Science, 86: 287–308.
18. Gil J et al. (2012). On the discovery of urban typologies: data mining the many dimensions of urban form. Urban morphology, 16(1), 27.
19. Bernabé A et al. (2013) Classification automatique des tissus urbains par la méthode des nuées dynamiques. 31e Rencontres AUGC, Cachan, France
20. Royall R A, Wortmann T (2015) “Finding the State Space of Urban Regeneration: Modeling Gentrification as a Probabilistic Process using k-Means Clustering and Markov Models.” In CUPUM 2015 proceedings, Paper 275
21. Hillier B, Hanson J. (1984). The social logic of space, 1984. Cambridge: Press syndicate of the University of Cambridge.
22. Hillier B (1998) Space is the machine, Cambridge: Cambridge University Press
23. Porta S et al. (2006) The network analysis of urban streets: a primal approach. Environment and Planning B: Planning and Design 33(5):705-725.
24. Sevtsuk A (2014). Location and agglomeration: The distribution of retail and food businesses in dense urban environments. Jour. of Plann. Ed. and Res., 34(4), 374-393.
25. Araldi A., Fusco G (2016). Urban Form from the Pedestrian Point of View: Spatial Patterns on a Street Network. INPUT 2016, Turin, Italy Sept. 14th-15th 2016, Proc.INPUT 2016 pp. 32-37. https://hal.archives-ouvertes.fr/hal-01417484/document
26. Araldi A, Fusco G (2017). Decomposing and Recomposing Urban Fabric: The City from the Pedestrian Point of View. In Int. Conf. on Comp. Science and Its Applications (pp. 365-376). Springer, Cham.
27. Fusco G, Araldi A (2017) The Nine Forms of the French Riviera: Classifying Urban Fabrics from the Pedestrian Perspective, ISUF 2017 XXIV international conference: City and territory in the globalization age, Proceedings, (in press).
28. Fusco G, Araldi A (2017) Significant Patterns in Urban Form. Spatial Analysis of Morphological Indicators. Revue Internationale de Geomatique, 27, 4(2017), 455-479. 29. Yamada I, Thill J C (2010) Local indicators of network-constrained clusters in spatial patterns
represented by a link attribute. Annals of the Ass. of Am.Geog.100(2):269-285. 30. Anselin L (1995) Local Indicators of spatial association. Geog. Analysis 27(2): 93-115. 31. Caniggia G, Maffei G (1979) Lettura dell’edilizia di base. Firenze, Alinea.
32. Duda RO, Hart PE (1973) Pattern classification and scene analysis. New York, NY: John Wiley & Sons.
33. Ewing R. Handy S (2009). Measuring the unmeasurable: Urban design qualities related to walkability. Journal of Urban design, 14(1), 65-84.
34. Alexander C (1977). A pattern language: towns, buildings, construction. Oxford univ. press. 35. Lévy A. (2005). Formes urbaines et significations: revisiter la morphologie urbaine. Espaces
et sociétés, (3), 25-48.
36. Lynch, K. (1960). The image of the city. Cambridge, MA: MIT Press
37. Benedikt M. L. (1979). To take hold of space: isovists and isovist fields. Environment and Planning B: Planning and design, 6(1), 47-65.
38. Okabe A, Sugihara K (2012) Spatial Analysis along Networks: Statistical and Computational Methods John Wiley & Sons, Ltd.
39. Perez, J., Fusco, G., Araldi, A. and Fuse, T. (2018) Building Typologies for Urban Fabric Classification: Osaka and Marseille Case Studies, International Conference on Spatial Analysis and Modeling, Tokyo Sept 8th-9th 2018, submitted, 13 p.
![Figure 1: Network Correction Example through Geoprocessing. [1 to 4]: inconsistencies in street network; b](https://thumb-eu.123doks.com/thumbv2/123doknet/13268888.397338/6.892.221.686.552.877/figure-network-correction-example-geoprocessing-inconsistencies-street-network.webp)