HAL Id: hal-01347025
https://hal.sorbonne-universite.fr/hal-01347025
Submitted on 20 Jul 2016
HAL is a multi-disciplinary open access
archive for the deposit and dissemination of
sci-entific research documents, whether they are
pub-lished or not. The documents may come from
teaching and research institutions in France or
abroad, or from public or private research centers.
L’archive ouverte pluridisciplinaire HAL, est
destinée au dépôt et à la diffusion de documents
scientifiques de niveau recherche, publiés ou non,
émanant des établissements d’enseignement et de
recherche français ou étrangers, des laboratoires
publics ou privés.
Distributed under a Creative Commons Attribution| 4.0 International License
Combined use of direct analysis in real-time/Orbitrap
mass spectrometry and micro-Raman spectroscopy for
the comprehensive characterization of real explosive
samples
Maxime C. Bridoux, Adrián Schwarzenberg, Sébastien Schramm, Richard B.
Cole
To cite this version:
Maxime C. Bridoux, Adrián Schwarzenberg, Sébastien Schramm, Richard B. Cole. Combined use
of direct analysis in real-time/Orbitrap mass spectrometry and micro-Raman spectroscopy for the
comprehensive characterization of real explosive samples. Analytical and Bioanalytical Chemistry,
Springer Verlag, 2016, pp.1-11. �10.1007/s00216-016-9691-9�. �hal-01347025�
PAPER IN FOREFRONT
Combined use of direct analysis in real-time/Orbitrap mass
spectrometry and micro-Raman spectroscopy
for the comprehensive characterization of real explosive samples
Maxime C. Bridoux1&Adrián Schwarzenberg2&Sébastien Schramm1&Richard B. Cole2
Received: 21 March 2016 / Revised: 25 May 2016 / Accepted: 3 June 2016
# The Author(s) 2016. This article is published with open access at Springerlink.com
Abstract Direct Analysis in Real Time (DART™) high-resolution Orbitrap™ mass spectrometry (HRMS) in combi-nation with Raman microscopy was used for the detailed mo-lecular level characterization of explosives including not only the charge but also the complex matrix of binders, plasticizers, polymers, and other possible organic additives. A total of 15 defused military weapons including grenades, mines, rockets, submunitions, and mortars were examined. Swabs and wipes were used to collect trace (residual) amounts of explosives and their organic constituents from the defused military weapons and micrometer-size explosive particles were transferred using a vacuum suction-impact collection device (vacuum impactor) from wipe and swap samples to an impaction plate made of carbon. The particles deposited on the carbon plate were then characterized using micro-Raman spectroscopy followed by DART-HRMS providing fingerprint signatures of orthogonal nature. The optical microscope of the micro-Raman spectrometer was first used to localize and characterize the explosive charge on the impaction plate which was then targeted for identification by DART-HRMS analysis in both the negative and positive modes. Raman spectra of the explo-sives TNT, RDX and PETN were acquired from micrometer
size particles and characterized by the presence of their char-acteristic Raman bands obtained directly at the surface of the impaction plate nondestructively without further sample prep-aration. Negative mode DART-HRMS confirmed the types of charges contained in the weapons (mainly TNT, RDX, HMX, and PETN; either as individual components or as mixtures). These energetic compounds were mainly detected as deprotonated species [M–H]−, or as adduct [M +35Cl]−, [M +37Cl]−, or [M + NO3]− anions. Chloride adducts were
promoted in the heated DART reagent gas by adding chloro-form vapors to the helium stream using anBin-house^ delivery method. When the polarity was switched to positive mode, DART-HRMS revealed a very complex distribution of poly-meric binders (mainly polyethylene glycols and polypropyl-ene glycols), plasticizers (e.g., dioctyl sebacate, tributyl phos-phate), as well as wax-like compounds whose structural fea-tures could not be precisely assigned. In positive mode, com-pounds were identified either as protonated molecules or am-monium adduct species. These results clearly demonstrate the complementarity of micro-Raman microscopy combined with DART-MS. The former technique provides structural infor-mation on the type of explosives present at the surface of the sample, whereas the latter provides not only a confirmation of the nature of the explosive charge but also useful additional information regarding the nature of the complex organic ma-trix of binders, plasticizers, polymers, oils, and potentially other organic additives and contaminants present in the sam-ple. Combining these two techniques provides a powerful tool for the screening, comprehensive characterization, and differ-entiation of particulate explosive samples for forensic sciences and homeland security applications.
Keywords Direct Analysis in Real Time . Orbitrap MS . Raman microscopy . Real weapons . Explosives . Polymers
Electronic supplementary material The online version of this article (doi:10.1007/s00216-016-9691-9) contains supplementary material, which is available to authorized users.
* Maxime C. Bridoux maxime.bridoux@cea.fr
1
CEA, DAM, DIF, 91297 Arpajon, France
2 UPMC, IPCM/CSOB, UMR 8232, 4 Place Jussieu, 75252 Paris
cedex 05, France
Introduction
The ability to fully characterize at the molecular level a formulation of explosives from trace amounts of samples is vital for homeland security and forensic applications. Most explosives are composed of a charge which consists of a single or a mixture of energetic compounds such as trinitrotoluene (TNT), hexogen (RDX), nitropentaerythritol (PETN), plus a complex matrix of binders, plasticizers, polymers, oils, and potentially other organic additives and contaminants. The detailed characterization of theBmatrix^ surrounding the charge can give significant clues to identi-fying the geograph ic origin of the explosive, the manufacturing process, and perhaps even the lot number [1]. In order to confront terrorist activities and to address issues relevant to the forensic community there is an urgent need to develop techniques that allow the reliable identifi-cation of a broad range of compounds likely to be contained in all types of formulations of explosive devices.
From a practical forensic point of view, the detection technique employed to characterize an explosive material should be capable of a fast, real-time, and highly accurate analysis that does not involve complex sample preparation. These criteria are fulfilled both by the use of ambient ioni-zation sources such as DART (Direct Analysis in Real Time) [2,3], coupled to mass spectrometry (MS) and by the use of micro-Raman spectroscopy. Recent studies have shown the great potential of Raman spectroscopy (a nondestructive technique, although an excessive incident power may ther-mally degrade the sample) for identifying structural and compositional information pertaining to explosives samples [4–7]. An advantage of Raman spectroscopy is its ability to directly probe a sample without the need for chemical or mechanical pretreatment of the specimen. Hence, it has been proposed as an initialBprimary^ screening technique for wipe samples where the presence of explosives is suspected so that follow-up analyses can be subsequently carried out using more sophisticated techniques resulting in minimal sample disruption and consumption of valuable material. The combined usage of DART-MS and Raman spectrosco-py can provide separate, high quality and high resolution spectral fingerprints that are orthogonal in nature [8,9]; each can be employed for identification at trace levels.
Here we report the combined use of ambient mass spec-trometry (DART-Orbitrap MS) and micro-Raman spectros-copy for the detection, comprehensive characterization, and differentiation of explosive particles collected on wipe and swab surfaces by a vacuum suction-impact collection device (vacuum impactor) for forensic applications. A se-ries of samples were examined using cotton swabs and wipes that collected various plastic and nonplastic explo-sives originating from a variety of mines, rockets, mortars, and submunitions.
Materials and methods
Sample collection, preservation, and treatment
Swabs and wipes from different origins and fabrications were collected manually from defused explosive devices. The sam-ples are listed in Table1. The swabs and wipes were placed in a plastic bag that was immediately sealed to protect the samples from potential contamination and stored in the dark at 4 °C.
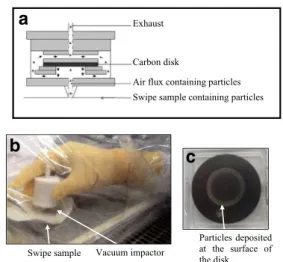
To collect energetic materials from the wipe samples, we used a vacuum suction-impact collection device that was orig-inally designed to collect uranium particles on an impaction plate made of carbon [10]. Briefly, particles in the wipe sam-ple are driven by vacuum pumping at a flow rate of approxi-mately 2.0 L/min and collected onto the carrier (carbon disk) by impaction. A schematic drawing of the vacuum collector apparatus is displayed in Fig.1.
DART ion source conditions
A DART-SVP ion source (Ion Sense, Saugus, MA, USA) interfaced to a LTQ-Orbitrap XL mass spectrometer (Thermo Scientific, San Jose, CA, USA) was used to acquire all mass spectra. Unless otherwise noted, the DART settings were nitrogen/helium gas pressure, 80 psi; gas temperature, 250– 300 °C; grid electrode voltage, 200 V; discharge needle volt-age, +1.5 kV for positive ion mode or−1.5 kV for negative mode. High-purity nitrogen (99.998 %) was used as the stan-dard gas and the gas was automatically switched to high-purity helium (99.998 %) inBrun^ mode. AVapur® (Ion Sense) evac-uated flange was located between the DART ion source and the mass spectrometer. A small membrane pump (Vacuubrand, Wertheim, Germany) was used to create a vacuum in the
Table 1 Samples
collected and analyzed Sample no. Device
1 Mine 2 Dispersed explosive 3 Submunition 4 Submunition 5 Submunition 6 Rocket 7 Rocket 8 Rocket 9 Rocket 10 Grenade 11 Mortar 60 mm 12 Mortar 60 mm 13 Mortar 81 mm 14 Mortar 82 mm 15 Bounding mine
flange. The DART source was oriented such that its outlet was in line with the ceramic tube leading to the flange before the inlet of the mass spectrometer. For some experiments, the DART-SVP source was fitted with a motorized linear rail (transmission mode module). In these experiments, the sam-ples were suspended on a stainless steel mesh and the heated DART ionizing gas passed through the porous sample support enabling efficient ionization of analytes. A constant speed of 2.0 mm/s was used for the motorized linear rail. Chloroform vapors were delivered at a constant flow rate in the helium metastables, between the DART source and the entrance of the mass spectrometer, using the experimental setup shown in Fig. S1 in the Electronic Supplementary Material (ESM). Briefly, a sparger placed in a volumetric flask containing 200 mL of liquid chloroform, and connected to a compressed air gas cylinder, produced chloroform vapors that were deliv-ered to the DART source region using the tip of a pipette.
Mass spectrometry
High resolution (HR) mass spectral measurements were per-formed on a LTQ-Orbitrap XL mass spectrometer. The linear ion trap mass spectrometer settings were capillary voltage, 30 V; tube lens voltage, 100 V; capillary temperature, 200 °C. The ion optics settings were as follows: multiple 1 offset voltage,−4.5 V; multiple 2 offset voltage, −8.0 V; lens 1 voltage,−4.2 V; lens 2 voltage, −15.0 V; gate lens voltage, −35.0 V; front lens voltage, −5.25 V. The mass range typically acquired was m/z 50–1200. The instrument m/z values were calibrated using the manufacturer’s mixture consisting of caf-feine, MRFA (L-methionyl-arginyl-phenylalanyl-alanine
ace-tate monohydrate), and Ultramark 1621. Resonant excitation was carried out using collision-induced dissociation (CID); the LTQ was set to sum 3 microscans, activation time of
30 ms; normalized collision energies (NCE) were between 5 and 30 %, and the precursor ion isolation window was set at 1.0 m/z for all investigated compounds. The ion trap collision cell was supplied with ultra-high purity (99.999 %) helium gas. All data analysis was performed using Thermo Xcalibur™ software. Accurate mass measurements, including those of product ions, were performed at high resolution (re-solving power of 60,000 FWHM at m/z 400).
Micro-Raman spectroscopy
The MRS (micro-Raman spectroscopy) instrument used in this study (Renishaw PLC ‘InVia’, Wotton-Under-Edge, Gloucestershire, UK) was equipped with two lasers: 514 nm (argon gas) and 785 nm (diode semiconductor) with maxi-mum powers of 50 and 300 mW, respectively. Irradiation time, spectral range, and laser power can be easily adjusted to find the best analytical conditions for each compound. Different objectives can be used for laser focusing (×5, ×20, ×50, and × 100). The × 100 objective is preferably used for optimal focusing and obtaining the thinnest beam, with a di-ameter close to 1μm. Calibration of the micro-Raman instru-ment was carried out using the 520.5 cm−1band of a Si wafer. Data acquisition was carried out with the Renishaw WIRE software. Spectra were not corrected for background.
Results and discussion
Collection of explosive particles using a vacuum-impaction device
This work aims to develop a method that uses micro-Raman spectroscopy in combination with a DART mass spectral ap-proach for the analysis of swab and wipe samples collected for the screening of explosives. The investigated samples are listed in Table1. Our workflow of sample preparation inten-tionally excluded the time-consuming steps that would nor-mally be required for either lixiviation of the analytes from the wipes and swabs or solid-phase extraction to separate the compounds from the matrix components prior to LC–MS analysis. Rather, we chose to use a vacuum impactor (Fig.1) to collect micrometric explosive particles from the surface of the swab and wipe samples on an impaction plate made of carbon [10]. The transfer of particles from a wipe or swab sample to the impaction plate lasts only about 10 min. After sample collection, the carbon impaction plate was directly analyzed by micro-Raman spectrometry and then exposed di-rectly to the metastable helium atoms (heated to 350 °C) of the DART ionization source coupled to an LTQ Orbitrap mass spectrometer. This study builds upon a small number of pre-vious investigations that have demonstrated the potential of DART-MS for the analysis of reference explosive compounds
a
b
c
Fig. 1 a Setup of the vacuum impactor. b Sampling using a vacuum impactor on the surface of a swipe sample. c After using the vacuum impactor, the carbon disk contains a ring rich in particles collected from the swipe
spiked in various matrices [2,3,11]. Moreover, we recently showed that DART hyphenated to an Orbitrap mass analyzer permitted the direct and rapid characterization of synthetic and natural homopolymers whose molecular weights fall between 200 and 4000 Da [12]. The approach provided useful infor-mation concerning polymer compositions such as molecular weight distributions, the nature of terminal functionalities, and oligomeric sequences.
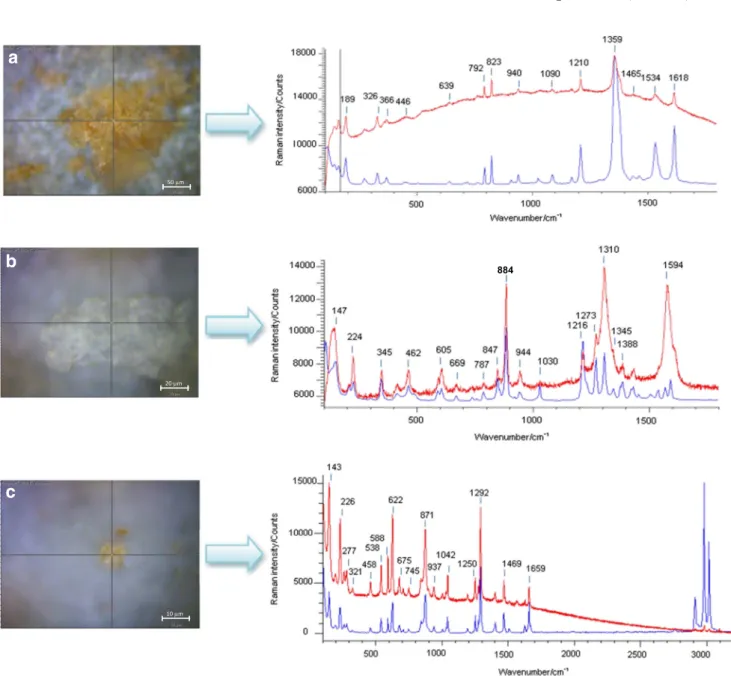
Raman analysis of explosives on vacuum impactor Raman spectroscopy provides a unique molecular spectral fingerprint, with each spectrum containing key signature bands that can be used for identification. All Raman spectra were acquired in the range 100–3200 cm−1to enable
observa-tion of most Raman bands for common explosives [5–7]. Raman microscopy was applied to focus the laser beam on micrometric targets and collect the Raman scattering from the explosive crystals collected by vacuum impactor directly onto a carbon disk. The NIR laser at 785 nm gave good-quality spectra of explosives, with limited background fluorescence.
Figure2adisplays the Raman microscopy image of a cluster of energetic crystals collected from the surface of sample 3 (wipe of a submunition). Crystal sizes are typically between 10 and 50μm. The wavenumbers and relative intensities of peaks observed in the acquired Raman spectrum, represented in red, match well with those of the reference Raman spectrum of trinitrotoluene (TNT) from the Renishaw library (overlaid in blue). The observed peaks can be attributed to the vibrational modes of TNT [4,5,7,13,14], including characteristic sym-metric NO2stretching vibrations at approximately 1360 cm−1
and the asymmetric NO2stretching vibrations at 1534 and
1618 cm−1. The shoulder at 1380 cm−1may be assigned to the–CH3symmetric bend, and its presence sets TNT apart
from most of the explosives belonging to the nitro aromatic group. The other peaks can be assigned to the NO2scissoring
modes (790, 820 cm−1), to the –CH(ring) bending modes (800–1100 cm−1), and to the ring-breathing mode (1210 cm−1).
Figure2bdisplays in red the Raman microscopy image of a crystal collected from the surface of sample 4 (wipe of a sub-munition). The experimental Raman spectrum obtained from the particle is dominated by a band at 884 cm−1which can be attributed to the symmetric C–N–C ring breathing mode, as well as the band at 944 cm−1which can be assigned to the ring stretching mode and to the N–O deformation; the band at 1278 cm−1can be attributed to CH2scissoring and the
char-acteristic N–N stretch vibration [15]; the band at 1310 cm−1 results from–CH2wagging; the band at 1388 is likely the
υNO2 symmetric stretching vibration and βCH2scissoring;
finally, the band at 1594 cm−1is attributed to theυNO2 asym-metric stretch in nitro amines [15,16]. The reference Raman spectrum of RDX, obtained from the Renishaw library, is overlaid in blue (Fig.2b). It is worth noting that the broad
peaks observed in the experimental spectrum at 1310 and 1594 cm−1are due to the contribution of the vibrations of the graphite (carbon) support.
Figure2cdisplays the Raman microscopy image of a crys-tal collected from the surface of sample 10 (wipe of a grenade). The experimental Raman spectrum (red trace) is characterized by Raman lines matching well with literature data [7,17–19] and can be attributed to the vibrational modes of PETN. Indeed, the band observed at 622 cm−1is due to the rocking vibration mode of–ONO2groups; the band at 871 cm−1results
from the O–N stretching mode, the band at 1042 cm−1from
the CH2torsion and the bending of the C–C bond, and finally
the bands at 1292 and 1469 cm−1result from the symmetric and asymmetric stretching of NO2, respectively.
DART-HRMS analysis in negative mode
This investigation seeks to develop and apply negative ion mode DART-HRMS methods for the direct analysis of swabs and/or wipes holding explosives. To enable direct DART-HRMS analyses of explosive materials aspirated from swabs or wipes, the carbon impaction plate containing the transferred explosive particles was placed between the DART ion source outlet and the entrance of the LTQ-Orbitrap mass spectrome-ter. The DART parameters were optimized for each of the nitro-based explosives. We found that the optimal gas stream temperature was 350 °C for most explosives. A priori, we anticipated that the explosives bearing sufficiently acidic pro-tons would yield abundant deprotonated molecules [M–H]−,
whereas those products bearing very weakly acidic protons would be capable of forming anionic adducts, especially if chloride anions were made available, i.e., [M + Cl]−[20]. To promote the formation of chloride adducts, chloroform vapor was added directly to the ionizing region, using a simple ex-perimental setup where helium was gently bubbled into chlo-roform (ESM Fig. S2).
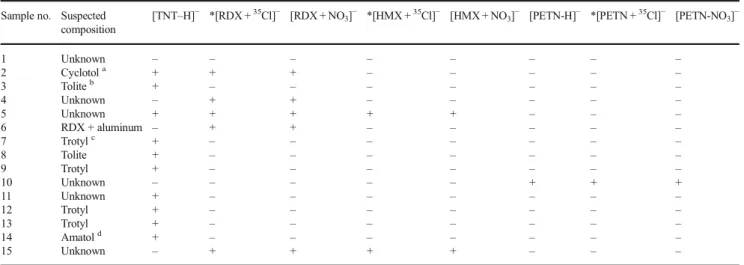
Table2summarizes theBsuspected^ composition of some of the samples as well as the results corresponding to the screening of the wipe and swab samples. Among the 15 sam-ples analyzed in this work, four explosives were detected, namely TNT, RDX, HMX, and PETN. For the nitramines RDX and HMX, deprotonated molecules were never detected. We attribute this to the very low acidity of the hydrogens (all equivalent on each of these symmetric molecules). The addi-tion of chloroform to the DART reagent gas allowed the facile generation of chloride adducts for HMX and RDX, as well as for the nitrate ester pentrite (PETN). The ionization efficien-cies for these speefficien-cies are thus augmented substantially relative to the case where no chloroform is present. However, the presence of chloroform in the source did not result in the production of abundant chloride adducts for TNT. Rather, TNT was detected as deprotonated molecules, (M− H)−, which can be rationalized on the basis of both an increased
acidity of available hydrogens, and a lower stability of chlo-ride adducts of the neutral molecule.
Figure3shows representative negative ion mass spectra of samples 5 (submunition, Fig.3a), 9 (rocket, Fig.3b), 10 (gre-nade, Fig.3c), and 15 (bounding mine, Fig.3d). In Fig.3a and b, the [M–H]−peak is readily observed at m/z 226.0106 for TNT, whereas in Fig.3a and d, the chloride adduct anions of hexogen [RDX +35Cl]−and octogen [HMX +35Cl]−are ob-served at m/z 257.0043 and m/z 331.0159 along with their respective nitrate adduct anions [M + NO3]−at m/z 284.0233
and m/z 358.0350. All peak identifications are consistent with reference mass spectra obtained from pure standards. Deprotonated molecules were not detected for HMX, RDX, or PETN. Neither the nitramines nor the nitrate ester can read-ily transfer a proton to the strong reagent O2·−present in the
DART plasma which has been postulated to become proton-ated to form · O2H, a species having a low gas-phase acidity
[21]. However, adding chloroform as dopant to the heated helium gas produced abundant Cl− ions that readily formed anionic adducts with HMX, RDX, and PETN. The ability to
a
b
c
Fig. 2 Raman microscopy image of energetic particles collected from the surface of a sample 3, b sample 4, and c sample 10 by vacuum impactor with their respective Raman spectrum in red. Raman conditions: 785 nm,
10 s exposure time, 5 accumulations. The reference Raman spectrum from the Renishaw library is overlaid is each case (blue line). See ESM Fig. S1for the Raman spectrum of a blank reference carbon stub
observe highly abundant chloride adducts has been linked to an exceptional stability of these species in the gas phase [22]. Further DART-MS screening revealed that the three inves-tigated submunition weapons (samples 3–5) did not contain the same explosives. For example, only TNT was detected in sample 3, whereas sample 4 revealed only RDX (Table2). Other samples, however, contained mixtures of energetic
nitro-based charges. For example, analysis of sample 5 by DART-MS revealed a mixture of HMX, RDX, and TNT, as deduced from the detection of [TNT–H]−at m/z 226 and the RDX adducts [RDX +35Cl]−and [RDX + NO3]−anions at m/
z 257 and 284, respectively. In the case of the rocket weapons, only sample 6 contained RDX, whereas TNT was detected in samples 7–9. No differences were found in mortar weapons
Table 2 Negative ionization screening in swabs from real samples analyzed by DART-LTQ/Orbitrap
Sample no. Suspected composition
[TNT–H]− *[RDX +35Cl]− [RDX + NO3]− *[HMX +35Cl]− [HMX + NO3]− [PETN-H]− *[PETN +35Cl]− [PETN-NO3]−
1 Unknown – – – – – – – – 2 Cyclotola + + + – – – – – 3 Toliteb + – – – – – – – 4 Unknown – + + – – – – – 5 Unknown + + + + + – – – 6 RDX + aluminum – + + – – – – – 7 Trotylc + – – – – – – – 8 Tolite + – – – – – – – 9 Trotyl + – – – – – – – 10 Unknown – – – – – + + + 11 Unknown + – – – – – – – 12 Trotyl + – – – – – – – 13 Trotyl + – – – – – – – 14 Amatold + – – – – – – – 15 Unknown – + + + + – – –
B+^considered ion was detected in the mass spectrum, B–^ the ion was absent
aMixture of RDX and TNT b TNT-based weapon c TNT-based weapon d
Military explosive containing TNT and ammonium nitrate *37Cl adduct was observed for all adduct containing35Cl
NL: 9.2 E5
NL: 3.5 E6
NL: 9.4 E5
NL: 1.6 E6
(samples 11–14) where only TNT was detected, and its struc-ture is confirmed by the presence of the fragment ion m/z 196 formed under CID by loss of CH2O [23]. On the other hand,
sample 2 (dispersed explosive) contained a mixture of RDX and TNT, which can be attributed to the presence of BComposition B^ [24], a mixture that is commonly used as explosive filling in mines. By comparison, the analysis of the bounding mine sample (no. 15) also revealed a mixture con-taining RDX, but this time the other main component was HMX. The analysis of the grenade swab (sample 10) revealed uniquely pentaerythritol tetranitrate (PETN), detected in three different forms: m/z 315.0064 [PETN–H]−, m/z 351.9830 [PETN +35Cl]−, and m/z 378.0019 [PETN + NO3]−. All
sam-ples containing TNT displayed an abundant ion at m/z 197, whose signal intensity varied among the samples. The inter-pretation of this unassigned ion is discussed in theESM.
All weapon samples were swiped several times, and each swipe was analyzed at least three times (three replicates) in different areas of the swipes. Although the relative intensity of
the analytes detected in each replicate varied within a range of ±30 %, each replicate analysis revealed the same composition. DART-HRMS analysis in positive mode
The analysis of explosives in the positive ion mode provides additional and valuable information for the characterization of explosives that complements that obtained in the negative ion mode. The latter is often used to ionize nitroaromatic-based explosives; however, analysis in positive ion mode can reveal the binder polymers used in manufacturing. These polymers are added toBphlegmatize^ the main charge, i.e., they stabilize or desensitize the explosive. Other informative compounds can also be detected in positive ion mode, such as nonexplo-sive organic compounds, degradation products, plasticizers, and tagging agents.
Various polymers are commonly used as explosive fillers as well as plasticizers and binders in energetic materials. The use of these compounds in explosive formulations is mainly for
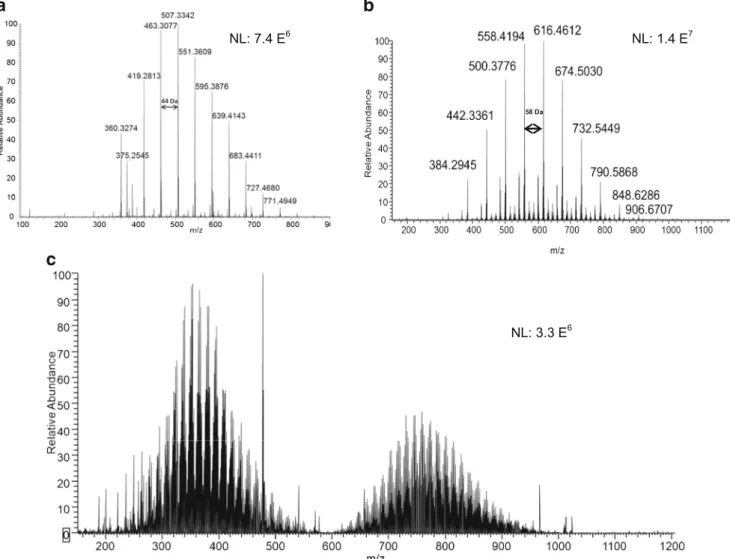
a
b
c
Fig. 4 Mass spectra of the screening in positive ion mode by using DART-MS: a PEG polymer in rocket sample 8, b PPG polymer in grenade sample 10, c unknown (wax-like) compounds found in bounding mine sample 15
desensitization purposes; however, with the development of more insensitive explosive fillers, the function of the polymer binder is shifting from that of a desensitizer to that of providing structural integrity [25]. Intact synthetic polymers are widely analyzed by matrix-assisted laser desorption/ionization mass spectrometry (MALDI-MS) [26,27], but this method is limited by the sensitivity when trace analysis is required. ESI-MS is another useful technique for the analysis of polymers, and it has the advantage that it can be easily interfaced with liquid sepa-ration methods (e.g., HPLC, CE). Some disadvantages of ESI are the tendency for signal suppression of less surface-active species when mixtures or co-eluting species are present, and the strict solvent requirements [28]. Alternatively, direct analysis of polymers using ambient ionization techniques has become use-ful [29], providing analysis methods which are fast and without special sample preparation requirements. In this way, DESI-MS was used for polymer analysis and showed good performance for the analysis of industrial synthetic polymers [30–32]; how-ever, like ESI, DESI provides multiply charged species whose presence may complicate the mass spectral profile. Another direct sampling technique, DART-MS, provides only singly charged species, and when coupled to high-resolution
instruments, represents a powerful tool for the analysis of poly-mers [12]. Thus, DART-MS has been demonstrated to be fast and nondestructive [33], and has utility for the analysis of syn-thetic and natural polymers [12].
In the current study, the analysis of explosive samples col-lected on an impaction plate using DART-MS produced only singly charged species. For most samples, the analysis of swabs showed the presence of polymers. Specifically, samples 3–9 and 11–14 all showed a low molecular weight polymer distri-bution, which was separated by a 44-Da repeat unit which we assign as ethylene oxide (−OCH2CH2–) characteristic of
poly-ethylene glycol (PEG) polymer, as exemplified in Fig.4a. This mass spectrum showed singly protonated [M + H]+molecules and singly charged ammonium adducts [M + NH4]+.
Ammonium adducts likely arise from ammonium salts present in the samples, or present in residual amounts on the surface of the ionization source, because no ammonium compounds were added to the heated helium stream. Figure4bdisplays the mass spectrum of sample 10 (grenade) showing singly charged spe-cies [M + NH4]+and [M + H]+. The spectrum shows a series of
ions separated by 58 m/z units, which we assign to the propyl-ene oxide (PO) repeat unit (−OCH2CH2CH2–) corresponding
a
b
c
d
Fig. 5 Mass spectra of samples acquired in positive mode using DART-LTQ/Orbitrap: a plasticizers from sample 1 (mine); b–d plasticizers from sample 14 (mortar)
to polypropylene (or isopropylene) glycols (PPG). Unlike the other samples analyzed, sample 15 shows a very complex mass spectrum displayed in Fig.4c. Although DART-MS produces only singly charged species, the polymeric sample contains variable repeat units, and the number of possible combinations leads to a complex interpretation of the mass spectrum. Furthermore, the small quantity of sample did not allow us to perform additional experiments (e.g., MS/MS, FTIR, etc.), which can provide complementary information for structural elucidation and identification.
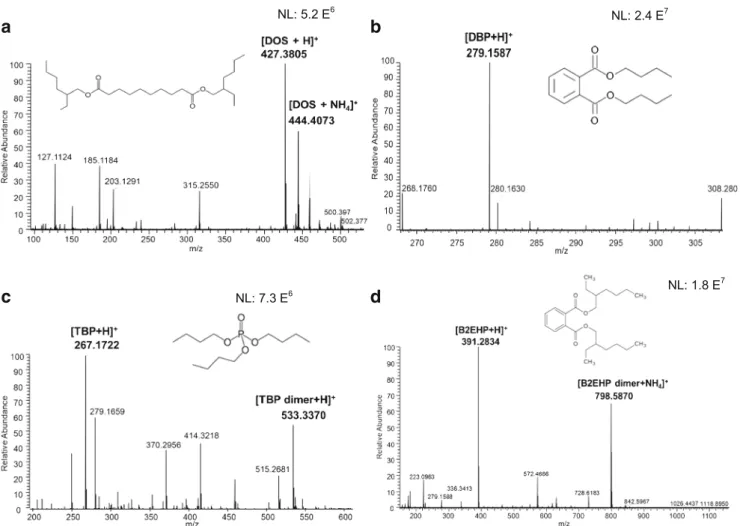
On the other hand, sample 1 (mine) did not show any poly-mer constituents. However, a plasticizer was detected at m/z 427 corresponding to protonated [M + H]+diisooctyl sebacate (DOS) and its ammonium adduct [M + NH4]+was observed at
m/z 444 (Fig.5a). Other plasticizers were observed, such as tributyl phosphate (at m/z 267, corresponding to the protonat-ed molecule and m/z 533, resulting from the dimerization of TBP, Fig.5b); dibutyl phthalate ([M + H]+ observed at m/z 279, Fig.5c); and bis(2-ethylhexyl)phthalate ([M + H]+ at 391, Fig.5d). Plasticizers are critical components in explosive formulations. These compounds are used in explosive formu-lations to alter the mechanical characteristics of the polymer binders by increasing the flexibility of the polymer chain. In addition to improving the mechanical properties, plasticizers also tend to reduce the mix viscosity to improve processing, modify the oxygen balance, and modify the burn rate charac-teristics of the energetic material composite [26].
Conclusion
We have demonstrated a novel approach to collect and charac-terize explosive particles from real military explosives sampled by wiping surfaces with cotton swabs and wipes. This approach relies on the use of a vacuum impactor for the transfer of micrometer-size explosive particles from the wipes to an impac-tion plate made of carbon. The particles deposited on the carbon plate are then characterized using Raman microscopy followed by DART mass spectrometry, thereby providing spectral finger-prints that are orthogonal in nature. Indeed, Raman microscopy provides an efficient way to screen for the detection and identi-fication of the explosive charge on the impaction plate. Further, we showed that the resolving power (60,000 FWHM at m/z 400) and mass accuracy (<2 ppm) of DART-MS used in both positive and negative ionization modes allowed the global characteriza-tion of plastic and nonplastic explosive formulacharacteriza-tions at trace levels. In fact, the natures of the explosive charges (TNT, RDX, HMX, and PETN) were identified as either deprotonated species or as nitrate or chloride adduct anions in negative mode. Switching to a positive mode of ionization revealed the presence of polymer binders, plasticizers, and other additives identified either as protonated or ammonium adduct species. In our labo-ratory, the DART/Orbitrap method produced LODs in the
picogram range for TNT, PETN, and Tetryl and nanogram range for HMX, PETN, and Tetryl directly analyzed on the swabs and swipes (data not shown), confirming that DART/MS is a method that can be used for detection and confirmation of trace amounts of explosives. Although no detection limit was calculated in this study for the micro-Raman method, recent studies reported using Klarite® substrates to collect surface-enhanced Raman scattering (SERS) spectra of explosives (i.e., TNT) down to 200 pg, quan-tities suitable for detection of explosives at the trace level [7].
These results clearly demonstrate the capability of Raman mi-croscopy combined with DART-MS as a tool for the fast screen-ing, comprehensive characterization, and differentiation of partic-ulate explosive samples for forensic sciences and homeland secu-rity applications. Future work will focus on analyzing the same types of explosive residues on samples collected post blast.
Acknowledgment The authors would like to thank the commissariat à l’énergie atomique et aux énergies alternatives (CEA) and University Pierre and Marie Curie (UPMC) for the financial support of this project. Compliance with ethical standards
Conflict of interest The authors declare that they have no conflict of interest.
Open Access This article is distributed under the terms of the Creative C o m m o n s A t t r i b u t i o n 4 . 0 I n t e r n a t i o n a l L i c e n s e ( h t t p : / / creativecommons.org/licenses/by/4.0/), which permits unrestricted use, distribution, and reproduction in any medium, provided you give appropriate credit to the original author(s) and the source, provide a link to the Creative Commons license, and indicate if changes were made.
References
1. Mahoney CM, Fahey AJ, Steffens KL, Benner BA, Lareau RT. Characterization of composition C4explosives using
time-of-flight secondary ion mass spectrometry and X-ray photoelectron spectroscopy. Anal Chem. 2010;82:7237–48.
2. Nilles JM, Connell TR, Stokes ST, Dupont H. Explosives detection using direct analysis in real time (DART) mass spectrometry. Propellants Explos Pyrotech. 2010;35:446–61.
3. Sisco E, Dake J, Bridge C. Screening for trace explosives by AccuTOF™-DART®: an in-depth validation study. Forensic Sci Int. 2013;232:160–8.
4. Botti S, Cantarini L, Palucci A. Surface-enhanced Raman spectros-copy for trace-level detection of explosives. J Raman Spectrosc. 2010;41:866–86.
5. Ali EMA, Edwards HGM, Scowen IJ. Detection of explosives on human nail using confocal Raman microscopy. J Raman Spectrosc. 2009;40:2009–14.
6. Hatab NA, Eres G, Hatzinger PB, Gu B. Detection and analysis of cyclotrimethylenetrinitramine (RDX) in environmental samples by surface-enhanced Raman spectroscopy. J Raman Spectrosc. 2010;41:1131–36.
7. Botti S, Almaviva S, Cantarini L, Palucci A, Puiu A, Rufoloni A. Trace level detection and identification of nitro-based explosives by surface-enhanced Raman spectroscopy. J Raman Spectrosc. 2013;44:463–68.
8. Edward HGM, Stern B, Villar SEJ, David AR. Combined FT– Raman spectroscopic and mass spectrometric study of ancient Egyptian sarcophagal fragments. Anal Bioanal Chem. 2007;387: 829–36.
9. Fagerer SR, Schmid T, Ibanez AJ, Pabst M, Steinhoff R, Jefimovs K, et al. Analysis of single algal cells by combining mass spectrom-etry with Raman and fluorescence mapping. Analyst. 2013;138: 6732–6.
10. Esaka KT, Esaka F, Inagawa J, Iguchi K, Lee CG, Sakurai S, et al. Application of fission track technique for the analysis of individual particles containing uranium in safeguard swipe samples. Jap J Appl Phys. 2004;43:L915–6.
11. Swider JR. Optimizing Accu time-of-flight/direct analysis in real time for explosive residue analysis. J Forensic Sci. 2013;58:1601–06. 12. Bridoux MC, Machuron-Mandard X. Capabilities and limitations
of direct analysis in real time orbitrap mass spectrometry and tan-dem mass spectrometry for the analysis of synthetic and natural polymers. Rapid Commun Mass Spectrom. 2013;27:2057–70. 13. Clarke RH, Londhe S, Premasiri WR, Womble ME. Low-resolution
Raman spectroscopy: instrumentation and applications in chemical analysis. J Raman Spectrosc. 1999;30:827–32.
14. Lewis MR, Lewis IR, Griffiths PR. Evaluation of a dispersive Raman spectrometer with a Ge array detector and a 1064 nm laser for the study of explosives. Vib Spectrosc. 2005;38:11–8. 15. Karpowicz RJ, Brill TB. Comparison of the molecular structure of
hexahydro-1,3,5-trinitro-s-triazine in the vapor, solution and solid phases. J Phys Chem. 1984;88:348–52.
16. Torres P, Mercado L, Cottes I, Hernandez SP, Min N, Santana A, et al. Vibrational spectroscopy study ofβ and α RDX deposits. J Phys Chem B. 2004;108:8799–805.
17. Lewis IR, Daniel Jr NW, Griffiths PR. Interpretation of Raman spectra of nitro-containing explosive materials. Part I: group fre-quency and structural class membership. Appl Spectrosc. 1997;51:1854–67.
18. Daniel Jr NW, Lewis IR, Griffith PR. Interpretation of Raman spec-tra of nitro-containing explosive materials. Part II: the implementa-tion of neural, fuzzy, and statistical models for unsupervised pattern recognition. Appl Spectrosc. 1997;51:1868–79.
19. Gruzdkov YA, Gupta YM. Vibrational properties and structure of pentaerythritol tetranitrate. J Phys Chem A. 2001;105:6197–202. 20. Vigneau O, Machuron-Mandard X. A LC–MS method allowing the
analysis of HMX and RDX present at the picogram level in natural aqueous samples without a concentration step. Talanta. 2009;77: 1609–13.
21. Song L, Dykstra AB, Yao H, Bartmess JE. Ionization mechanism of negative ion-direct analysis in real time: a comparative study with negative ion-atmospheric pressure photoionization. J Am Soc Mass Spectrom. 2009;20:42–50.
22. Cai Y, Cole RB. Stabilization of anionic adducts in negative ion electrospray mass spectrometry. Anal Chem. 2002;74: 985–91.
23. Hubert C, Schwarzenberg A, Dossmann H, Cole RB, Machuron-Mandard X, Tabet J-C. Clarification of the 30 Da releases from the [M-H]−and M−•ions of trinitrotoluene by electrospray high reso-lution mass spectrometry. J Mass Spectrom. 2014;49:327–30. 24. Agarwal JP. High energy materials: propellants, explosives and
pyrotechnics. Wiley-VCH: Weinheim; 2010.
25. Ang HG, Pisharath S. Energetic polymers. Binders and plasticizers for enhancing performance. Wiley-VCH: Weinheim; 2010. 26. Hanton SD. Mass spectrometry of polymers and polymer surfaces.
Chem Rev. 2001;101:527–69.
27. Li X, Guo L, Casiano-Maldonado M, Zhang D, Wesdemiotis C. Top-down multidimensional mass spectrometry methods for syn-thetic polymer analysis. Macromolecules. 2011;44:4555–64. 28. Peacock PM, McEwen CN. Mass spectrometry of synthetic
poly-mers. Anal Chem. 2006;78:3957–64.
29. Klampfl CW. Mass spectrometry as a useful tool for the analysis of stabilizers in polymer materials. TrAC Trend Anal Chem. 2013;50: 53–64.
30. Nefliu M, Venter A, Cooks RG. Desorption electrospray ionization and electrosonic spray ionization for solid- and solution-phase anal-ysis of industrial polymers. Chem Commun. 2006;8:888–90. 31. Williams JP, Hilton GR, Thalassinos K, Jackson AT, Scrivens JH.
The rapid characterisation of poly(ethylene glycol) oligomers using desorption electrospray ionisation tandem mass spectrometry com-bined with novel product ion peak assignment software. Rapid Commun Mass Spectrom. 2007;21:1693–704.
32. Friia M, Legros V, Tortajada J, Buchmann W. Desorption electrospray ionization - orbitrap mass spectrometry of synthetic polymers and copolymers. J Mass Spectrom. 2012;47:1023–33. 33. Rothenbacher T, Schwack W. Rapid and nondestructive analysis of
phthalic acid esters in toys made of poly(vinyl chloride) by direct analysis in real time single-quadrupole massspectrometry. Rapid Commun Mass Spectrom. 2009;23:2829–35.
Maxime Bridoux is a research scientist at the Commissariat à l’Energie Atomique et aux énergies alternatives (CEA). He received his PhD in 2008 from the State University of New York at Albany in the field of environ-mental and analytical chemistry and completed his postdoctoral training from 2008 to 2012 at the S c h o o l o f O c e a n o g r a p h y, University of Washington (UW). His personal research interests are the analytical aspects (chromatog-raphy and mass spectrometry) re-lated to the detection of trace amounts of organic compounds for forensic and environmental applications.
Adrián Schwarzenberg is an R&D scientist of the Plant Nutrition unit at the Centre Mondial d’Innovation (CMI) in Saint-Malo, France. His PhD the-sis at the Pierre and Marie Curie University (UPMC) focused on t h e d e v e l o p m e n t o f h i g h -resolution mass spectrometry-based methods for the characteri-zation and accurate identification of organophosphorus compounds and explosives.
Sébastien Schramm is a post-d o c t o r a l r e s e a r c h e r a t t h e C o m m i s s a r i a t à l ' E n e r g i e Atomique et aux énergies alterna-tives (CEA). During his postdoc-toral research, he developed mass spectrometry-based methods (Orbitrap, LC-QQQ, FTICRMS, qToF) for the identification and the quantification of small organic molecules for forensics and envi-ronmental applications.
Richard B. Cole is a professor at Sorbonne Universities, UPMC Univ. of Paris 6. He has worked as a researcher in the field of mass spectrometry since 1983. His ac-tivities include pioneering the de-velopment of anion attachment mass spectrometry, investigations into what determines charge state distributions in electrospray ioni-zation mass spectrometry, charac-terization of the electrochemistry inherent to ESI, and development of novel matrixes for MALDI. He has edited two major books in the MS field concerning fundamentals and applications of ESI, and of MALDI.