HAL Id: hal-02413226
https://hal.sorbonne-universite.fr/hal-02413226
Submitted on 16 Dec 2019
HAL is a multi-disciplinary open access
archive for the deposit and dissemination of
sci-entific research documents, whether they are
pub-lished or not. The documents may come from
teaching and research institutions in France or
abroad, or from public or private research centers.
L’archive ouverte pluridisciplinaire HAL, est
destinée au dépôt et à la diffusion de documents
scientifiques de niveau recherche, publiés ou non,
émanant des établissements d’enseignement et de
recherche français ou étrangers, des laboratoires
publics ou privés.
Regulatory T Cell Activation and Stability
Emilie Ronin, Martina Lubrano Di Ricco, Romain Vallion, Jordane Divoux,
Ho-Keun Kwon, Sylvie Grégoire, Davi Collares, Angéline Rouers, Véronique
Baud, Christophe Benoist, et al.
To cite this version:
Emilie Ronin, Martina Lubrano Di Ricco, Romain Vallion, Jordane Divoux, Ho-Keun Kwon, et al..
The NF-κB RelA Transcription Factor Is Critical for Regulatory T Cell Activation and Stability.
Frontiers in Immunology, Frontiers, 2019, 10, pp.2487. �10.3389/fimmu.2019.02487�. �hal-02413226�
doi: 10.3389/fimmu.2019.02487
Edited by: Margarita Dominguez-Villar, Imperial College London, United Kingdom Reviewed by: Xin Chen, University of Macau, China Vasileios Bekiaris, Technical University of Denmark, Denmark *Correspondence: Benoit L. Salomon benoit.salomon@inserm.fr Specialty section: This article was submitted to T Cell Biology, a section of the journal Frontiers in Immunology Received: 16 June 2019 Accepted: 04 October 2019 Published: 30 October 2019 Citation: Ronin E, Lubrano di Ricco M, Vallion R, Divoux J, Kwon H-K, Grégoire S, Collares D, Rouers A, Baud V, Benoist C and Salomon BL (2019) The NF-κB RelA Transcription Factor Is Critical for Regulatory T Cell Activation and Stability. Front. Immunol. 10:2487. doi: 10.3389/fimmu.2019.02487
The NF-κB RelA Transcription Factor
Is Critical for Regulatory T Cell
Activation and Stability
Emilie Ronin1, Martina Lubrano di Ricco1, Romain Vallion1, Jordane Divoux1,
Ho-Keun Kwon2, Sylvie Grégoire1, Davi Collares3, Angéline Rouers1, Véronique Baud3,
Christophe Benoist2and Benoit L. Salomon1*
1Sorbonne Université, INSERM, CNRS, Centre d’Immunologie et des Maladies Infectieuses (CIMI-Paris), Paris, France, 2Division of Immunology, Department of Microbiology and Immunobiology, Harvard Medical School, Boston, MA,
United States,3Laboratoire NF-κB, Differentiation and Cancer, Université Paris Descartes, Sorbonne Paris Cité, Paris, France
Regulatory T cells (Tregs) play a major role in immune homeostasis and in the prevention of autoimmune diseases. It has been shown that c-Rel is critical in Treg thymic differentiation, but little is known on the role of NF-κB on mature Treg biology. We thus generated mice with a specific knockout of RelA, a key member of NF-κB, in Tregs. These mice developed a severe autoimmune syndrome with multi-organ immune infiltration and high activation of lymphoid and myeloid cells. Phenotypic and transcriptomic analyses showed that RelA is critical in the acquisition of the effector Treg state independently of surrounding inflammatory environment. Unexpectedly, RelA-deficient Tregs also displayed reduced stability and cells that had lost Foxp3 produced inflammatory cytokines. Overall, we show that RelA is critical for Treg biology as it promotes both the generation of their effector phenotype and the maintenance of their identity.
Keywords: regulatory T cells, NF-κB, autoimmunity, stability, activation, relA
INTRODUCTION
CD4+
CD25+
Foxp3+
regulatory T cells (Tregs) play a critical role in immune homeostasis and in the prevention of autoimmune diseases by regulating immune responses (1). In humans and mice, it is well established that forkhead box protein 3 (Foxp3) deficiency conducts to the development of an autoimmune syndrome leading to early death. Although Foxp3 plays a critical role in the differentiation, suppressive function and stability of Tregs, other transcription factors (TFs), some of which interacting with Foxp3 in multi-molecular complexes, are also involved in different aspects of their biology. Some, such as c-Rel, are involved in Treg differentiation (2,3). Others, such as NFAT, RunX1, BACH2, or Eos are critical to maintain their suppressive activity (4–7). Another group of TFs, including Blimp1, Myb, STAT3, Tbet, IRF4, Bcl6, or PPARg are involved in further differentiation of activated Tregs and in their capacity to suppress different types of immune responses (8–14). Finally, STAT5, TET, GATA3, p300/CBP, Blimp1, or Ezh2 have been shown to maintain Treg identity and stability by controlling Foxp3 transcription and epigenetics (15–20). Although it has been reported that NF-κB is able to bind to the regulatory sequence of Foxp3 and to interact with a complex containing Foxp3 (2,3,21), its role in Treg biology needs to be further analyzed.
The NF-κB TFs consist of homo or heterodimeric molecules of NF-κB1 (p105/50), RelA (p65) and c-Rel subunits for the canonical pathway and of NF-κB2 (p100/52) and RelB subunits for the
non-canonical pathway. It has been reported that c-Rel is essential for thymic Treg development by binding to the promoter sequence and the conserved non-coding sequence (CNS) 3 of Foxp3 (2,3,22). The role of NF-κB in mature Treg biology has been addressed by knocking-out upstream activators of the pathway, such as IKKα and IKKß kinases. Mice with a conditional knockout (KO) in Tregs of either Ubc13, an E2 ubiquitin ligase activating IKKβ, or of IKKβ itself, develop a spontaneous autoimmune syndrome, associated with conversion of Tregs into effector-like T cells without Foxp3 loss or reduced Treg survival, respectively (23,24). Mice with a conditional KO of IKKα in CD4+ T cells have a decreased proportion of Tregs in lymphoid organs, which seem to have a defective suppression and proliferation capacities in vivo (25). The specific role of RelA in Tregs, which is considered as the main factor of NF-κB members in conventional T cells (26), has been recently studied. By interacting with RelA and other TFs, such as Helios and p300, Foxp3 forms a multimolecular complex localized in active nuclear areas to act primary as a transcriptional activator (27). Mice with a conditional KO of RelA in Tregs develop a severe and early spontaneous autoimmune syndrome that is associated with a defect of effector Tregs (28–30). Here, we confirmed these latter findings and added further information on the nature of the disease with extensive description of lymphoid and myeloid cell activation in lymphoid and non-lymphoid tissues. Importantly, we revealed that RelA-deficient Tregs were unstable, lost Foxp3 expression and produced inflammatory cytokines, highlighting that RelA is also critical to maintain Treg stability and identity.
RESULTS
Conditional Ablation of RelA in Tregs Leads
to the Development of a Spontaneous
Autoimmune Syndrome
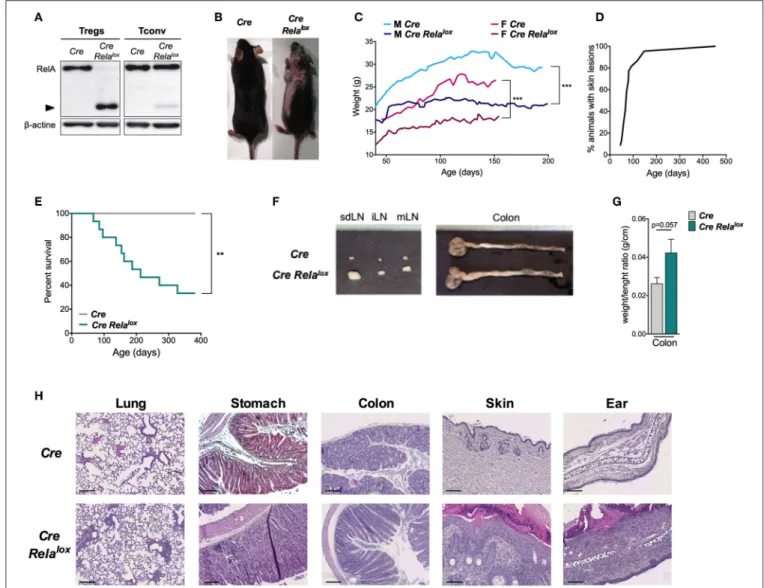
To assess the role of RelA in Treg biology, we generated Foxp3Cre Relalox mice that have a specific deletion of RelA in Tregs by crossing mice expressing CRE in Tregs with mice expressing a Rela floxed allele. In these Foxp3Cre Relalox mice, Tregs
expressed a non-functional truncated form of RelA (Figure 1A), as expected using this floxed allele (31). From 5 to 10 weeks of age, Foxp3Cre Relalox mice developed a spontaneous disease characterized by localized alopecia and skin lesions (epidermal hyperplasia, hyperparakeratosis, cystic hair), and reduced weight gain compared to Foxp3Cre control mice (Figures 1B,C). This
pathology had high penetrance and was severe since most of the animals had to be sacrificed for ethical reasons by 45 weeks of age (Figures 1D,E). At 10–12 weeks of age, Foxp3Cre Relalox mice exhibited adenomegaly and macroscopic signs of mild colon inflammation (Figures 1F,G). Histological analyses showed moderate immune cell infiltration in the lung, stomach and colon and high level of immune cell infiltration in the skin (Figure 1H). The liver and small intestine were not or minimally infiltrated. Thus, mice with RelA-deficient Tregs developed a severe and systemic inflammatory syndrome.
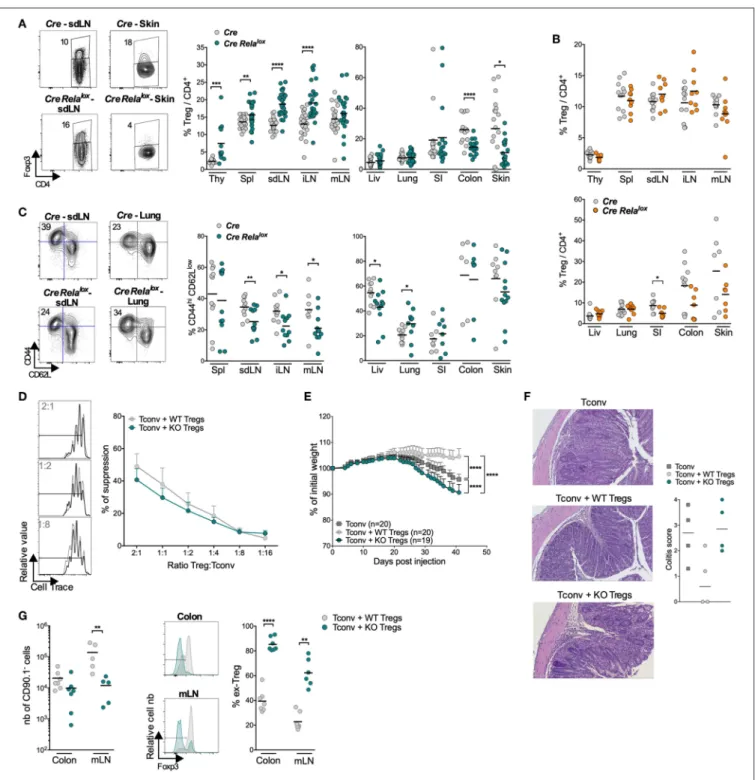
We started the characterization of this syndrome by analyzing the lymphocyte compartment of 10–12 week-old Foxp3CreRelalox
the skin draining lymph nodes (sdLN), the internal LN (iLN, corresponding to pancreatic and paraaortic LN) and the inflamed non-lymphoid tissues (lung and skin) but not in the spleen, mesenteric LN (mLN) or the non-inflamed non-lymphoid tissues (liver, small intestine) (Figure 2A). This leukocyte expansion was due to increased numbers of CD8+
and CD4+
T cells, B cells (Figure 2B and data not shown) and myeloid cells (see below). Moreover, the proportions of CD44highCD62Llow, ICOS+
, and Ki67+
activated/memory CD8+
and CD4+
conventional T cells were significantly increased in the spleen, sdLN, and lung of Foxp3Cre Relalox mice compared to Foxp3Cre control
mice (Figures 2C,D and Supplementary Figure 1A). The same tendency was observed in the colon and skin, although this was not significant, probably because basal levels of activated cells were already high in Foxp3Cre control mice. Interestingly, an increased proportion of activated/memory T cells was observed in the iLN and mLN as well as in the non-inflamed liver and small intestine, demonstrating a global systemic T cell activation in Foxp3Cre Relalox mice (Supplementary Figure 1B). Systemic inflammation was confirmed by quantifying cytokines in the serum, where we observed highly increased levels of IFNγ, IL-4, IL-10, IL-17, IL-6, and TNFα (Figure 2E). Also, serum levels of IgM, IgG1, IgG2b, IgA, and IgE (Figure 2F) and of anti-DNA autoantibodies (Figure 2G) were increased in 12–14 week-old sick Foxp3CreRelaloxmice compared to Foxp3Crecontrol mice.
The systemic inflammation was further documented by analyzing myeloid cells, characterized as shown in
Supplementary Figure 2A. Their numbers were strongly increased in the spleen and sdLN as well as in the inflamed non-lymphoid tissues, lung and skin, in Foxp3Cre Relalox mice compared to controls (Supplementary Figure 2B). This increase of myeloid cells was due to an increase of neutrophils in all these tissues and of eosinophils and monocytes in the lymphoid organs and the skin (Supplementary Figure 2C). A similar trend was observed in the colon.
Only part of this inflammatory phenotype was observed in 4– 6 week-old Foxp3Cre Relalox mice. Increased numbers of whole CD45+
leukocytes were observed in sdLN and iLN but not yet in the lung and skin (Supplementary Figure 3A). A trend for higher proportion of activated/memory T cells, defined by expression of CD44, CD62L and Ki67, was observed in all analyzed lymphoid and non-lymphoid tissues of young mice (Supplementary Figure 3B). Finally, inflammatory cytokines, natural antibodies and anti-DNA antibodies were not or minimally increased in 4–6 week-old Foxp3CreRelaloxcompared to control mice (Figures 2E–G). In conclusion, Foxp3CreRelalox mice developed a severe systemic autoimmune syndrome, already uncovered at 4–6 weeks of age, followed, 1–3 months later, by massive activation of T cells, immune infiltration of several tissues and high rise of serum inflammatory cytokines, immunoglobulins, and auto-antibodies.
Tregs of Foxp3
CreRela
loxMice Appear to
Be Less Stable
We then analyzed Treg homeostasis in 12 week-old Foxp3Cre
Relalox mice. Strikingly, Treg proportion was significantly
FIGURE 1 | Mice with RelA deficient Tregs develop systemic inflammation. (A) Western blot analysis of RelA expression in Tregs and CD4+conventional T cells
(Tconv) isolated from Foxp3Cre(Cre) and Foxp3CreRelalox(Cre Relalox) mice. (B) Representative pictures of 12 week-old Foxp3Creand Foxp3CreRelaloxmice. (C) Body
weight monitoring of Foxp3Creand Foxp3CreRelaloxmales and females. (D) Percentages of Foxp3CreRelaloxmice with skin lesions. (E) Survival monitoring of Foxp3Cre
Relaloxmice. (F) Representative pictures from 20 mice of the LN and colon of 12 week-old Foxp3Creand Foxp3CreRelaloxmice. (G) Weight/length ratio of colon of 12
week-old Foxp3Creand Foxp3CreRelaloxmice. (H) Representative histology from 12 week-old mice of the lung, stomach, colon, skin, and ear of Foxp3Creand
Foxp3CreRelalox. Scale bars represent 200 µm (lung, Foxp3Crestomach, colon), 150 µm (Foxp3CreRelaloxstomach), and 100 µm (skin, ear). Data are representative
of independent experiments. Bars show the means and error bars represent SEM. For mouse and experiment numbers, see Supplementary Table 1. Statistical significance was determined using a log-rank (Mantel- Cox) test for the mouse survival data. The two-tailed unpaired non-parametric Mann–Whitney U-test was used. **p < 0.01, ***p < 0.001.
lung and small intestine compared to Foxp3Cre control mice
(Figure 3A). Interestingly, in the small intestine, colon and skin of 5 week-old Foxp3Cre Relaloxmice, Treg proportion and number (except in the skin) seemed already decreased, when compared to 12 week-old Foxp3Cre Relalox mice (Figure 3B;
Supplementary Figure 4). The proportion of activated/memory
CD44hiCD62Llow Tregs was decreased in all LN and the liver, and the same tendency was observed in the skin. However, their proportion was unchanged in the spleen, colon and small intestine and even increased in the lung (Figure 3C). Foxp3 and CD25 expressions were unchanged (data not shown).
The severe disease of Foxp3Cre Relalox mice in the absence
of major Treg quantitative defect suggests that Tregs may be dysfunctional. In vitro assays showed that RelA-deficient Tregs, purified from 5 to 6 week-old mice, were able to suppress proliferation of conventional T cells almost as efficiently as control Tregs (Figure 3D). To further analyze their function, we assessed their capacity to suppress colitis induced by effector T cells transferred into lymphopenic mice, measured by weight loss and histology. Surprisingly, not only RelA-deficient Tregs were unable to control colitis but the disease was even more severe compared to mice transferred with effector T cells
FIGURE 2 | High activation of T and B lymphocytes in Foxp3CreRelaloxmice. (A,B) Number of CD45+(A), CD8+, CD4+, and B cells (B) in the indicated organs (spl,
spleen; liv, liver; SI, small intestine) of 12 week-old Foxp3Cre(Cre) and Foxp3CreRelalox(Cre Relalox) mice. (C,D) Representative dot plots and proportion of CD44hi
CD62Llow(C) and Ki67+(D) among CD8+and CD4+Tconv in the indicated organs of 12 week-old Foxp3Creand Foxp3CreRelaloxmice. (E) Cytokine quantification in
the serum of 4–12 week-old Foxp3Cre, and 4–6 week-old and 9–14 week-old Foxp3CreRelaloxmice. (F) Immunoglobulin quantification in the serum of 4–12 week-old
Foxp3Cremice, and 4–6 week-old and 13 week-old Foxp3CreRelaloxmice. (G) Anti-DNA antibody quantification in the serum of 4–15 week-old Foxp3Cremice, and
4–12 week-old and 12–14 week-old Foxp3CreRelaloxmice. Each dot represents a mouse, lines and bars show the means of pooled independent experiments. Error
bars represent SEM. For mouse and experiment numbers, see Supplementary Table 1. The two-tailed unpaired non-parametric Mann–Whitney U-test was used for data not following a normal distribution and the t-test was used for data following a normal distribution. *p < 0.05, **p < 0.01, ***p < 0.001, ****p < 0.0001.
FIGURE 3 | Tregs in Foxp3CreRelaloxmice appear to be less stable. (A) Representative density plot and proportion of Tregs among the CD4+T cells in the indicated
organs (thy, thymus; spl, spleen; liv, liver; SI, small intestine) of 12 week-old Foxp3Cre(Cre) and Foxp3CreRelalox(Cre Relalox) mice. (B) Proportion of Tregs among
CD4+ cells in 5 week-old Foxp3Creand Foxp3CreRelaloxmice. (C) Representative density plots and proportions of CD44hiCD62Llowamong the Tregs of 12 week-old
Foxp3Creand Foxp3CreRelaloxmice. Each dot represents a mouse and lines show the means of pooled independent experiments. (D) In vitro suppressive activity of
Treg cells from Foxp3Cre(WT Tregs) and Foxp3CreRelalox(KO Tregs) 5–6 week-old mice. Representative data at 2:1, 1:2 and 1:8 (left) and different (right) Treg:Tconv
ratios of independent experiments. (E–G) In vivo suppressive activity of Treg cells from Foxp3Cre(WT Tregs, 6 week-old mice) and Foxp3CreRelalox(KO Tregs, 6
week-old mice) mice, determined in a colitis model stopped at 6 weeks for analyses. (E) Percentage of initial body weight pooled from independent experiments. Error bars represent SEM. (F) Representative histology of the colon and colitis scores. (G) Numbers of recovered Tregs (CD90.1−cells), representative histograms and
proportions of ex-Treg in the mLN and colon. Each dot represents a mouse and lines show the means of pooled independent experiments. For mouse and experiment numbers, see Supplementary Table 1. The two-tailed unpaired non-parametric Mann–Whitney U test was used for data not following a normal distribution and the t-test was used for data following a normal distribution. *p < 0.05, **p < 0.01, ***p < 0.001, ****p < 0.0001.
alone (Figures 3E,F). This exacerbated colitis was not associated with increased number of cells from Tconv origin (CD90.1+ cells) or to their lower propensity to differentiate in peripheral Treg (pTregs) (Supplementary Figure 5). Instead, the severe colitis was rather due to the fact that most RelA-deficient Tregs lost Foxp3 expression in the colon and mLN, potentially differentiating in pathogenic effector T cells (Figure 3G). In conclusion, Foxp3Cre Relaloxmice had higher numbers of Tregs in lymphoid tissues (probably due to systemic inflammation) but lower numbers of Tregs in the colon and skin, which could be due to Treg instability and Foxp3 loss.
RelA Deficiency Leads to a Defect of
Effector Tregs at Steady State
Foxp3Cre Relalox mice developed systemic inflammation, which in return impacted on Treg biology. Thus, to assess the intrinsic role of RelA in Tregs at steady state, we generated
Foxp3Cre/wtRelaloxheterozygous females, in which theoretically
half of Tregs expressed RelA and the other half were RelA-deficient because of the localization of Foxp3 locus in the X chromosome. We observed that these mice did not have any sign of disease and inflammation, as first noticed by macroscopic observations and the absence of cell infiltration in tissues (Figures 4A,B), which was most likely due to the presence of functional RelA-sufficient Tregs. This was further confirmed by analyzing the numbers of CD45+
leukocytes and Tregs that were similar in Foxp3Cre/wt Relalox females and Foxp3Cre/wt controls (Figures 4C,D). Moreover, the proportions of activated conventional T cells (Tconvs), defined by the expression of CD44, CD62L and Ki67, was identical between the two mouse types (Figure 4E). Finally, no increased level of anti-DNA auto-antibodies were detected in the serum of the Foxp3Cre/wtRelalox females (Figure 4F). Thus, Foxp3Cre/wt Relalox heterozygous
females represent a proper model to study the intrinsic role of RelA in Tregs.
FIGURE 4 | Heterozygous Foxp3Cre/wtRelaloxdo not develop systemic inflammation. (A) Representative pictures of 8 week-old mice. (B) Representative histology of
lung, colon and skin of 8 week-old. Scale bars represent 100 µm. Number of CD45+(C), of Tregs among CD4+T cells (D), and proportion of CD44hiCD62Llowand
Ki67+among CD8+and CD4+conventional T cells (E) in different tissues (thy, thymus; spl, spleen; liv, liver; SI, small intestine) of 8 week-old Foxp3Cre/wt(Cre/wt) and
Foxp3Cre/wtRelalox(Cre/wt Relalox) mice. Each dot represents a mouse and lines show the means of pooled independent experiments. (F) Anti-DNA auto-antibodies
quantification in the serum of 8 week-old Foxp3Cre/wtand Foxp3Cre/wtRelaloxmice. Bars show the means of pooled independent experiments and error bars represent
In the Foxp3Cre/wt control females, CRE-expressing Tregs
(CRE+) were present in lower proportion compared to Tregs not expressing CRE (CRE−
) (Figure 5A, gray bars). The same tendency was observed for the different molecules that we investigated (Figures 5B–E, gray bars), suggesting that the CRE transgene impacts on Treg biology in this competitive condition. Compared to these controls, the knockout of RelA did not modify significantly the proportion of Tregs (Figure 5A, green bars) nor the proportion of Tregs expressing ICOS, CTLA-4, Nrp1 or Helios (Supplementary Figure 6). However, the absence of RelA expression had a severe impact on Treg activation since the proportions of CD44highCD62Llow, Ki67+, CD103+and the expression level of GITR among CRE+ Tregs were strongly and systematically reduced (Figures 5B–E). In conclusion, RelA expression by Tregs appears critical for the acquisition of their effector phenotype at the steady state.
RelA Plays an Important Role in Treg
Activation
To characterize more extensively the effects of the RelA deficiency on Tregs, we purified CRE-expressing Tregs from Foxp3Cre/wt(WT) and Foxp3Cre/wt Relalox (RelA KO) mice and profiled their transcriptomes by low-input RNAseq. Overall, transcriptome differences were modest (Figures 6A,B), with 180 differentially expressed genes at an arbitrary fold change cutoff of 2.0 (and false discovery rate < 0.05). The most biased transcript was Klrg1, as previously reported (28), but several other transcripts involved in Treg function and/or homing in the gut and skin showed a significant bias (e.g., Ccr4, Ccr6, Maf, Ahr, and Itgae) (Figures 6B,C). Gene ontology analysis did not reveal any evocative common pathway, so we projected various Treg-specific signatures onto the comparison of WT vs. RelA KO Tregs profiles (Figure 6D). RelA deficit modestly but significantly affected Treg identity as it reduced the canonical signature of genes differentially expressed in Tregs compared to Tconv cells (33) (Figure 6D, left). Moreover, consistent with the phenotype described above showing reduced proportion of activation markers in RelA-deficient Tregs in Foxp3Cre/wtRelalox mice, a stronger bias was observed for signatures typical of activated Tregs [from comparison of CD44hivs. CD62LhiTregs, or from Blimp1- WT vs. KO Tregs (11)]. Indeed, RelA-deficient Tregs had a transcriptional signature analogous to CD62Lhi Tregs and Blimp1 KO Tregs, corresponding to resting-like Tregs (Figure 6D, middle and right). This effect was not unique to activated Treg signature, as GSEA analysis showed a strong bias of generic signatures of activated CD4+
or CD8+
Tconv cells (32) (Figure 6E). For further resolution, we cross-matched the RelA WT/KO difference to a curated series of 289 signatures that distinguish different sub-phenotypes of Tregs (34) (Figure 6F). The enrichment score of several gene sets characterizing activated or effector Tregs were decreased in RelA KO Tregs compared to WT Tregs (lower region of Figure 6F). Interestingly, however, RelA-deficient Tregs were enriched in several signatures resulting from the expression of TF with inhibitory roles in Tregs, and most markedly for Bach2 (upper region of Figure 6F). Indeed,
the changes found here in response to RelA deficiency were largely anti-correlated with changes provoked by the absence of Bach2 in a previous report (7) (Figure 6G, r = −0.13 with p < 10−15 using a Pearson correlation). Overall, compared to WT Tregs, the transcriptomic signature of RelA-deficient Tregs confirmed their resting phenotype.
RelA-Deficient Tregs Have a Defect of
Stability
Our RNAseq data indicate an identity defect of RelA-deficient Tregs, which was first suggested in the colitis model (Figures 3E–G). However, one cannot conclude from this latter experiment that RelA plays an intrinsic role in Treg stability, owing to the very severe colitis developed by the mice injected with RelA-deficient Tregs. Indeed, increased instability of these latter could be well due to increased inflammation, and not RelA deficiency, since it is well established that different inflammatory factors precipitate Foxp3 loss (35). Thus, we further investigated whether RelA had any role in maintenance of Treg stability and identity by analyzing Foxp3 expression after co-transfer of RelA-sufficient and -deficient Tregs into the same mouse. Cells were purified from Foxp3Cre/wt Relalox mice (Foxp3Cre/wt for controls) and not from Foxp3Cre Relalox mice, since systemic inflammation in these latter mice could modify Treg biology in addition to the impact of the RelA defect. Tregs were co-transferred in CD3 KO mice with Tconvs to sustain viability and expansion of injected Tregs (Figure 7A). Sixteen days after transfer, the proportions of RelA-deficient cells were much lower than the ones of RelA-sufficient cells (Figure 7B), particularly in the colon, a location subjected to high inflammation in this setting. Importantly, a large fraction of RelA-deficient Tregs lost Foxp3 expression, becoming so-called ex-Tregs, in all lymphoid and non-lymphoid tissues, compared to RelA-sufficient Tregs (Figure 7C). Moreover, RelA-deficient ex-Tregs expressed higher amounts of the pro-inflammatory cytokines IFNγ and TNFα, in the spleen and mLN, than their wildtype counterparts (Figure 7D).
To further explore the mechanism of Treg instability, and since it has been reported that c-Rel is involved in the differentiation of Th1 and Th17 cells (36, 37), we performed electrophoretic mobility shift assays (EMSA) combined with supershifts to assess the activation status of the different NF-κB subunits in Tregs of Foxp3Cre and Foxp3Cre Relalox mice (Figure 7E). In control Tregs, there was mainly an activation of RelA, rather than RelB or c-Rel. As expected, we did not observe this phenomenon in RelA-deficient Tregs, confirming that the truncated RelA protein was not functional. However, in Tregs of Foxp3Cre Relalox mice there were much more activated NF-κB complexes, obviously due to the more activated phenotype of Tregs in these mice, which were mostly, if not only, constituted of c-Rel subunit. This massive c-Rel activation may be involved in Treg instability. In conclusion, our data show that lack of RelA activation strongly affect Treg stability leading to Foxp3 loss and increased differentiation of ex-Tregs, which may turn pathogenic through the production of inflammatory cytokines.
FIGURE 5 | Reduced expression of activation markers in RelA-deficient Tregs at steady state. Analyses in the indicated organs (thy, thymus; spl, spleen; liv, liver) of 8 week-old Foxp3Cre/wt(Cre/wt – gray bars) and Foxp3Cre/wtRelalox(Cre/wt Relalox–green bars) mice. (A) Representative density plots among CD4+cells to define
Tregs expressing CRE (CRE+) and percentages of CRE+among total Tregs in sdLN. Representative density plots and proportions of CD44hiCD62Llow(B), Ki67+(C),
CD103+(D) and MFI of GITR (E) among CRE+Tregs of sdLN. Bars show the means of pooled independent experiments and error bars represent SEM. For mouse
FIGURE 6 | RelA-deficient Tregs have identity and activation defects. (A) PCA analysis of WT and RelA KO Tregs. (B) Volcano plot of WT vs. RelA KO Tregs. Red and green indicate transcripts up- and down-regulated, respectively, by WT Tregs cells. (C) Relative expression of Itgae (CD103) expressed in counts per million in WT and RelA KO Tregs. (D) WT vs. RelA KO Tregs (as in A) overlaid with various Tregs signatures. Red and green indicate genes up- and down-regulated, respectively, in each (Continued)
FIGURE 6 | signature (chi-squared test for p-value). (E) GSEA plots of RelA-deficient Tregs compared with indicated set of genes up-regulated in effector memory CD4 (upper panel) and memory CD8 conventional T cells (lower panel) (32). (F) Heatmap for the enrichment score of each gene signature (VAT, visceral adipose tissue; LN, lymph nodes; SI, small intestine; Sp, spleen). (G) Fold change-fold change plot of WT vs. RelA KO Tregs (x-axis) and WT iTregs vs. WT Bach2 KO iTregs [y-axis, from published data (7)]. Red and green transcripts from (A). For mouse and experiment numbers, see Supplementary Table 1.
FIGURE 7 | RelA-deficient Tregs are unstable and turn pathogenic. (A–D) Adoptive transfer of a 1:1:8 ratio of a mix of CRE-expressing Tregs from Foxp3Cre/wt
(CD45.1/2 CD90.2 WT Tregs), Foxp3Cre/wtRelalox(CD45.2 CD90.2 RelA KO Tregs) mice and CD4+conventional T cells (CD90.1 Tconv) into CD3 KO mice and
analysis of donor cells 16 days later. (A) Experimental scheme and representative gating strategy from sdLN staining. (B) Ratio of RelA KO to WT Tregs in the indicated organs (spl, spleen; liv, liver; SI, small intestine) among CD90.2+donor cells. The horizontal dot line represents the initial ratio (in the syringe). (C)
Representative histograms and proportion of ex-Tregs from injected WT cells and RelA KO cells in different tissues. (D) Representative density plots and proportions of IFNγ+and TNF+cells among WT ex-Tregs and RelA KO ex-Tregs. Each dot represents a mouse, lines and bars show the means of pooled independent
experiments. Error bars represent SEM. (E) EMSA combined with supershift assay analysis of NF-κB subunits activation in Tregs isolated from Foxp3Cre(Cre) and
Foxp3CreRelalox(Cre Relalox) mice. The yellow squares point out the supershift of RelA or c-Rel containing complexes. The results are representative of independent
experiments. For mouse and experiment numbers, see Supplementary Table 1. The two-tailed unpaired non-parametric Mann–Whitney U-test was used for data not following a normal distribution and the t-test was used for data following a normal distribution *p < 0.05, **p < 0.01, ***p < 0.001.
DISCUSSION
Here, we show that RelA plays a major role in Treg biology, both at steady state and during inflammation, since its specific deletion leads to the development of a spontaneous, severe, and systemic autoimmune syndrome.
The disease recapitulates some of the symptoms observed in Treg-deficient scurfy mice, although with a slower kinetics (1). As in scurfy mice, the skin and lymphoid organs are
the most impaired tissues of Foxp3Cre Relalox, followed by the lung, stomach and colon and at lower extent the small intestine and liver. Also, we detected DNA auto-antibodies in the serum of our mice, as in scurfy mice (38, 39). We thus presume that Foxp3Cre Relalox mice develop an autoimmune
syndrome due to defective Tregs. Importantly, modification of the microbiota could play a major role in some tissue impairment such as the colon. Indeed, in Foxp3-deficient mice, colon damage becomes severe only after weaning, when microbial flora
develops extensively (38). Our data suggest that this disease is initially due to a major activation defect of RelA-deficient Tregs. Indeed, in the Foxp3Cre/wtRelaloxnon-inflamed mice, we observed reduced numbers of effector Tregs and suppressive molecules among the RelA-deficient Tregs. We thus speculate that in the Foxp3CreRelaloxmice, and more specifically in tissues
that are in contact with external environment and microbiota like the intestine and skin, effector T cells and myeloid cells become highly activated because of insufficient control by effector Tregs. Moreover, the decreased Treg proportion and number observed in those tissues in 5 week-old Foxp3Cre Relalox, potentially
due to Treg instability and a decreased expression of gut and skin homing molecules (reduced mRNA levels of Ccr4, Ccr6) (40,41), may exacerbate this phenomenon. Then, inflammatory factors may alter drastically stability of RelA-deficient Tregs most of them becoming pathogenic ex-Tregs, as we observed in the colitis model and cell co-transfer in lymphopenic mice experiments, precipitating local inflammation. The combination of reduced Treg number in the intestine and the skin, reduced Treg activation and the generation of pathogenic ex-Tregs may be the driving forces of the autoimmune syndrome of Foxp3Cre Relaloxmice.
Recent reports describe similar conditional KO mice developing a related autoimmune syndrome (28–30). They observed that Foxp3Cre Relaloxmice developed inflammation of the skin, stomach, lung and colon, massive activation of effector T cells and myeloid cells in lymphoid organs and high levels of inflammatory cytokines, immunoglobulins and anti-DNA in the serum. We confirmed these data and got deeper into the analysis of the disease since we showed that the effector T cells and myeloid cells were also drastically activated in multiple non-lymphoid organs. These data suggest a major defect of RelA-deficient Tregs. In addition, the injection of WT Tregs before 7 days of age was sufficient to stop the development of the pathology (data not shown). Surprisingly, we and others observed an increase of Treg proportion in lymphoid organs and in vitro assays did not reveal Treg suppressive defect. However, our extensive analysis enabled to point out a decrease of Treg proportion in the inflamed non-lymphoid tissues, such as the colon and skin. Our RNAseq analysis revealed a decreased expression of Ccr4, Ccr6, Maf, Ahr, and Itgae (encoding for CD103) which are involved in Treg function and/or homing in those tissues. Particularly, it has been shown that Ahr regulates the expression of Ccr6 and Itgae and that Ahr deletion in Tregs leads to their decrease in the gut (42). As discussed above, this initial event may ignite the whole immune system, leading to widespread activation of the lymphoid and myeloid compartments and release of inflammatory cytokines that will boost global Treg activation and expansion, which remains insufficient to control the pathology.
Investigating initial events that led to disease could not be properly analyzed in Foxp3Cre Relalox mice since inflammation has major impact on Treg migration, survival, activation, suppressive function or stability (35, 43), confounding the interpretation of what was due to inflammation or to the intrinsic RelA deficit. Using LckCre Relaloxmice, Messina et al. suggested that a major alteration of RelA-deficient Tregs was their defect
to differentiate in effector Tregs (28). However, in this work, this defect was only partial, observed in LN and not in the spleen, and mostly analyzed in a quite irrelevant model since RelA was knockout in whole T cells. Vasanthakumar et al. showed a more global activation defect of RelA-deficient Tregs using Foxp3Cre/wt Relalox mice or mixed bone marrow chimeric mice
(29). We confirmed and completed these results by showing a downregulation of CD44, CD103, Ki67, and GITR not only in the lymphoid organs but also in the liver and lung of Foxp3Cre/wt Relaloxmice. Moreover, our transcriptomic analysis highlighted the major activation defect of RelA-deficient Tregs, since a strong bias was observed for signatures typical of activated Tregs. This reduced capacity of RelA-deficient Tregs to acquire an activation status could be due to an alteration of the proper function of the multimolecular complex normally containing Foxp3, p300, Helios, RelA, and other TFs acting as transcriptional activator (27).
What was more consistent and unexpected was the increased instability of RelA-deficient Tregs. This was first suggested in the colitis model, but more direct evidence came from studies where we compared RelA-sufficient and -deficient Tregs in the same environment after cell co-transfer in lymphopenic mice. We clearly showed that most RelA-deficient Tregs became ex-Tregs, contrary to control Tregs. Although with reduced intensity, increased instability of Rela-deficient Tregs was also observed in the absence of inflammation, as measured after transfer in lymphoreplete mice (data not shown). Moreover, we detected low amounts of the truncated RelA protein in the Tconvs of Foxp3Cre
Relaloxmice, which may reveal the existence of ex-Tregs in these mice. Furthermore, we showed that these newly RelA-deficient ex-Tregs expressed inflammatory cytokines, suggesting that they could become pathogenic. This phenomenon may explain the increased severity observed in the colitis experiment and support our hypothesis that this ex-Tregs contribute to the pathology of Foxp3CreRelaloxmice.
Foxp3 stability is controlled by histone and protein acetylation and by DNA methylation in the CNS 2 of Foxp3 (44). RelA activity may impact on these epigenetic modulations by different ways. RelA interacts with CBP and p300 histone/protein acetyltransferases, which seems to be critical for the recruitment of CBP and p300 to their target promoter sites, as shown in fibroblasts (45). Because CBP and p300 promote Foxp3 transcription, Foxp3 stability at the level of CNS2 and prevent Foxp3 degradation (17,46), RelA-deficient Tregs may have major instability. It has also been recently reported that RelA binds to genes involved in histone modification (29). Also, Foxp3 and RelA seem to cooperate to promote Foxp3 and CD25 expression by binding to their regulatory sequences (47, 48), which may favor Treg stability given the known role of IL-2 receptor signaling pathway in maintenance of Treg identity (16). Furthermore, Oh et al. recently reported that Foxp3 expression was down-regulated in Tregs of Foxp3Cre cRellox mice and even more in the Foxp3Cre cRelloxRelAlox mice, suggesting that RelA favors Foxp3 expression (30). Interestingly, we observed a dramatic increased binding of c-Rel to its target DNA sequence in Tregs of Foxp3Cre Relaloxmice. This phenomenon may hide the genuine role of RelA in Tregs and may further increase their
conversion in pathogenic cells since c-Rel has been reported to be involved in Th1 and Th17 differentiation (36,37).
Overall, our study further confirms the non-redundant role of RelA in Treg biology and reveals its new role in Treg stability. There are drugs targeting NF-κB subunits. Thus, it would be of strong interest to be able to target RelA in Tregs to propose new therapies triggering or inhibiting Tregs in autoimmune diseases or cancer, respectively. However, RelA has an important role in development and function of other immune cells (49–51). For instance, RelA is critical for CD4+
Tconv activation since its deletion prevent the development of autoimmunity in Foxp3Cre
Relaloxmice (28). Also, RelA is essential for differentiation and function of Th1, Th2, Th17, and Th9 cells (37,52,53). Therefore, a specific targeting of RelA in Tregs would be required.
EXPERIMENTAL PROCEDURES
Mice
Foxp3-CRE-IRES-YFP (Foxp3Cre) (54), RelAflox(31) and
Foxp3-IRES-GFP (55) knock-in (Foxp3GFP) mice were kindly given by Prs. Alexander Rudensky, Falk Weih and Bernard Malissen, respectively. CD3etm1Mal (CD3−/−), CD45.1, CD90.1, and
RAG2−/− mice were obtained from the cryopreservation
distribution typing and animal archiving department (Orléans, France). All mice were on a C57Bl/6 background. Mice were housed under specific pathogen-free conditions. All experimental protocols were approved by the local ethics committee “Comité d’éthique en expérimentation animal Charles Darwin N◦
5” under the number 02811.03 and are in compliance with European Union guidelines.
Western Blot
Cells were lysed for 20 min on ice in extraction buffer (0.4 M NaCl, 25 mM Hepes pH 7.7, 1.5 mM MgCl2, 0.2 mM EDTA, 1%, NP4O, 20 mM glycerol phosphate, 0.2 mM Na3VO4, 10 mM PNPP, 2 mM DTT, 0.1 M PMSF). Whole cell extract was harvested after centrifuging the lysate for 10 min at 9,500 × g. 20 µg of whole cell extract were separated on 7.5% SDS– polyacrylamide gels and transferred to nitrocellulose membranes (GE Healthcare). Immunoblotting was performed with anti-RelA (C20) polyclonal antibodies (Santa Cruz Biotechnology) and anti-β-actin antibody (Sigma Aldrich) and visualized using the ECL Western blotting detection kit (Pierce).
Histology
Organs were collected and fixed in PBS containing 4% formaldehyde for 48 h and then transferred in 70% ethanol. Five-micrometer paraffin-embedded sections were cut and stained with hematoxylin and eosin and then blindly analyzed.
Cell Preparation From Tissues
For lymphoid tissues, cells were isolated by mechanical dilacerations. For non-lymphoid tissues, anesthetized mice were perfused intracardially with cold PBS. Small pieces of livers and lungs were digested in type IV collagenase (0.3 mg/ml) and DNase I (100 µg/ml) for 30 min at 37◦C, followed by Percoll gradient (30–70%) separation. Small pieces of intestines,
removed of their Peyer patches and epithelium, were digested in type IV collagenase (1 mg/ml) and DNase I (10 µg/ml) for 30 min at 37◦
C, followed by Percoll gradient (40–80%) separation. Small pieces of skin were digested in liberase DL (0.4 mg/ml), collagenase D (0.05 mg/ml) and DNase I (10 µg/ml) for 1 h at 37◦
C, followed by Percoll gradient (40–80%) separation.
Antibodies and Flow Cytometry Analysis
The following mAbs from BD Biosciences were used: anti-CD45 (30-F11), anti-CD8 (53-6.7), anti-CD4 (RM4-5), anti-CD62L (MEL-14), anti-CD90.1 (OX-7), anti-CD45.1 (A20), anti-CD45.2 (104), CD25 (PC61 or 7D4), ICOS (7E.17G9), GITR (DTA-1), CD103 (M290), Helios (22F6), anti-CTLA-4 (UC10-4F10-11), anti-CD11b (M1/70), anti-CD11c (HL3), anti-CD19 (1D3), anti-IA/E (M5/114.15.2), anti-Ly6C (AL-21), anti-Ly6G (1A8). Anti-GFP antibody was purchased from Life Technologies. Anti-CD3 (145-2C11), anti-Foxp3 (FJK-16s), anti-CD44 (IM7), anti-Ki-67 (SOLA15), anti-Nrp1 (3DS304M), anti-NKp46 (29A1.4) and anti-F4/80 (BM8) were purchased from eBioscience, and Foxp3 staining was performed using the eBioscience kit and protocol. Cells were acquired on a BD LSRII and a BD Fortessa X20 cytometers and analyzed using FlowJo software.
Cytokine Quantification
Serum cytokines were quantified using the mouse Th1/Th2/Th17 Cytokine CBA Kit (BD Biosciences) according to manufacturer’s procedure. Datas were analyzed using FCAP array software.
Immunoglobulin and Autoantibody
Quantification by ELISA
Ninety-six-well flat plates were coated with either salmon sperm DNA (Sigma) or with goat anti-mouse IgM, IgA, IgE, IgG1, IgG2b (Southern Biotech). After washes, they were saturated with BSA and first incubated with mice sera, then with biotinylated goat anti-mouse IgG (Southern Biotech) or goat anti-mouse IgM, IgA, IgE, IgG1, IgG2b (Southern Biotech). A streptavidin-horseradish conjugate (Sigma) was added followed by the addition of TMB (eBioscience). The reaction was stopped with HCl (1N) and revealed with an ELISA plate reader DTX880 Multimode Detector (Beckman Coulter).
Treg and Tconv Cell Purification
Treg were purified after enrichment of CD25+
cells using biotinylated anti-CD25 mAb (7D4) and anti-biotin microbeads (Miltenyi Biotec), followed by CD4 staining (RM4.5) and cell sorting of CD4+ Foxp3/YFP+ cells or CD4+ Foxp3/GFP+ using the BD FACSAria II. Tconv cells were purified after enrichment of CD25−
cells using biotinylated anti-CD25 mAb (7D4) or of CD8−
CD19−
CD11b−
cells using biotinylated CD8 (53-6.7), CD19 (1D3), and CD11b (M1/70) mAbs and anti-biotin microbeads (Miltenyi Biotec), followed by CD4 staining (RM4.5), and cell sorting of CD4+ Foxp3/YFP−cells or CD4+ Foxp3/GFP−
Cell Cultures
Purified Treg (CD4+
YFP+
, 25 × 103 cells/well) were cultured with or without whole splenocyte from CD3KO mice (7.5 × 10⁴ cells/well), anti-CD3 mAb (0,05 µg/ml, BioXcell), TNF (50 ng/ml, Protein Service Facility, VIB, Belgium) and IL-2 (10 ng/ml, Peproteck) in a 96-well round plate in RPMI 1640–10% FCS. For suppression assays, after labeling with CellTrace Violet Proliferation Kit (Life technologies), Tconv cells (CD4+
YFP−
, 2.5 × 10⁴ cells/well) were co-cultures with various Treg (CD4+
YFP+
) numbers and stimulated by splenocytes from CD3 KO mice (7.5 × 10⁴ cells/well)
and soluble anti-CD3 (0.05 µg/ml 2C11, BioXCell) in RPMI 1640–10% FCS.
Colitis
Tconv cells (CD4+
GFP−
, 1 × 10⁵cells) and Tregs (CD4+
YFP+
, 2 × 10⁴ cells) were injected intravenously into sex-matched RAG2−/− mice. The clinical evaluation was performed three
times a week by measuring body weight. Colitis was scored on tissue sections as described previously (56).
T-Cell Adoptive Transfer
CD3 KO mice were co-transferred with Treg (CD4+YFP+, 1 × 10⁵ each) purified from age and sex-matched CD45.1/2 Foxp3Cre/+ and CD45.2/2 Foxp3Cre/+ Relalox mice and Tconv cells (CD4+
GFP−
, 8 × 10⁵) purified from CD90.1 Foxp3GFPmice.
Electrophoretic Mobility Shift Assays
(EMSA) Combined With Supershit Assays
Nuclear extracts were prepared and analyzed for DNA binding activity using the HIV-LTR tandem κB oligonucleotide as κB probe (57). For supershift assays, nuclear extracts were incubated with specific antibodies for 30 min on ice before incubation with the labeled probe.
Gene-Expression Profiling and Analysis
Tregs (1,000) were double-sorted into TRIzol (Invitrogen). Subsequent sample processing was followed by Ultra-low input RNAseq protocol as described (58). Normalized data were analyzed with Multiplot Studio, GSEA and Gene-e modules in Genepattern. For signature enrichment analysis, each signature was curated from published datasets and computed by comparison between two conditions (e.g., WT vs. KO). Data were downloaded from GEO and only the ones containing replicates were used. To reduce noise, genes with a coefficient of variation between biological replicates > 0.6 in either comparison groups were selected. Up- and down-regulated transcripts were defined as having a fold change in gene expression > 1.5 or < 2/3 and a t-test p-value < 0.05. A signature score for each single cell was computed by summing the counts for the upregulated genes and subtracting the counts for the downregulated genes. Z scores were plotted in the heat map (Zemmour_Code/Zemmour_Code.Rmd: ∗∗
Treg signatures and single cell score∗∗
).
Statistical Analysis
Statistical analyses were performed using GraphPad Prism Software. Statistical significance was determined using a log-rank (Mantel- Cox) test for the mouse survival data. For all the other statistical analysis, the two-tailed unpaired non-parametric Mann–Whitney U-test was used for data not following a normal distribution and the t-test was used for data following a normal distribution. ∗
p < 0.05, ∗∗
p < 0.01,
∗∗∗
p < 0.001, ∗∗∗∗
p < 0.0001. Means ± SEM were used throughout the figures.
DATA AVAILABILITY STATEMENT
The raw data supporting the conclusions of this manuscript will be made available by the authors, without undue reservation, to any qualified researcher.
ETHICS STATEMENT
All experimental protocols were approved by the local ethics committee Comité d’éthique en expérimentation animal Charles Darwin N◦
5 under the number 02811.03 and are in compliance with European Union guidelines.
AUTHOR CONTRIBUTIONS
BS and ER designed the research. ER performed almost all the experiments and analyzed the data. ML, RV, JD, SG, and AR helped ER on some experiments. H-KK and CB performed and analyzed the RNA-seq data. DC and VB performed and analyzed the western blot and EMSA. BS and ER wrote the manuscript using comments from all authors.
ACKNOWLEDGMENTS
We are grateful to Pr. Alexander Rudensky and Pr. Falk Weih for providing us the Foxp3Creand Relaloxmice, respectively, and Christelle Enond, Doriane Foret, Flora Issert, Olivier Bregerie, Bocar Kane and Maria Mihoc for their expert care of the mouse colony. We also want to thank Fatiha Bouhidel for helping for the histological analysis. Part of the data presented in this manuscript have been described in the PhD thesis of ER that is freely available online (https://tel.archives-ouvertes.fr/tel-01884171). This work was supported by the Agence Nationale de la Recherche (grant ANR-15-CE15-0015-03), the Fondation pour la Recherche Médicale (Equipes FRM 2015; FDT20160435696), the Fondation Bettencourt Schueller and NIH grant AI-116834.
SUPPLEMENTARY MATERIAL
The Supplementary Material for this article can be found online at: https://www.frontiersin.org/articles/10.3389/fimmu. 2019.02487/full#supplementary-material
REFERENCES
1. Sakaguchi S, Ono M, Setoguchi R, Yagi H, Hori S, Fehervari Z, et al. Foxp3+CD25+CD4+ natural regulatory T cells in dominant self-tolerance and autoimmune disease. Immunol Rev. (2006) 212:8–27. doi: 10.1111/j.0105-2896.2006.00427.x
2. Isomura I, Palmer S, Grumont RJ, Bunting K, Hoyne G, Wilkinson N, et al. C-Rel is required for the development of Thymic Foxp3+ CD4 regulatory T cells. J Exp Med. (2009) 206:3001–14. doi: 10.1084/jem.20091411
3. Long M, Park S-G, Strickland I, Hayden MS, Ghosh S. Nuclear factor-κB modulates regulatory T cell development by directly regulating expression of Foxp3 transcription factor. Immunity. (2009) 31:921–31. doi: 10.1016/j.immuni.2009.09.022
4. Wu Y, Borde M, Heissmeyer V, Feuerer M, Lapan AD, Stroud JC, et al. FOXP3 controls regulatory T cell function through cooperation with NFAT. Cell. (2006) 126:375–87. doi: 10.1016/j.cell.2006.05.042
5. Ono M, Yaguchi H, Ohkura N, Kitabayashi I, Nagamura Y, Nomura T, et al. Foxp3 controls regulatory T-cell function by interacting with AML1/Runx1. Nature. (2007) 446:685–9. doi: 10.1038/nature05673
6. Pan F, Yu H, Dang EV, Barbi J, Pan X, Grosso JF, et al. Eos mediates
Foxp3-dependent gene silencing in CD4+
regulatory T cells. Science. (2009) 325:1142–6. doi: 10.1126/science.1176077
7. Roychoudhuri R, Hirahara K, Mousavi K, Clever D, Klebanoff CA, Bonelli M, et al. BACH2 represses effector programs to stabilize Treg-mediated immune homeostasis. Nature. (2013) 498:506–10. doi: 10.1038/nature12199
8. Chaudhry A, Rudra D, Treuting P, Samstein RM, Liang Y, Kas A, et al. CD4+
regulatory T cells control TH17 responses in a Stat3-dependent manner.
Science. (2009) 326:986–91. doi: 10.1126/science.1172702
9. Koch MA, Tucker-Heard G, Perdue NR, Killebrew JR, Urdahl KB, Campbell DJ. The transcription factor T-bet controls regulatory T cell homeostasis and function during type 1 inflammation. Nat Immunol. (2009) 10:595–602. doi: 10.1038/ni.1731
10. Zheng Y, Chaudhry A, Kas A, deRoos P, Kim JM, Chu TT, et al. Regulatory T-cell suppressor program Co-Opts transcription factor IRF4 to control TH2 responses. Nature. (2009) 458:351–6. doi: 10.1038/nature07674
11. Cretney E, Xin A, Shi W, Minnich M, Masson F, Miasari M, et al. The transcription factors Blimp-1 and IRF4 jointly control the differentiation and function of effector regulatory T cells. Nat Immunol. (2011) 12:304–11. doi: 10.1038/ni.2006
12. Linterman MA, Pierson W, Lee SK, Kallies A, Kawamoto S, Rayner TF, et al. Foxp3+ follicular regulatory T cells control the germinal center response. Nat Med. (2011) 17:975–82. doi: 10.1038/nm.2425
13. Cipolletta D, Feuerer M, Li A, Kamei N, Lee J, Shoelson SE, et al. PPAR-γ is a major driver of the accumulation and phenotype of adipose tissue Treg cells. Nature. (2012) 486:549–53. doi: 10.1038/nature11132
14. Dias S, D’Amico A, Cretney E, Liao Y, Tellier J, Bruggeman C, et al. Effector regulatory T cell differentiation and immune homeostasis depend on the transcription factor Myb. Immunity. (2017) 46:78–91. doi: 10.1016/j.immuni.2016.12.017
15. Wohlfert EA, Grainger JR, Bouladoux N, Konkel JE, Oldenhove G, Ribeiro CH, et al. GATA3 controls Foxp3+regulatory T cell fate during inflammation
in mice. J Clin Invest. (2011) 121:4503–15. doi: 10.1172/JCI57456
16. Feng Y, Arvey A, Chinen T, van der Veeken J, Gasteiger G, Rudensky AY. Control of the inheritance of regulatory T cell identity by a cis element in the Foxp3 locus. Cell. (2014) 158:749–63. doi: 10.1016/j.cell.2014.07.031 17. Liu Y, Wang L, Han R, Beier UH, Akimova T, Bhatti T, et al. Two
histone/protein acetyltransferases, CBP and P300, are indispensable for Foxp3+ T-regulatory cell development and function. Mol Cell Biol. (2014) 34:3993–4007. doi: 10.1128/MCB.00919-14
18. DuPage M, Chopra G, Quiros J, Rosenthal WL, Morar MM, Holohan D, et al. The chromatin-modifying enzyme Ezh2 is critical for the maintenance of regulatory T cell identity after activation. Immunity. (2015) 42:227–38. doi: 10.1016/j.immuni.2015.01.007
19. Yang R, Qu C, Zhou Y, Konkel JE, Shi S, Liu Y, et al. Hydrogen sulfide promotes Tet1- and Tet2-mediated Foxp3 demethylation to drive regulatory T cell differentiation and maintain immune homeostasis. Immunity. (2015) 43:251–63. doi: 10.1016/j.immuni.2015.07.017
20. Garg G, Muschaweckh A, Moreno H, Vasanthakumar A, Floess S, Lepennetier G, et al. Blimp1 prevents methylation of Foxp3 and loss of regulatory T cell identity at sites of inflammation. Cell Rep. (2019) 26:1854–68.e5. doi: 10.1016/j.celrep.2019.01.070
21. Bettelli E, Dastrange M, Oukka M. Foxp3 interacts with nuclear factor of activated T cells and NF-KB to repress cytokine gene expression and effector functions of T helper cells. Proc Natl Acad Sci USA. (2005) 102:5138–43. doi: 10.1073/pnas.0501675102
22. Ruan Q, Kameswaran V, Tone Y, Li L, Liou H-C, Greene MI,
et al. Development of Foxp3+ regulatory T cells is driven
by the C-Rel enhanceosome. Immunity. (2009) 31:932–40.
doi: 10.1016/j.immuni.2009.10.006
23. Chang J-H, Xiao Y, Hu H, Jin J, Yu J, Zhou X, et al. Ubc13 maintains the suppressive function of regulatory T cells and prevents their conversion into effector-like T cells. Nat Immunol. (2012) 13:481–90. doi: 10.1038/ni.2267 24. Heuser C, Gotot J, Piotrowski EC, Philipp M-S, Courrèges CJF, Otte
MS, et al. Prolonged IKKβ inhibition improves ongoing CTL antitumor responses by incapacitating regulatory T cells. Cell Rep. (2017) 21:578–86. doi: 10.1016/j.celrep.2017.09.082
25. Chen X, Willette-Brown J, Wu X, Hu Y, Howard OMZ, Hu Y, et al. IKKα is required for the homeostasis of regulatory T cells and for the expansion of both regulatory and effector CD4 T cells. FASEB J. (2015) 29:443–54. doi: 10.1096/fj.14-259564
26. Oh H, Ghosh S. NF-KB: roles and regulation in different CD4+ T-cell subsets. Immunol Rev. (2013) 252:41–51. doi: 10.1111/imr.12033
27. Kwon HK, Chen HM, Mathis D, Benoist C. Different molecular complexes that mediate transcriptional induction and repression by FoxP3. Nat Immunol. (2017) 18:ni.3835. doi: 10.1038/ni.3835
28. Messina N, Fulford T, O’Reilly L, Loh WX, Motyer JM, Ellis D, et al. The NF-κB transcription factor RelA is required for the tolerogenic function of Foxp3+ regulatory T cells. J Autoimmun. (2016) 70:52–62. doi: 10.1016/j.jaut.2016.03.017
29. Vasanthakumar A, Liao Y, Teh P, Pascutti MF, Oja AE, Garnham AL, et al. The TNF receptor superfamily-NF-κB axis is critical to maintain effector regulatory T cells in lymphoid and non-lymphoid tissues. Cell Rep. (2017) 20:2906–20. doi: 10.1016/j.celrep.2017.08.068
30. Oh H, Grinberg-Bleyer Y, Liao W, Maloney D, Wang P, Wu Z, et al. An NF-κB transcription-factor-dependent lineage-specific transcriptional program promotes regulatory T cell identity and function. Immunity. (2017) 47:450– 465.e5. doi: 10.1016/j.immuni.2017.08.010
31. Algül H, Treiber M, Lesina M, Nakhai H, Saur D, Geisler F, et al. Pancreas-specific RelA/P65 truncation increases susceptibility of acini to inflammation-associated cell death following cerulein pancreatitis. J Clin Invest. (2007) 117:1490–501. doi: 10.1172/JCI29882
32. Kaech SM, Hemby S, Kersh E, Ahmed R. Molecular and functional profiling of memory CD8 T cell differentiation. Cell. (2002) 111:837–51. doi: 10.1016/S0092-8674(02)01139-X
33. Hill JA, Feuerer M, Tash K, Haxhinasto S, Perez J, Melamed R, et al. Foxp3 transcription-factor-dependent and -independent regulation of the regulatory T cell transcriptional signature. Immunity. (2007) 27:786–800. doi: 10.1016/j.immuni.2007.09.010
34. Zemmour D, Zilionis R, Kiner E, Klein AM, Mathis D, Benoist C. Single-cell gene expression reveals a landscape of regulatory T cell phenotypes shaped by the TCR. Nat Immunol. (2018) 19:291–301. doi: 10.1038/s41590-018-0051-0 35. Zhou X, Bailey-Bucktrout SL, Jeker LT, Penaranda C, Martínez-Llordella
M, Ashby M, et al. Instability of the transcription factor Foxp3 leads to the generation of pathogenic memory T cells in vivo. Nat Immunol. (2009) 10:1000–7. doi: 10.1038/ni.1774
36. Hilliard BA, Mason N, Xu L, Sun J, Lamhamedi-Cherradi S-E, Liou H-C, et al. Critical roles of C-Rel in autoimmune inflammation and helper T cell differentiation. J Clin Invest. (2002) 110:843–50. doi: 10.1172/JCI15254 37. Ruan Q, Kameswaran V, Zhang Y, Zheng S, Sun J, Wang J, et al. The Th17
immune response is controlled by the Rel–RORγ-RORγT transcriptional axis. J Exp Med. (2011) 208:2321–33. doi: 10.1084/jem.20110462
38. Sharma R, Sung SJ, Fu SM, Ju ST. Regulation of multi-organ inflammation in the regulatory T cell-deficient scurfy mice. J. Biomed. Sci. (2009) 16:20. doi: 10.1186/1423-0127-16-20
39. Hadaschik EN, Wei X, Leiss H, Heckmann B, Niederreiter B, Steiner G, et al. Regulatory T cell-deficient scurfy mice develop systemic autoimmune features resembling lupus-like disease. Arthritis Res Ther. (2015) 17:35. doi: 10.1186/s13075-015-0538-0
40. Sather BD, Treuting P, Perdue N, Miazgowicz M, Fontenot JD, Rudensky AY, et al. Altering the distribution of Foxp3+ regulatory T cells results in tissue-specific inflammatory disease. J Exp Med. (2007) 204:1335–47. doi: 10.1084/jem.20070081
41. Kitamura K, Farber JM, Kelsall BL. CCR6 marks regulatory T cells as a colon-tropic, interleukin-10-producing phenotype. J Immunol. (2010) 185:3295– 304. doi: 10.4049/jimmunol.1001156
42. Ye J, Qiu J, Bostick JW, Ueda A, Schjerven H, Li S, et al. The Aryl hydrocarbon receptor preferentially marks and promotes gut regulatory T cells. Cell Rep. (2017) 21:2277–90. doi: 10.1016/j.celrep.2017.10.114
43. van der Veeken J, Gonzalez AJ, Cho H, Arvey A, Hemmers S, Leslie CS, et al. Memory of inflammation in regulatory T cells. Cell. (2016) 166:977–90. doi: 10.1016/j.cell.2016.07.006
44. Polansky JK, Kretschmer K, Freyer J, Floess S, Garbe A, Baron U, et al. DNA methylation controls Foxp3 gene expression. Eur J Immunol. (2008) 38:1654–63. doi: 10.1002/eji.200838105
45. Mukherjee SP, Behar M, Birnbaum HA, Hoffmann A, Wright PE, Ghosh G. Analysis of the RelA:CBP/p300 interaction reveals its involvement in NF-κB-driven transcription. PLoS Biol. (2013) 11:e1001647. doi: 10.1371/journal.pbio.1001647
46. van Loosdregt J, Coffer PJ. Post-translational modification networks
regulating FOXP3 function. Trends Immunol. (2014) 35:368–78.
doi: 10.1016/j.it.2014.06.005
47. Soligo M, Camperio C, Caristi S, Scott,à C, Del Porto P, Costanzo A, et al. CD28 costimulation regulates FOXP3 in a RelA/NF-KB-dependent mechanism. Eur J Immunol. (2011) 41:503–13. doi: 10.1002/eji.201040712 48. Camperio C, Caristi S, Fanelli G, Soligo M, Del Porto P, Piccolella
E. Forkhead transcription factor FOXP3 upregulates CD25 expression through cooperation with RelA/NF-κB. PLoS ONE. (2012) 7:e48303. doi: 10.1371/journal.pone.0048303
49. Vallabhapurapu S, Karin M. Regulation and function of NF-κB transcription factors in the immune system. Annu Rev Immunol. (2009) 27:693–733. doi: 10.1146/annurev.immunol.021908.132641
50. Gerondakis S, Siebenlist U. Roles of the NF-κB pathway in lymphocyte development and function. Cold Spring Harb Perspect Biol. (2010) 2:a000182. doi: 10.1101/cshperspect.a000182
51. Hayden MS, Ghosh S. NF-κB in immunobiology. Cell Res. (2011) 21:223–44. doi: 10.1038/cr.2011.13
52. Li-Weber M, Giaisi M, Baumann S, Pálfi K, Krammer PH. NF-κB synergizes with NF-AT and NF-IL6 in activation of the IL-4 gene in T cells. Eur J Immunol. (2004) 34:1111–8. doi: 10.1002/eji.200324687
53. Balasubramani A, Shibata Y, Crawford GE, Baldwin AS, Hatton RD, Weaver CT. Modular utilization of distal cis-regulatory elements controls Ifng gene expression in T cells activated by distinct stimuli. Immunity. (2010) 33:35–47. doi: 10.1016/j.immuni.2010.07.004
54. Rubtsov YP, Rasmussen JP, Chi EY, Fontenot J, Castelli L,
Ye X, et al. Regulatory T cell-derived interleukin-10 limits
inflammation at environmental interfaces. Immunity. (2008) 28:546–58. doi: 10.1016/j.immuni.2008.02.017
55. Wang Y, Kissenpfennig A, Mingueneau M, Richelme S, Perrin P, Chevrier
S, et al. Th2 lymphoproliferative disorder of LatY136F mutant mice
unfolds independently of TCR-MHC engagement and is insensitive to
the action of Foxp3+
regulatory T cells. J Immunol. (2008) 180:1565–75. doi: 10.4049/jimmunol.180.3.1565
56. Martin B, Auffray C, Delpoux A, Pommier A, Durand A, Charvet C, et al. Highly self-reactive naive CD4 T cells are prone to differentiate into regulatory T cells. Nat Commun. (2013) 4:ncomms3209. doi: 10.1038/ncomms3209 57. Jacque E, Billot K, Authier H, Bordereaux D, Baud V. RelB inhibits cell
proliferation and tumor growth through P53 transcriptional activation. Oncogene. (2013) 32:2661–9. doi: 10.1038/onc.2012.282
58. Zemmour D, Pratama A, Loughhead SM, Mathis D, Benoist C. Flicr, a long noncoding RNA, modulates Foxp3 expression and autoimmunity. Proc Natl Acad Sci USA. (2017) 114:E3472–80. doi: 10.1073/pnas.1700946114
Conflict of Interest: The authors declare that the research was conducted in the
absence of any commercial or financial relationships that could be construed as a potential conflict of interest.
Copyright © 2019 Ronin, Lubrano di Ricco, Vallion, Divoux, Kwon, Grégoire, Collares, Rouers, Baud, Benoist and Salomon. This is an open-access article distributed under the terms of the Creative Commons Attribution License (CC BY). The use, distribution or reproduction in other forums is permitted, provided the original author(s) and the copyright owner(s) are credited and that the original publication in this journal is cited, in accordance with accepted academic practice. No use, distribution or reproduction is permitted which does not comply with these terms.