HAL Id: hal-02633065
https://hal.archives-ouvertes.fr/hal-02633065
Submitted on 27 May 2020HAL is a multi-disciplinary open access archive for the deposit and dissemination of sci-entific research documents, whether they are pub-lished or not. The documents may come from teaching and research institutions in France or abroad, or from public or private research centers.
L’archive ouverte pluridisciplinaire HAL, est destinée au dépôt et à la diffusion de documents scientifiques de niveau recherche, publiés ou non, émanant des établissements d’enseignement et de recherche français ou étrangers, des laboratoires publics ou privés.
Analysis of the human chorionic gonadotropin protein at
the intact level by HILIC-MS and comparison with
RPLC-MS
Julien Camperi, Audrey Combès, Thierry Fournier, Valérie Pichon, Nathalie
Delaunay
To cite this version:
Julien Camperi, Audrey Combès, Thierry Fournier, Valérie Pichon, Nathalie Delaunay. Analysis of the human chorionic gonadotropin protein at the intact level by HILIC-MS and comparison with RPLC-MS. Analytical and Bioanalytical Chemistry, Springer Verlag, 2020, �10.1007/s00216-020-02684-8�. �hal-02633065�
1
Analysis of the human chorionic gonadotropin protein at the intact level by
HILIC-MS and comparison with RPLC-MS
Julien Camperia, Audrey Combèsa, Thierry Fournierb, Valerie Pichona,c, Nathalie Delaunaya
a
Laboratory of Analytical, Bioanalytical Sciences and Miniaturization, UMR CBI 8231 ESPCI Paris - CNRS, PSL University, Paris, France
b
Laboratory of Physiopathology and PharmacoToxicology of the Human Placenta, UMR-S 1139 Inserm - University Paris Descartes, Sorbonne Paris Cité, Paris, France
c
Sorbonne Université, Paris, France
Corresponding author: Nathalie Delaunay, [email protected]; +331 40794651. ORCID: 0000-0003-3008-0286. Corresponding author institution: LSABM, UMR CBI 8231 CNRS – ESPCI Paris, 10 rue Vauquelin, 75005 Paris, France.
Keywords: high resolution mass spectrometry; human Chorionic Gonadotropin; hydrophilic interaction chromatography; intact protein; reversed-phase liquid chromatography; time-of-flight
Declarations
Funding: This work has received the support of "Institut Pierre-Gilles de Gennes" (laboratoire d’excellence, “Investissements d’avenir” program ANR-10-IDEX-0001-02 PSL and ANR-10-LABX-31). Availability data and material: data will be available on request.
Abbreviations: ACN, acetonitrile; BPC, base peak chromatogram; FA, formic acid; hCG, human Chorionic Gonadotropin; hCGα, alpha subunit of the human Chorionic Gonadotropin; hCGβ, beta subunit of the human Chorionic Gonadotropin; HILIC, hydrophilic interaction liquid chromatography;
2
r-hCG, recombinant human Chorionic Gonadotropin; TFA: trifluoroacetic acid. TIC, total ion chromatogram; u-hCG, human Chorionic Gonadotropin isolated from urine of pregnant women. XIC, extracted ion chromatogram.
Abstract
In the present work, the human Chorionic Gonadotropin (hCG) hormone was characterized for the first time by HILIC coupled to high-resolution (HR) quadrupole/time-of-flight (qTOF) mass spectrometry (MS) at the intact level. This heterodimeric protein, consisting of two subunits (hCGα and hCGβ), possesses 8 potential glycosylation sites leading to a high number of glycoforms and has a molecular weight of about 35 kDa. The HILIC conditions optimized in a first paper but using UV detection were applied here with MS for the analysis of two hCG-based drugs, a recombinant hCG and a hCG isolated from the urine of pregnant women. An Amide column (150 x 2.1 mm, 2.6 µm, 150 Å), a mobile phase composed of acetonitrile and water both containing 0.1% of trifluoroacetic acid and a temperature of 60°C were used. The gradient was from 85 to 40% ACN in 30 min. The use of TFA that had been shown to be necessary for the separation of glycoforms caused, as expected, an ion suppression effect in MS that was partially overcome by increasing the amount of protein injected (2 µL at 1 mg mL-1) and reducing the detection m/z range (from 1500 to 300). These conditions allowed the detection of different glycoforms of hCGα. The performance of the HILIC-HRMS method was compared to that previously obtained in RPLC-HILIC-HRMS in terms of number of detected glycoforms, selectivity, and sensitivity. The complementarity and orthogonality of the HILIC and RP modes for the analysis of hCG at the intact level were demonstrated.
3
1. Introduction
The human Chorionic Gonadotropin (hCG) is an hormone essential for the preservation of the pregnancy and the development of the placenta and fetus [1]. It is a heterodimeric glycoprotein, consisting of an α (hCGα) and a β (hCGβ) subunit. The α-subunit has identical amino acid sequence to the pituitary gonadotropin hormones such as the follicle-stimulating hormone, the thyroid-stimulating hormone, and the luteinizing hormone, containing two N-glycosylation sites [2,3], while the β-subunit represents the specific part of hCG and has 2 N- and 4 O-glycosylation sites [4]. Nowadays, it is well-known that changes in the glycosylation pattern of a protein affect its biological activity and half-life. Therefore, the detection and identification of the numerous hCG glycoforms is essential to be able to use one or several of them as biomarkers [5].
With 8 potential glycosylation sites, hCG is a highly heterogeneous protein and the characterization of all its glycoforms constitutes an important analytical challenge. The analysis of the protein at the intact level by liquid chromatography (LC) or capillary electrophoresis (CE) hyphenated with mass spectrometry (MS) is a fast and easy approach that allows the determination of the glycosylation profile [6]. Recently, we optimized for the first time a CE method hyphenated with MS for the separation of hCG glycoforms [7]. The MS analyzer was a triple quadrupole that was useful for comparing glycosylation profiles but prevented the glycoform identification, which requires a high-resolution (HR) MS. Then, we developed for the first time a LC separation in reversed phase (RP) mode coupled with quadrupole/time-of flight (qTOF) MS for the analysis of hCG at the intact level [8]. This method led to the separation of some α-subunit glycoforms, but did not allow the detection of the hCGβ glycoforms, perhaps due to a higher heterogeneity of hCGβ and/or a less efficient ionization with its potential 2 N- and 4 O-glycans. With regard to selectivity in RPLC, a correlation between the retention time of the hCGα glycoforms and the number of their sialic acids present at the terminal position on the N-glycans antennas was observed. Surprisingly, the retention time of hCGα glycoforms increases with the number of their sialic acids whereas this elution order would be more expected with hydrophilic interaction liquid chromatography (HILIC), which is complementary
4
and orthogonal to RPLC [9,10]. Indeed, the retention mechanism in HILIC is partially based on partitioning of the compounds between a water-enriched layer formed at the surface of the polar stationary phase and the hydro-organic mobile phase when containing a high content of organic solvent. Additional interactions can then occur between the compounds and the stationary phase including hydrogen bonding, ionic, and dipole-dipole interactions [11,12]. The highly organic mobile phase is particularly well adapted to MS detection, leading to an improvements in sensitivity for a large variety of compounds [13]. Therefore, the HILIC mode is nowadays largely used for the analysis of small polar compounds, glycopeptides or N- and O-glycans released from glycoproteins [14–16] and could help to separate the glycoforms of a protein according to their glycan moieties.
For the analysis of glycoproteins at intact level in HILIC, only few studies reported its use [17–24]. Its potential was demonstrated for the analysis of intact neo-glycoproteins obtained after a glycosylation procedure from ribonuclease A, and two antigenic proteins, namely TB10.4 and Ag85B [17–19]. These studies allowed the monitoring of the glycosylation process and glycoprotein stability. More recently, Domínguez-Vega et al. [20] developed , for the first time, a HILIC-HRMS method for assessing the glycosylation pattern of one highly glycosylated protein, erythropoietin having 3 N- and 1 O-glycosylation sites [20]. Although a partial separation was obtained, the qTOF analyzer allowed the identification of 51 glycoforms, in addition to glycoforms with other post-translational modifications such as succinimide, oxidation, and N-terminal methionine-loss products [20].
With regard to hCG, we optimized a HILIC-UV method to separate its glycoforms [25]. Two hCG-based drugs were successfully analyzed using an amide-hCG-based column and a mobile phase containing ACN and water with 0.1% of trifluoroacetic acid (TFA). The resolution obtained made it possible to distinguish the two drugs thanks to their different glycoforms in number and nature. However, the hyphenation with HRMS is mandatory to significantly improve the level of information about the nature of these hCG glycoforms. Therefore, the potential of HILIC-(qTOF) MS for the hCG characterization is here evaluated and compared to the results obtained with RPLC-(qTOF) MS in terms of selectivity, sensitivity, orthogonality, and complementary.
5
2. Materials and methods
2.1. Reagents and analytes
HPLC-grade acetonitrile (ACN) and formic acid (FA) were supplied by Carlo Erba (Val de Reuil, France). TFA was purchased from Sigma-Aldrich (Saint Quentin Fallavier, France). The ultra-pure water was obtained with a Direct-Q3 UV system (Millipore, Molsheim, France). Ovitrelle®(Organon, Oss, The Netherlands) was presented as a solution containing 500 mg L-1 of hCG (recombinant mammalian cell, r-hCG). Pregnyl® (Serono Europe Ltd, London, UK) is a lyophilized powder containing 5,000 IU of hCG isolated from the urine of pregnant women (u-hCG) (1 IU is equivalent to a concentration of 0.092 µg L-1 [26,27]).
The Ovitrelle® solution was reconstituted in 0.5 mL of water to obtain a stock solution containing 500 µg mL-1 of r-hCG. For Pregnyl®, the lyophilized content of each ampoule was dissolved in 1 mL of water to obtain a concentration of 460 µg mL-1. All the solutions were aliquoted and stored at -20°C. Before injection into LC-MS, the hCG aliquots were washed and pre-concentrated to 1 mg mL-1 by centrifugation with ultra-centrifugal units (Merck, Darmstadt, Germany) having a molecular weight cut-off of 10 kDa.
2.2. Instrumentations and columns
2.2.1 HILIC-(qTOF) MS
The HILIC-(qTOF) MS experiments were performed on a bio-compatible 1260 Infinity™ system composed of a quaternary pump, auto-sampler, column oven, and a diode array UV detector (Agilent Technologies, Les Ulis, France) coupled to a MicrOTOF-Q II Mass Spectrometer (Bruker Daltonics, Wissembourg, France) with an electrospray ionization (ESI) source. An Accucore Amide column (150 x 2.1 mm, 2.6 µm, 150 Å) purchased from ThermoFisher (Le Pecq, France) was used. The mobile phase was composed of acetonitrile and water both containing 0.1% TFA. The mobile phase gradient was from 85 to 40% ACN in 30 min, a plateau for 5 min,and a return to the initial composition within
6
1 min and an equilibrium step for 15 min. The column temperature was maintained at 60°C. The injection volume was fixed at 2 µL, the hCG sample was at 1 mg mL-1 in water, and the flow-rate at 0.4 mL min-1. The MS experiments were operated in the positive mode and the mass-detection range was set to m/z 2200-2500. The parameters of the ESI source were as follows: drying gas (N2) flow
rate, 9.0 L min−1, drying gas temperature, 200°C, nebulizing gas pressure, 30 psi, capillary voltage, 4500 V. The system was controlled by the MicroTOF Control Software (Version 3.4, Bruker Daltonics) and the Hystar (Version 3.2, Bruker Daltonics) software was used to interface the HPLC and MS systems. To ensure optimal conditions for the detection, the calibration of the qTOF was performed once a week using cesium clusters (2 g L-1 in water-isopropanol (1:1, v/v)) allowing a mass accuracy of about 10 ppm.
2.2.2 RPLC-(qTOF) MS
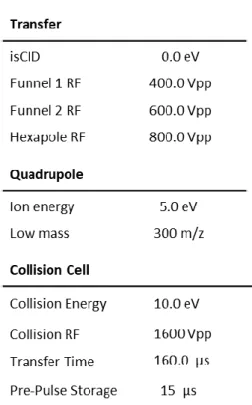
The RPLC-(qTOF) MS method was previously optimized [8]. It was performed on a 1100 LC system (Agilent Technologies) hyphenated to the same (MicroTOF-Q II) MS detector. The RPLC separation was achieved using an Aeris WIDEPORE XB-C18 column (150 x 2.1mm, 200Å) packed with 3.6µm core-shell silica-based particles (Phenomenex, Le Pecq, France). The mobile phase was composed of 0.1% FA in water and ACN. The mobile phase gradient was an increase from 4.5 to 31.5% of ACN in 50 min, a plateau for 5 min,and a return to the initial composition within 1 min and an equilibrium step for 10 min. The column temperature was maintained at 65°C, the injection volume was 5 µL, the hCG sample was at 0.1 mg mL-1 in water, and the flow-rate was set at 0.4 mL min-1. The MS detection was carried out with the same parameters as those used for the HILIC experiments, except for the mass detection range set to m/z 1000-2500. Table S1 lists MS parameters recommended by the manufacturer (Bruker Daltonics) for the analysis of macromolecules (with m/z > 1000) that were used.
7
3. Results and discussions
3.1 HILIC-UV vs HILIC-HRMS
The separation of hCG glycoforms in HILIC-UV was previously optimized, the reliability of the method in terms of retention time and peak area was demonstrated, and its application to two hCG-based drugs showed its potential for fingerprinting approach (see Figure S1 in the supplementary data) [25]. The content and nature of the acidic additive (FA and TFA) and the addition of a volatile salt (ammonium formate) in the mobile phase on the retention and the resolution were studied. It was observed that TFA, an ion-pairing agent, was mandatory to obtain a high number of peaks and led to a nice separation. It is worthwhile to notice that only reagents compatible with MS were investigated since, for identification purposes, the hyphenation with HRMS detection is required and this is the objective of this work. The best HILIC separation was obtained with an amide-based stationary phase and a mobile phase composed of water/ACN containing 0.1% of TFA. However, no peaks were observed in MS using these conditions and a m/z range of 1000-2500, as we did it in RPLC-MS [8]. This may be due to the presence of TFA in the mobile phase, which induced a dramatic decrease in the MS signal, but our previous study showed that TFA was essential to achieve a good HILIC separation of hCG glycoforms. In addition, TFA has a stabilizing effect on protein species in highly organic solutions and is considered as a good solubilizing agent at low concentrations (e.g. ∼0.1%) [28]. Therefore, a compromise between LC resolution/protein solubilization and MS sensitivity was done.
To overcome this detection problem, two modifications were considered. First, the injected amount of hCG was increased by increasing the injection volume, because the hCG concentration was already high (1 mg mL-1). In our previous study with UV detection [25], the hCG-based drug samples were dissolved in water and an injection volume of 1 µL was used. Even if a water- based sample is not favorable in HILIC, as a partial precipitation of hCG was observed with an ACN content higher than 30%, a fully aqueous sample was maintained and the injection volume was increased to 2 µL. Secondly, the detection mass range was reduced in order to increase the MS signal intensity, even if
8
only a single charge state of the glycoforms was observed instead of three generally. Therefore, different small m/z ranges of 300 instead of 1500 were tested and it was observed that the m/z range between 2200 and 2500 gave the best signal intensities.
With these conditions, the resulting base peak chromatogram (BPC) is presented in Figure 1A analyzing the recombinant hCG-based drug sample (r-hCG).
Figure 1: (A) BPC and (B) average MS spectrum between 19.8 and 21.8 min (see arrow) obtained by HILIC-HRMS for r-hCG. Mobile phase: 0.1% TFA in H2O/ACN. Gradient: 85-40% of ACN with a slope of
1.5% min-1. Mass range: 2200-2500 m/z, full scan-positive mode. Temperature: 60°C. r-hCG samples:
1.0 mg mL-1 prepared in water. Injected volume: 2 µL. Flow: 0.4 mL min1.
The presence of 6 peaks between 19.8 and 21.8 min is observed. It is much less than what was obtained in UV with the same conditions of separation, where at least 10 peaks along 3 elution zones (19.8-21.8, 21.8-23.4, and 23.4-25.2 min) were observed [25]. In HILIC-MS, the first zone corresponds to the same first elution zone observed in HILIC-UV, but no peaks were detected in the last two elution zones. Two explanations can be proposed. First, the detection mass range used (m/z 2200– 2500) may not be suitable for the detection of glycoforms present in the second and third elution zones. Therefore, different mass ranges were then tested (m/z 100-800, m/z 800-1500 and, m/z 1500-2200), but no peaks were detected. Secondly, these glycoforms are difficult to ionize, which may be due to a high content of glycans and/or the presence of TFA in the mobile phase. Regarding
9
the detected peaks in MS, the average spectrum between 19.8 and 21.8 min on the BPC (see arrow Figure 1A) is presented in Figure 1B. As expected, the mass range used (m/z 2200-2500) enabled to detect m/z values corresponding to hCG glycoforms with a charge state (z) equal to 6 for all peaks. However, the observation of a single charge state does not allow the application of a conventional deconvolution method for the determination of glycoform mass values requiring 3 charge states. In conclusion, the applicability of the HILIC-MS method for the analysis of intact hCG is not trivial. Indeed, the presence of TFA, essential to separate the hCG glycoforms as previously demonstrated [25], leads to a very low ionization of glycoforms in MS and thus to a dramatic loss of information on glycoforms present in the last two elution zones which are detected in UV. Nevertheless, the HILIC-HRMS method gave some m/z values corresponding to several hCG glycoforms in the first elution zone. In order to evaluate the potential of HILIC for hCG characterization, the number of detected glycoforms and the sensitivity of the analysis were then compared to the values obtained by RPLC-HRMS [8].
3.2 Comparison of RPLC and HILIC
The RPLC-HRMS analysis of r-hCG led to about 12 chromatographic peaks (see Figure S2A in the supplementary data) [8].At least three charge states were observed (z = 9, z = 8, and z = 7) with m/z values between 1300 and 2200 on the average MS spectrum (Figure S2B) obtained between 28.5 and 32.5 min on the BPC (see arrow Figure S2A). After deconvolution, these peaks were assigned to glycoforms of the α-subunit and no glycoforms of the β-subunit were detected [8].
The sensitivity between HILIC- and RPLC-HRMS was first compared and it is worthwhile to notice that the qTOF system, r-hCG provider, and LC columns dimensions were the same. In addition, based on the hypothesis that 1 nmole corresponds to 35 μg of hCG (MW≈35 kDa), a quantity of 56.8 pmole was injected in HILIC-HRMS (2 µL at 1 mg mL-1), instead of 14.2 pmole in RPLC-HRMS method (5 µL at 100 µg mL-1). With these conditions, the signal intensity observed on the BPC for the HILIC separation (Figure 1A, approx. 3.0E103) is 10 times less intense than for the RPLC mode (Figure S2A, approx.
10
3.0E104). Therefore, the RPLC-HRMS method appears to be 40 times more sensitive than the HILIC-HRMS method, despite a larger mass range of detection (m/z 1000-2500 in RPLC-HILIC-HRMS instead of m/z 2200-2500 in HILIC-HRMS), which clearly demonstrates a dramatic decrease in the sensitivity of the HILIC-HRMS method compared to RPLC-HRMS. As mentioned above, this high sensitivity difference is mainly due to the presence of TFA in HILIC that was required to obtain a high resolution LC separation.
The complementarity of RPLC and HILIC modes was next studied. All the peaks observed on the spectrum obtained in HILIC-HRMS between m/z 2200 and 2500 (Figure 1B)were selected and their eXctracted Ion Chromatograms (XIC) were plotted (Figure 2A).
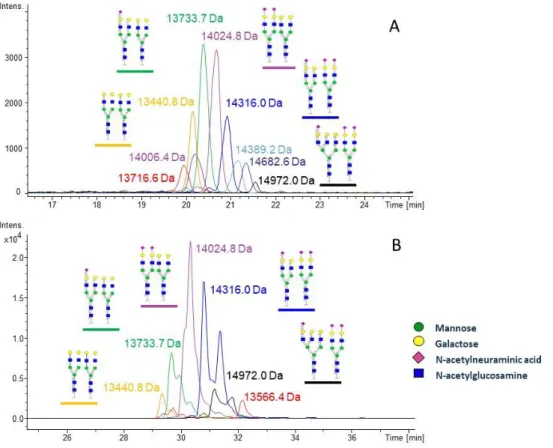
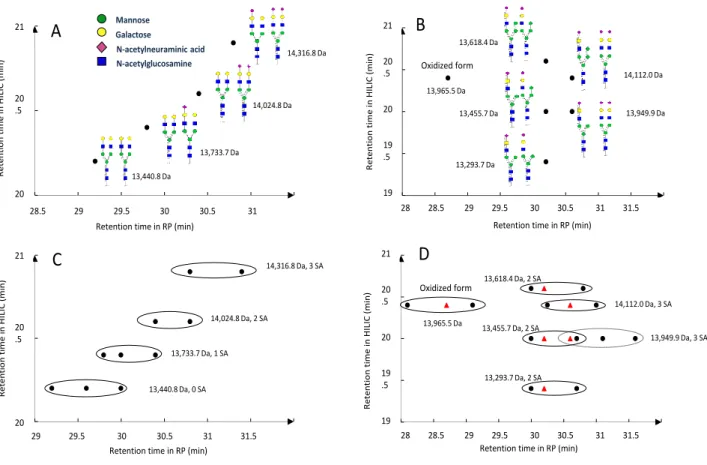
Figure 2: XICs of hCG glycoforms with N-glycan structures obtained with the analysis of r-hCG by (A) HILIC-HRMS or (B) RPLC-HRMS. Conditions: see experimental section.
11
The absolute mass values, calculated according to a charge state of z=6, are reported. The XIC chromatograms were also plotted for all the peaks observed on the spectrum obtained in RPLC between m/z 1700 and 1900 (z=8) (Figure S2B). They are presented in Figure 2B. First, it is worthwhile to notice the presence of several not resolved peaks associated with a given mass in RPLC (e.g. 14,316.0 Da, Figure 2B), while there is only one peak for a given mass in HILIC (Figures 2A). Although it is difficult to conclude at this stage, two hypotheses will be discussed later.
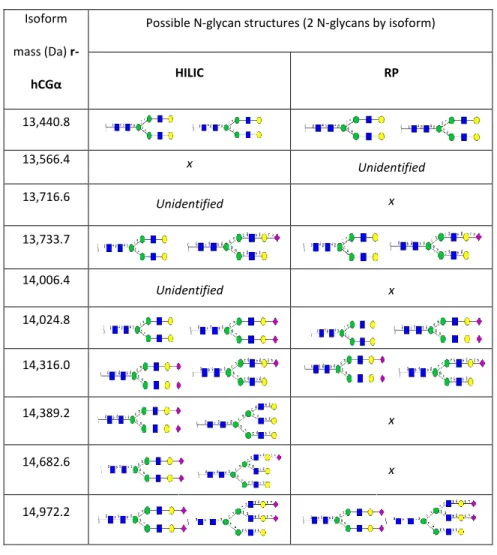
When comparing Figures 2A and 2B, it is interesting to note that 5 glycoforms with masses of 13,440.8, 13,733.7, 14,024.8, 14,316.0, and 14,972.0 Da were detected with both methods. These hCGα glycoforms were previously identified during the RPLC-HRMS study [8] and their glycan structures are represented in Figures 2A and 2B. These hCGα glycoforms contain sialylated N-glycans with two antennas, except for one form (14,972.0 Da) having an N-glycan with three antennas. Table 1 shows all the hCGα glycoforms detected during the analysis of r-hCG by HILIC- and RPLC-HRMS. In HILIC, even if one glycoform (13,566.4 Da) was not observed, 4 were detected in addition to RPLC (13,716.6, 14,006.4, 14,389.2, and, 14,682.6 Da) and 2 out of 4 were identified (a x means that no peak was detected corresponding to its isoform and unidentified that a peak was present on the spectrum but the N-glycans structures were not identified). They contain 2 N-glycans with 2 and 3 antennas. A mass difference corresponding to an N-acetylneuraminic acid was observed between some of them (291Da between 13,716.6 and 14,006.4 and between 14,389.2 and 14,682.6). It can be noticed that a higher number of glycoforms composed of N-glycans with 3 antennas are detected in HILIC- than in RPLC-HRMS (3 in HILIC vs 1 in RPLC). These results demonstrate the complementarity of both separation modes.
12
Table 1: List of absolute mass values and N-glycan structures of the α-subunit glycoforms of r-hCG analyzed by HILIC- or RPLC-HRMS. x: no peaks corresponding to its isoform. Unidentified: a peak is present on the spectrum but the N-glycans structures were not identified. Green circle: mannose; yellow circle: galactose; pink diamond: N-acetylneuraminic acid; blue square: N-acetylglucosamine.
To confirm this complementarity, a second hCG-based drug prepared from urines of pregnant women, u-hCG, was then analyzed by HILIC-HRMS, as it was already carried out by RPLC-HRMS [8]. The resulting BPCs showed in both cases at least 10 peaks with retention times between 19.1 and 20.8min in HILIC (Figure 3A) and between 28.5 and 32.5min in RPLC (Figure 3B). As for r-hCG, a decrease in sensitivity was observed in HILIC-HRMS compared to RPLC-HRMS. For all the peaks
Isoform mass (Da)
r-hCGα
Possible N-glycan structures (2 N-glycans by isoform)
HILIC RP 13,440.8 13,566.4 x Unidentified 13,716.6 Unidentified x 13,733.7 14,006.4 Unidentified x 14,024.8 14,316.0 14,389.2 x 14,682.6 x 14,972.2
13
detected on the mass spectrum, the XICs were plotted for each absolute mass value and the glycan structures are presented in Figures 3C and 3D for HILIC and RPLC, respectively.
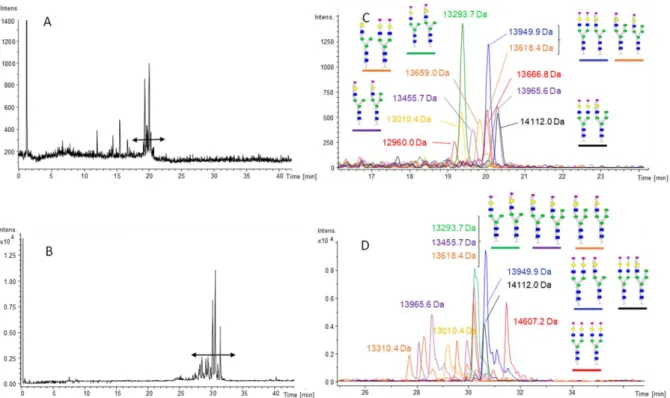
Figure 3: BPCs of u-hCG analyzed by (A) HILIC-HRMS or (B) RPLC-HRMS and XICs of the hCG glycoforms with their N-glycan structures of u-hCG analyzed by (C) HILIC-HRMS or (D) RPLC-HRMS. Conditions: see experimental section.
Table 2 presents the glycoforms detected with both methods. Seven glycoforms of hCGα were detected in both modes. They are composed of sialylated N-glycans with 1 or/and 2 antennas except for 1 glycoform (13,010.4Da) which was not identified. Furthermore, 3 additional hCGα glycoforms were detected in HILIC: 12,960.0, 13,659.0, and 13,666.8Da. Regarding the glycoform with a mass value of 13,659.0Da, the N-glycan structures can be proposed thanks to a mass difference of 291Da with another already identified glycoform (13,949.9Da). Unfortunately, the two other hCGα glycoforms were not identified. In RPLC, 2 glycoforms were detected in addition to HILIC: one
14
oxidized form (13,310.4Da) and one with 2 sialylated N-glycans with 2 antennas (Table 2). These results confirm again the complementary of both modes for the identification of hCGα glycoforms.
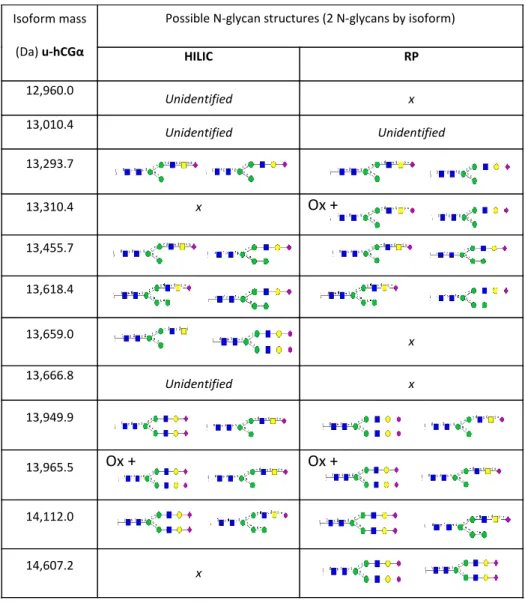
Table 2: List of absolute mass values and N-glycan structures of the α-subunit glycoforms of u-hCG analyzed by HILIC- or RPLC-HRMS. Ox: Oxidized isoforms. x: no peaks corresponding to its isoform. Unidentified: a peak is present on the spectrum but the N-glycans stcutures were not identified. Green circle: mannose; yellow circle: galactose; pink diamond: N-acetylneuraminic acid; blue square: N-acetylglucosamine.
Isoform mass (Da) u-hCGα
Possible N-glycan structures (2 N-glycans by isoform)
HILIC RP 12,960.0 Unidentified x 13,010.4 Unidentified Unidentified 13,293.7 13,310.4 x Ox + 13,455.7 13,618.4 13,659.0 x 13,666.8 Unidentified x 13,949.9 13,965.5 Ox + Ox + 14,112.0 14,607.2 x
15
In Tables 1 and 2, it appears that a higher number of hCGα glycoforms was detected in HILIC compared to RPLC for both drugs: 10 and 10 vs 6 and 9 for r- and u-hCG, respectively. As it was already concluded after analyzing both drugs in RPLC [8], despite the additional glycoforms detected in HILIC, none are common to both drugs. As an example, no hCGα glycoforms with 3 antennas were observed for u-hCG but some with a very large number of hybrid glycans. This confirms the strong difference in the glycosylation patterns of the 2 drugs previously mentioned [8].
Finally, the orthogonality of the HILIC and RPLC separation modes was investigated. Figure 4A presents the retention time in HILIC as a function of the retention time in RPLC for the most intense peak of the 4 identified hCGα glycoforms of r-hCG having N-glycans each with 2 antennas. It appears that the number of terminal sialic acids present on this type of glycoform contributes significantly to an increase in its retention time in both modes, which could indicate a poor orthogonality of these methods for the r-hCG characterization. A similar representation was done with the glycoforms identified during the analysis of u-hCG with both methods (Figure 4B). According to Tables 1 and 2, the structures of the corresponding N-glycans are different for u-hCG since at least one out of the four antennas is based on mannose. It appears here that the elution order in HILIC does not seem to be related to the number of sialic acids of the glycoforms. In this case, some glycoforms vary only in the number of mannose sugars they contain, such as 13,293.7, 13,455.7, and 13,618.4 Da having 6, 7, and 8 mannose sugars, respectively. They co-elute in RPLC but not in HILIC. Looking at glycoforms with similar glycan structures but where a mannose has been replaced by an antenna (one N-acetylglucosamine plus one galactose plus one N-acetylneuraminic acid) on one of the two N-glycans, such as the glycoforms of 13,455.7 and 13,949.9Da, respectively, they co-elute in HILIC but not in RPLC. This clearly demonstrates that HILIC and RPLC are orthogonal separation modes for the separation of u-hCG glycoforms, which have a more heterogeneous composition than r-hCG glycoforms.
As seen previously, it is also important to notice the presence of several peaks associated with a given mass in RPLC for both drugs (see Figure 2B and 3D), while there is only one peak for a given
16
mass in HILIC (Figures 2A and 3C). This difference between both modes clearly appears also in Figures 4C and 4D, where all peaks for one mass were plotted for r- and u-hCG, respectively. Two explanations can be proposed. First, the different peaks could correspond to different isomers varying by the localization of the sialic acids on the ends of glycans. However, this hypothesis cannot be retained because several peaks were also observed for non-sialylated glycoforms, having a mass value of 13440.8 Da, as shown in Figure 2B.
Figure 4: Retention times in HILIC as a function of retention times in RPLC for the common hCGα glycoforms of r-hCG (A, C) and u-hCG (B, D). (A, B) Only the retention time of the most intense peak for each mass value was selected. (C, D) The retention times of all the peaks of a given mass value were selected. The absolute mass of each isoform and its number of sialic acid (SA) are given. In D, a red triangle corresponds to the most intense peak for a given mass value.
13,293.7 Da, 2 SA 13,949.9 Da, 3 SA 19 19,5 20 20,5 21 28 28,5 29 29,5 30 30,5 31 31,5 32 R e te n ti o n ti me i n H IL IC (min )
Retention time in RP (min)
13,965.5 Da 13,618.4 Da, 2 SA 14,112.0 Da, 3 SA 13,455.7 Da, 2 SA 19 19,5 20 20,5 21 28 28,5 29 29,5 30 30,5 31 31,5 32 R e te n ti o n ti me i n H IL IC (min )
Retention time in RP (min) Oxidized form 13,965.5 Da
B
D
Oxidized form 20 20,5 21 29 29,5 30 30,5 31 31,5 32 R e te n ti o n ti me i n H IL IC (min )Retention time in RP (min)
13,440.8 Da, 0 SA 13,733.7 Da, 1 SA 14,024.8 Da, 2 SA 14,316.8 Da, 3 SA
A
20 20,5 21 28,5 29 29,5 30 30,5 31 31,5 R e te n ti o n ti me i n H IL IC (min )Retention time in RP (min)
C
28 28.5 29 29.5 30 30.5 31 31.5 28 28.5 29 29.5 30 30.5 31 31.5 21 20 .5 20 21 20 .5 20 21 20 .5 20 19 .5 19 28.5 29 29.5 30 30.5 31 29 29.5 30 30.5 31 31.5 21 20 .5 20 19 .5 19 13,440.8 Da 13,733.7 Da 14,024.8 Da 14,316.8 Da 14,112.0 Da 13,949.9 Da 13,293.7 Da 13,455.7 Da 13,618.4 Da Mannose Galactose N-acetylneuraminic acid N-acetylglucosamine17
Secondly, the main differences between RPLC and HILIC are the presence of 0.1% TFA in the HILIC mobile phase instead of formic acid in RPLC and the nature of the stationary phase. Indeed, the injection solvent (H2O), the flow rate (0.4 mL min-1), and the H2O/ACN-based mobile phase are the
same. Even the column temperature was almost identical (65°C instead 60°C). It was already observed that TFA can induce the dissociation of the two subunits of hCG, since they are not covalently linked [4]. Therefore, it could be assumed that the TFA present in the HILIC mobile phase leads to the dissociation of the two subunits during their analysis, giving different retention times for the α- and β-subunits. This is in agreement with experimental results. Indeed, as observed above, the elution zone observed in HILIC-HRMS corresponds to glycoforms of the α-subunit and the two other elution zones observed in our previous experiments in HILIC-UV that are not detected in HILIC-HRMS could correspond to glycoforms of the β-subunit [8]. Unfortunately, it was impossible to confirm this hypothesis with UV detection and the too low MS signal intensity, due to the presence of TFA and the difficulty to ionize highly glycosylated glycoforms of the β-subunit that have potentially 2 N- and 4 O-glycans and should be therefore also more heterogeneous. In RPLC-HRMS, the absence of TFA in the mobile phase and the observation of different chromatographic peaks for one single mass of hCGα could be explained by the fact that the dimeric form of hCG is preserved during the separation. One single hCGα glycoform, which can be more easily ionized with only two N-glycosylation sites, could be associated with different hCGβ glycoforms, which are not well ionized and consequently not detected in MS [8]. However, it is still not possible to conclude at this stage of the hCG study.
4. Conclusion and perspectives
For the first time, a HILIC-HRMS method for the characterization of the highly glycosylated hCG protein at the intact level was developed. Despite the presence of TFA in the mobile phase, which affects the performance of the MS detection while favoring the separation resolution, the HILIC-HRMS method allowed the identification of different hCGα glycoforms in 2 hCG-based drugs. HILIC allowed the detection of a slightly higher number of hCGα isoforms than RPLC. However, both are
18
complementary because some isoforms were only detected in RPLC or HILIC and, even more so, they are orthogonal. Several perspectives can be considered, such as improving sensitivity in HILIC-HRMS or developing two-dimensional approaches coupling HILIC in the first dimension and RPLC in the second.
19
References
[1] L.A. Cole, hCG physiology, Placenta. 34 (2013) 1257. https://doi.org/10.1016/j.placenta.2013.02.011. [2] M.J. Kessler, T. Mise, R.D. Ghai, O.P. Bahl, Structure and location of the O-glycosidic carbohydrate units
of human chorionic gonadotropin, J. Biol. Chem. 254 (1979) 7909–7914.
[3] L. Liu, D. Leaman, M. Villalta, R.M. Roberts, Silencing of the gene for the alpha-subunit of human chorionic gonadotropin by the embryonic transcription factor Oct-3/4, Mol. Endocrinol. Baltim. Md. 11 (1997) 1651–1658. https://doi.org/10.1210/mend.11.11.9971.
[4] C. Liu, L.D. Bowers, Mass spectrometric characterization of the beta-subunit of human chorionic gonadotropin, J. Mass Spectrom. JMS. 32 (1997) 33–42. https://doi.org/10.1002/(SICI)1096-9888(199701)32:1<33::AID-JMS446>3.0.CO;2-X.
[5] J. Guibourdenche, K. Handschuh, V. Tsatsaris, P. Gerbaud, M.C. Leguy, F. Muller, D. Evain Brion, T. Fournier, Hyperglycosylated hCG Is a Marker of Early Human Trophoblast Invasion, J. Clin. Endocrinol. Metab. 95 (2010) E240–E244. https://doi.org/10.1210/jc.2010-0138.
[6] J. Camperi, V. Pichon, N. Delaunay, Separation Methods hyphenated to Mass Spectrometry for the Characterization of the Protein Glycosylation at the Intact Level, J. Pharm. Biomed. Anal. (2019) 112921. https://doi.org/10.1016/j.jpba.2019.112921.
[7] J. Camperi, B. De Cock, V. Pichon, A. Combes, J. Guibourdenche, T. Fournier, Y. Vander Heyden, D. Mangelings, N. Delaunay, First characterizations by capillary electrophoresis of human Chorionic Gonadotropin at the intact level, Talanta. 193 (2019) 77–86.
https://doi.org/10.1016/j.talanta.2018.09.095.
[8] J. Camperi, A. Combes, J. Guibourdenche, D. Guillarme, V. Pichon, T. Fournier, N. Delaunay, An attempt to characterize the human Chorionic Gonadotropin protein by reversed phase liquid chromatography coupled with high-resolution mass spectrometry at the intact level, J. Pharm. Biomed. Anal. (2018). https://doi.org/10.1016/j.jpba.2018.07.056.
[9] A. Periat, S. Fekete, A. Cusumano, J.-L. Veuthey, A. Beck, M. Lauber, D. Guillarme, Potential of hydrophilic interaction chromatography for the analytical characterization of protein biopharmaceuticals, J.
Chromatogr. A. 1448 (2016) 81–92. https://doi.org/10.1016/j.chroma.2016.04.056.
[10] T. Tetaz, S. Detzner, A. Friedlein, B. Molitor, J.-L. Mary, Hydrophilic interaction chromatography of intact, soluble proteins, J. Chromatogr. A. 1218 (2011) 5892–5896.
https://doi.org/10.1016/j.chroma.2010.09.027.
[11] B. Buszewski, S. Noga, Hydrophilic interaction liquid chromatography (HILIC)—a powerful separation technique, Anal. Bioanal. Chem. 402 (2012) 231–247. https://doi.org/10.1007/s00216-011-5308-5. [12] M.R. Gama, R.G. da Costa Silva, C.H. Collins, C.B.G. Bottoli, Hydrophilic interaction chromatography, TrAC
Trends Anal. Chem. 37 (2012) 48–60. https://doi.org/10.1016/j.trac.2012.03.009.
[13] H.P. Nguyen, K.A. Schug, The advantages of ESI-MS detection in conjunction with HILIC mode separations: Fundamentals and applications, J. Sep. Sci. 31 (2008) 1465–1480.
https://doi.org/10.1002/jssc.200700630.
[14] Y. Mechref, D.C. Muddiman, Recent advances in glycomics, glycoproteomics and allied topics, Anal. Bioanal. Chem. 409 (2017) 355–357. https://doi.org/10.1007/s00216-016-0093-9.
[15] J. Bones, S. Mittermayr, N. O’Donoghue, A. Guttman, P.M. Rudd, Ultra Performance Liquid
Chromatographic Profiling of Serum N -Glycans for Fast and Efficient Identification of Cancer Associated Alterations in Glycosylation, Anal. Chem. 82 (2010) 10208–10215. https://doi.org/10.1021/ac102860w. [16] Y. Takegawa, K. Deguchi, H. Ito, T. Keira, H. Nakagawa, S.-I. Nishimura, Simple separation of isomeric
sialylated N-glycopeptides by a zwitterionic type of hydrophilic interaction chromatography, J. Sep. Sci. 29 (2006) 2533–2540. https://doi.org/10.1002/jssc.200600133.
[17] F. Rinaldi, S. Tengattini, E. Calleri, T. Bavaro, L. Piubelli, L. Pollegioni, G. Massolini, C. Temporini, Application of a rapid HILIC-UV method for synthesis optimization and stability studies of immunogenic neo -glycoconjugates, J. Pharm. Biomed. Anal. 144 (2017) 252–262.
https://doi.org/10.1016/j.jpba.2017.03.052.
[18] S. Tengattini, E. Domínguez-Vega, C. Temporini, T. Bavaro, F. Rinaldi, L. Piubelli, L. Pollegioni, G.
Massolini, G.W. Somsen, Hydrophilic interaction liquid chromatography-mass spectrometry as a new tool for the characterization of intact semi-synthetic glycoproteins, Anal. Chim. Acta. 981 (2017) 94–105. https://doi.org/10.1016/j.aca.2017.05.020.
20
[19] A. Pedrali, S. Tengattini, G. Marrubini, T. Bavaro, P. Hemström, G. Massolini, M. Terreni, C. Temporini, Characterization of Intact Neo-Glycoproteins by Hydrophilic Interaction Liquid Chromatography, Molecules. 19 (2014) 9070–9088. https://doi.org/10.3390/molecules19079070.
[20] E. Domínguez-Vega, S. Tengattini, C. Peintner, J. van Angeren, C. Temporini, R. Haselberg, G. Massolini, G.W. Somsen, High-resolution glycoform profiling of intact therapeutic proteins by hydrophilic
interaction chromatography-mass spectrometry, Talanta. 184 (2018) 375–381. https://doi.org/10.1016/j.talanta.2018.03.015.
[21] Z. Zhang, Z. Wu, M.J. Wirth, Polyacrylamide brush layer for hydrophilic interaction liquid chromatography of intact glycoproteins, J. Chromatogr. A. 1301 (2013) 156–161.
https://doi.org/10.1016/j.chroma.2013.05.076.
[22] G. van Schaick, B.W.J. Pirok, R. Haselberg, G.W. Somsen, A.F.G. Gargano, Computer-aided gradient optimization of hydrophilic interaction liquid chromatographic separations of intact proteins and protein glycoforms, J. Chromatogr. A. 1598 (2019) 67–76. https://doi.org/10.1016/j.chroma.2019.03.038. [23] A.F.G. Gargano, O. Schouten, G. van Schaick, L.S. Roca, J.H. van den Berg-Verleg, R. Haselberg, M.
Akeroyd, N. Abello, G.W. Somsen, Profiling of a high mannose-type N-glycosylated lipase using hydrophilic interaction chromatography-mass spectrometry, Anal. Chim. Acta. 1109 (2020) 69–77. https://doi.org/10.1016/j.aca.2020.02.042.
[24] A.F.G. Gargano, L.S. Roca, R.T. Fellers, M. Bocxe, E. Domínguez-Vega, G.W. Somsen, Capillary HILIC-MS: A New Tool for Sensitive Top-Down Proteomics, Anal. Chem. 90 (2018) 6601–6609.
https://doi.org/10.1021/acs.analchem.8b00382.
[25] J. Camperi, V. Pichon, T. Fournier, N. Delaunay, First profiling in hydrophilic interaction liquid
chromatography of intact human chorionic gonadotropin isoforms, J. Pharm. Biomed. Anal. 174 (2019) 495–499. https://doi.org/10.1016/j.jpba.2019.06.014.
[26] P. Berger, A.J. Lapthorn, The molecular relationship between antigenic domains and epitopes on hCG, Mol. Immunol. 76 (2016) 134–145. https://doi.org/10.1016/j.molimm.2016.06.015.
[27] P. Berger, C. Sturgeon, J.M. Bidart, E. Paus, R. Gerth, M. Niang, A. Bristow, S. Birken, U.H. Stenman, The ISOBM TD-7 Workshop on hCG and related molecules. Towards user-oriented standardization of pregnancy and tumor diagnosis: assignment of epitopes to the three-dimensional structure of diagnostically and commercially relevant monoclonal antibodies directed against human chorionic gonadotropin and derivatives, Tumour Biol. J. Int. Soc. Oncodevelopmental Biol. Med. 23 (2002) 1–38. https://doi.org/48686.
[28] B. Bobály, V. D’Atri, A. Beck, D. Guillarme, S. Fekete, Analysis of recombinant monoclonal antibodies in hydrophilic interaction chromatography: A generic method development approach, J. Pharm. Biomed. Anal. 145 (2017) 24–32. https://doi.org/10.1016/j.jpba.2017.06.016.
21
Supplementary data
Figure S1: Overlaid chromatograms of the (a) u-hCG and (b) r-hCG for the first elution zone (19.0-21.8 min) obtained by HILIC-UV. Mobile phase: 0.1% TFA in H2O/ACN mixture (v/v). Gradient: from 85 to
40% of ACN with a slope of 1.5% min-1. r- and u-hCG: 1 mg mL-1 in water. Temperature: 60°C. UV detection at 214 nm.
Figure S2: (A) BPC and (B) average MS spectrum between 28.5 and 32.5min (see arrow) with the different charge states obtained by RPLC-HRMS for r-hCG. Mobile phase: 0.1% FA in H2O/ACN.
Gradient: 4.5-31.5% of ACN with a slope of 0.5% min-1. Mass range: 1000-2500 m/z, full scan-positive mode. Temperature: 65°C. r-hCG (100 µg mL-1) in water. Injected volume: 5 µL. Flow: 0.4 mL min-1.
19 19,5 20 20,5 21 21,5 22
a)
b)
22
Table S1: MS parameters recommended by the manufacturer (Bruker Daltonics) for the analysis of macromolecules (with m/z > 1000) and used for the analysis in RPLC-(qTOF) MS.