HAL Id: hal-02886368
https://hal.sorbonne-universite.fr/hal-02886368
Submitted on 1 Jul 2020
HAL is a multi-disciplinary open access
archive for the deposit and dissemination of sci-entific research documents, whether they are pub-lished or not. The documents may come from teaching and research institutions in France or abroad, or from public or private research centers.
L’archive ouverte pluridisciplinaire HAL, est destinée au dépôt et à la diffusion de documents scientifiques de niveau recherche, publiés ou non, émanant des établissements d’enseignement et de recherche français ou étrangers, des laboratoires publics ou privés.
With Serological Response in Human Immunodeficiency
Virus–Hepatitis B Coinfection
Lorenza Dezanet, Sarah Maylin, Audrey Gabassi, Hayette Rougier, Patrick
Miailhes, Caroline Lascoux-Combe, Julie Chas, Pierre-Marie Girard,
Constance Delaugerre, Karine Lacombe, et al.
To cite this version:
Lorenza Dezanet, Sarah Maylin, Audrey Gabassi, Hayette Rougier, Patrick Miailhes, et al.. Kinetics of Hepatitis B Core–Related Antigen and Anti–Hepatitis B Core Antibody and Their Association With Serological Response in Human Immunodeficiency Virus–Hepatitis B Coinfection. Journal of Infec-tious Diseases, Oxford University Press (OUP), 2020, 221 (11), pp.1826-1837. �10.1093/infdis/jiaa013�. �hal-02886368�
Kinetics of hepatitis B core-related antigen and anti-hepatitis B core antibody and their association
1
with serological response in HIV-hepatitis B co-infection
2
3
Running head: Novel biomarkers in HBV-HIV co-infection
4
5
Lorenza N. C. Dezanet1, Sarah Maylin2, Audrey Gabassi2, Hayette Rougier3, Patrick Miailhes4, Caroline
6
Lascoux-Combe5, Julie Chas6, Pierre-Marie Girard7, Constance Delaugerre2, Karine Lacombe1,7, Anders
7
Boyd1,78
9
Institutional affiliations:10
1Sorbonne Université, INSERM, Institut Pierre Louis d'Épidémiologie et de Santé Publique, IPLESP,
11
F75012, Paris, France
12
2APHP, Hôpital Saint-Louis, Laboratoire de Virologie, Paris, France; Université de Paris, INSERM U944,
13
Institut de Recherche Saint-Louis, F75010, Paris, France
14
3IMEA, Institut de Médecine et d’Epidémiologie Appliquée, Paris, F75018, France
15
4Hôpital de la Croix-Rousse, Hospices Civils de Lyon, Service de Maladies Infectieuses, Lyon, F69317,
16
France
17
5APHP, Hôpital Saint-Louis, Service de Maladies Infectieuses, Paris, F75010, France
18
6APHP, Hôpital Tenon, Service de Maladies Infectieuses, Paris, F75020, France
19
7APHP, Hôpital Saint-Antoine, Service de Maladies Infectieuses et Tropicales, Paris, F75012, France
20
21
Main point:
22
Serum quantification of Hepatitis B core-related antigen and anti-Hepatitis B core antibodies could
23
be useful in predicting HBeAg-seroclearance in HIV-HBV co-infected patients undergoing long-term
TDF-containing ART. Nevertheless, we emphasize that their performance is not better than other,
25
currently available markers.
26
27
Corresponding author:28
Dr. Anders Boyd29
Services de Maladies Infectieuses et Tropicales, Hôpital Saint-Antoine
30
184 Rue du Faubourg St. Antoine, 75571 Paris Cedex 12, France
31
Tel: +33 1 71 97 05 1732
Fax: +33 1 49 28 21 4933
Email: [email protected]34
35
Alternate corresponding author:
36
Prof. Karine Lacombe
37
Services de Maladies Infectieuses et Tropicales, Hôpital Saint-Antoine
38
184 Rue du Faubourg St. Antoine, 75571 Paris Cedex 12, France
39
Tel : +33 1 49 28 31 9640
Fax: +33 1 49 28 21 4941
Email : [email protected]42
43
Word count: Abstract – 199; Text – 3438
44
Abstract
45
Background: To describe the kinetics of hepatitis B core-related antigen (qHBcrAg) and anti-hepatitis
46
B core antibody (qAnti-HBc) during tenofovir (TDF)-treatment and assess their ability to predict
47
HBeAg-seroclearance in patients co-infected with HIV and hepatitis B virus (HBV).
48
Methods: Serum qHBcrAg, qAnti-HBc and HBV-DNA were obtained at TDF-initiation and every 6-12
49
months. On-treatment kinetics of qHBcrAg (ΔqHBcrAg) and qAnti-HBc (ΔqAnti-HBc) were estimated
50
using mixed-effect linear regression. Hazard ratios (HR) assessing the association between markers
51
and HBeAg-seroclearance were calculated using proportional hazards regression and sensitivity (Se)
52
and specificity (Sp) of marker levels in predicting HBeAg-seroclearance were assessed using
time-53
dependent ROC curves.
54
Results: During a median 4.6 years, cumulative incidence of HBsAg-seroclearance and
HBeAg-55
seroclearance were 3.2% (n=5/158) and 27.4% (n=26/95), respectively. ΔqHBcrAg was biphasic in
56
HBeAg-positive (-0.051 and -0.011 log10U/mL/month during <18 months and >18 months,
57
respectively) and monophasic in HBeAg-negative patients. ΔqAnti-HBc was monophasic regardless of
58
HBeAg-status. In HBeAg-positive patients, baseline qHBcrAg and qAnti-HBc levels were associated
59
with HBeAg-seroclearance (adjusted-HR=0.48/log10U/mL; 95%CI=0.33-0.70 and
unadjusted-60
HR=1.49/log10PEIU/mL; 95%CI=1.08-2.07, respectively). Cutoffs with the highest accuracy in
61
predicting HBeAg-seroclearance at 36 months were qHBcrAg<6.5 log10U/mL at month-24
62
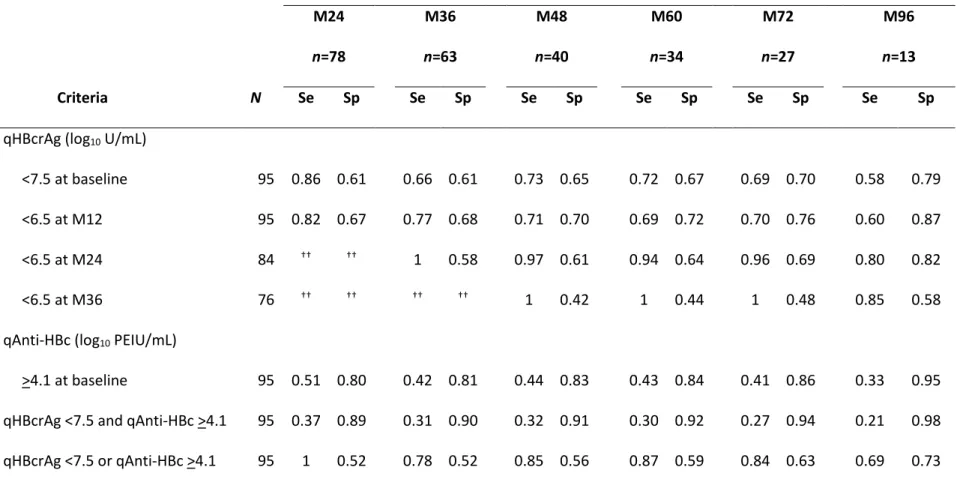
(Se=1/Sp=0.58) and baseline qAnti-HBc>4.1 log10PEIU/mL (Se=0.42/Sp=0.81).
63
Conclusions: In co-infected patients undergoing TDF, qHBcrAg/qAnti-HBc could be of use in
64
monitoring HBeAg-seroclearance.
65
66
Key words: hepatitis B; HIV; seroclearance; hepatitis B core-related antigen; anti-hepatitis B core
67
antibody.
Background
69
70
In HIV-positive individuals, it was recently estimated that 7.4% worldwide were co-infected
71
with chronic hepatitis B virus (HBV) [1]. HIV-HBV co-infection has been associated with
72
increased risk of liver cirrhosis, hepatocellular carcinoma, and hepatic decompensation
73
particularly when HBV replication is left uncontrolled [2,3]. Tenofovir (TDF)-containing
74
antiretroviral therapy (ART) effectively provides dual activity against HIV and HBV in
co-75
infected patients, allowing suppression of HBV replication [4]. Wide-spread TDF use in
co-76
infected patients has led to substantial decreases in HBV-DNA detection, with almost 85% of
77
patients able to achieve undetectable HBV-DNA [5].
78
79
In HBV mono-infected patients, the viral markers indicating improved prognosis are
80
suppression of HBV-DNA, hepatitis B “e” antigen (HBeAg) seroclearance (for those with
HBeAg-81
positive serology), and more importantly hepatitis B surface antigen (HBsAg) seroclearance [4].
82
During TDF use in HIV-HBV co-infected patients, almost half of those who are HBeAg-positive
83
exhibit HBeAg-seroclearance and few overall have HBsAg-seroclearance [6,7]. There are,
84
however, exceptions in which higher rates of seroclearance are observed in co-infected
85
patients with more severe immunosuppression [8–10]. As antiviral therapy inhibits viral
86
replication of HBV-DNA, its levels do not accurately reflect intrahepatic HBV activity in patients
87
undergoing antiviral treatment [11]. Other markers of treatment efficacy, such as
88
quantification of HBeAg (qHBeAg) and HBsAg (qHBsAg), have been useful in predicting
89
seroclearance events, but their stability during long-term treatment makes their use in routine
90
clinical practice debatable [6,12].
91
92
Recently, quantitative hepatitis B core-related antigen (qHBcrAg) and anti-hepatitis B core
93
antibody (qAnti-HBc) have been gaining attention in HBV mono-infection. qHBcrAg consists of
94
three proteins, hepatitis B core antigen (HBcAg), HBeAg and a 22KDa precore protein (p22cr),
95
which are transcribed from the precore/core gene and share an identical 149 amino acid
96
sequence [13]. This surrogate marker strongly correlates with covalently-closed circular
97
(ccc)DNA and total intrahepatic HBV-DNA during antiviral-induced HBV suppression [13–18].
98
qAnti-HBc involves quantification of the standard marker anti-HBc antibodies and is thought to
99
reflect HBV-specific adaptive immunity. Baseline levels of this marker have been shown to bear
100
reliable prediction of HBeAg seroconversion in HBV mono-infected patients undergoing
101
antiviral therapy [19].
102
103
Nevertheless, current research on these markers has mainly focused on HBV mono-infected
104
patients, while no study to date has examined its relevance in HIV-HBV co-infection. This is
105
particularly concerning as qAnti-HBc levels are linked to host immunity [20], which could be
106
impaired during HIV infection. The aim of the present study was to describe qHBcrAg and
107
qAnti-HBc kinetics during long-term TDF treatment in a large, prospective cohort of
ART-108
experienced HIV-HBV co-infected patients. We further aimed to evaluate the association
109
between these markers and HBeAg or HBsAg-seroclearance and their predictive capacity for
110
these events.111
112
Methods113
114
Patients and data collection
115
Patients were selected from the French HIV-HBV Cohort Study [21]. Briefly, this prospective
116
study recruited 308 HIV-infected patients with chronic HBV infection from seven clinical
centers located in Paris and Lyon, France during May 2002–May 2003. Patients were included
118
if they had HIV-positive serology confirmed by western blot and HBsAg-positive serology for
119
more than 6 months. Participants were followed prospectively every six to twelve months until
120
2010-2011.
121
122
For this analysis, we included patients who initiated TDF-containing ART, had a minimum of
123
two consecutive visits undergoing TDF-containing ART (lasting more than 6 months), with an
124
available sample at TDF-initiation and at least once during follow-up. Patients with detectable
125
HCV-RNA or HDV-RNA or those undergoing intensification with standard or
pegylated-126
interferon (peg-IFN) were excluded from analysis (Supplementary figure 1). All patients gave
127
written informed consent to participate in the cohort and the study received ethical approval
128
in accordance with the Helsinki declaration.
129
130
Baseline was defined as the study visit at or directly prior to TDF-initiation. Follow-up began at
131
TDF-initiation and continued until last study visit, TDF discontinuation, meeting any one of the
132
exclusion criteria, or death; whichever occurred first. Demographic information were collected
133
at study inclusion. HIV- and HBV-related variables were collected before TDF initiation and at
134
each follow-up visit.
135
136
Assessing markers of viral activity
137
Serum HBV-DNA was quantified at baseline and every 6 months by a real-time PCR assay
138
(COBAS® AmpliPrep/COBAS TaqMan®, detection limit: 12 IU/mL; or COBAS® Amplicor HBV
139
Monitor, detection limit: 60 IU/mL; Roche Diagnostics, Meylan, France). HIV-RNA viral load was
140
measured at cohort inclusion and every six months using either a branched-DNA (b-DNA
141
Quantiplex 3.0, detection limit: 50 copies/mL, Bayer Diagnostics, Cergy Pontoise, France) or
real-time PCR technique (COBAS® AmpliPrep/COBAS TaqMan® HIV-1 test, detection limit: 40
143
copies/mL, Roche Molecular Systems, Meylan, France).
144
145
Qualitative HBsAg, HBeAg, and antibodies were detected yearly using commercial
enzyme-146
linked immunoassays (EIAs) (Diasorin, Antony, France). All other markers were collected at
147
baseline and every 6 months. Serum qHBsAg levels (IU/mL) were quantified using the
148
ARCHITECT HBsAg assay (Abbott Laboratories, Rungis, France) [7,22]. Serum qHBeAg levels
149
were quantified using either ARCHITECT or Elecsys HBeAg assay (with Modular E170 analyzer;
150
Roche Diagnostics). qHBeAg levels were expressed in Paul Ehrlich Institute units (PEIU)/mL
151
[23]. qHBcrAg (U/mL) was measured using a commercially-available, automated HBcrAg
152
chemiluminescence EIA (Lumipulse® G System, FujiRebio Europe, Gent, Belgium) [24]. When
153
initial qHBcrAg levels were above 7 log10 U/mL, a 1/100 dilution was performed to obtain
154
results within the range of quantification. Finally, IgG and IgM anti-HBc antibodies were
155
quantified using ARCHITECT Anti-HBc II assay (Abbott Laboratories, Rungis, France) with an
156
automated ARCHITECT i4000 system. Anti-HBc antibody levels were reported in PEIU/mL [25].
157
158
Statistical analysis
159
All qHBcrAg and qAnti-HBc units were log10 transformed. Linear regression was used to
160
estimate univariable differences in baseline qHBcrAg or qAnti-HBc, and their 95% confidence
161
intervals (CI), across levels of determinants. A multivariable model was constructed by adding
162
all covariables with a p<0.2 in univariable analysis and removing non-significant variables in
163
backwards-stepwise fashion.
164
165
In longitudinal analysis, on-treatment kinetics of the changes of qHBcrAg (ΔqHBcrAg) and
166
qAnti-HBc (ΔqAnti-HBc) were estimated using mixed-effect linear regression models with a
random-intercept to account for between-patient variability at baseline [26]. Models were
168
stratified by status. Given the bi-phasic nature of ΔqHBcrAg kinetics among
HBeAg-169
positive patients in preliminary analysis, we modeled qHBcrAg kinetics according to <18 and
170
>18 months of TDF treatment. All of the models were adjusted a priori for factors influencing
171
liver fibrosis or HBV replication: body mass index (BMI), age, concomitant lamivudine (LAM)
172
treatment, cumulative treatment duration with LAM, undetectable HBV-DNA, CD4+ cell count
173
>350 cells/mm3 (if not already stratified), and baseline qHBcrAg or qAnti-HBc levels. For
174
specific genetic and immunological determinants, we also included a cross-product term
175
between TDF duration and presence of determinant along with its individual components
176
(separately for each determinant), from which stratum-specific estimates could be calculated
177
and differences in ΔHBcrAg and ΔqAnti-HBc could be tested.
178
179
We then evaluated the relationship between qHBcrAg or qAnti-HBc and HBeAg-seroclearance.
180
First, univariable hazards ratios (HR) and 95%CI comparing hazards of HBeAg-seroclearance
181
between continuous baseline levels of markers (qHBcrAg and qAnti-HBc separately) were
182
estimated using Cox proportional hazards models. A multivariable model was constructed
183
using the backwards-selection approach as described above. Second, we performed several
184
analyses to explore the most adequate thresholds for both markers, individually or combined.
185
We selected the following criteria to assess the predictive capacity of HBeAg-seroclearance:
186
qHBcrAg log10 U/mL <7.5 at baseline and <6.5 at months 12, 24 and 36; qAnti-HBc >4.1 log10
187
PEIU/mL at baseline; qHBcrAg <7.5 log10 U/mL and qAnti-HBc >4.1 log10 PEIU/mL at baseline;
188
qHBcrAg <7.5 log10 U/mL or qAnti-HBc >4.1 log10 PEIU/mL at baseline; and HBV-DNA <60 IU/mL
189
at months 12, 24 and 36. Time-dependent receiver operating characteristic (ROC) curves were
190
used to evaluate the sensitivity (Se) and specificity (Sp) of each criterion as predictor of
HBeAg-191
seroclearance until specific time-points of TDF duration [27].
193
All statistical analysis was performed using STATA (v15.1, College Station, TX, USA) or RStudio
194
(v1.1.453, Vienna, Austria) and significance was defined as a p-value <0.05.
195
196
Results
197
Baseline characteristics of the study population
198
Of the 158 patients, 95 (60%) were HBeAg-positive and 63 (40%) HBeAg-negative. At
TDF-199
initiation, median age was 41.1 years (IQR=35.5-48.0) and the majority was male (84.2%). All
200
patients were ART-experienced with median CD4+ cell count at 404/mm3 (IQR=295-552) and
201
57.3% (n=90) having undetectable HIV-RNA. A total of 123 (78.3%) had detectable HBV-DNA
202
with a median viral load of 5.2 log10 IU/mL (IQR=3.0-7.2). For those with available data on HBV
203
genotypes, most patients harbored genotype A (68%), followed by E (12%), G (12%) and D
204
(8%). The G to A nucleotide substitution at position 1896 of the precore region was identified
205
in 21.8% of patients (n=22/101).
206
207
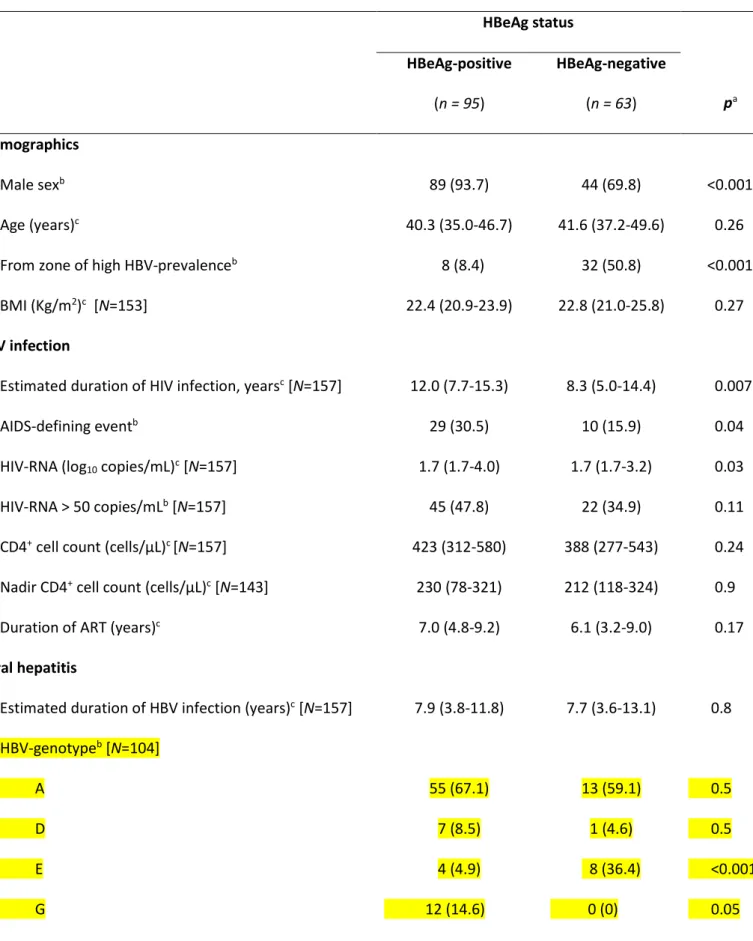
As shown in Table 1, HBeAg-positive patients were more often male (p<0.001), born in zone of
208
low/moderate HBV-prevalence (p<0.001), diagnosed with an AIDS-defining event (p=0.04), had
209
a longer duration of known HIV-infection (p=0.007), higher levels of HIV-RNA (p=0.03) and
210
qHBsAg (p<0.001) than HBeAg-negative patients (Table 1). As expected, HBV-DNA and ALT/AST
211
levels were higher among HBeAg-positive versus HBeAg-negative patients (both p<0.001).
212
213
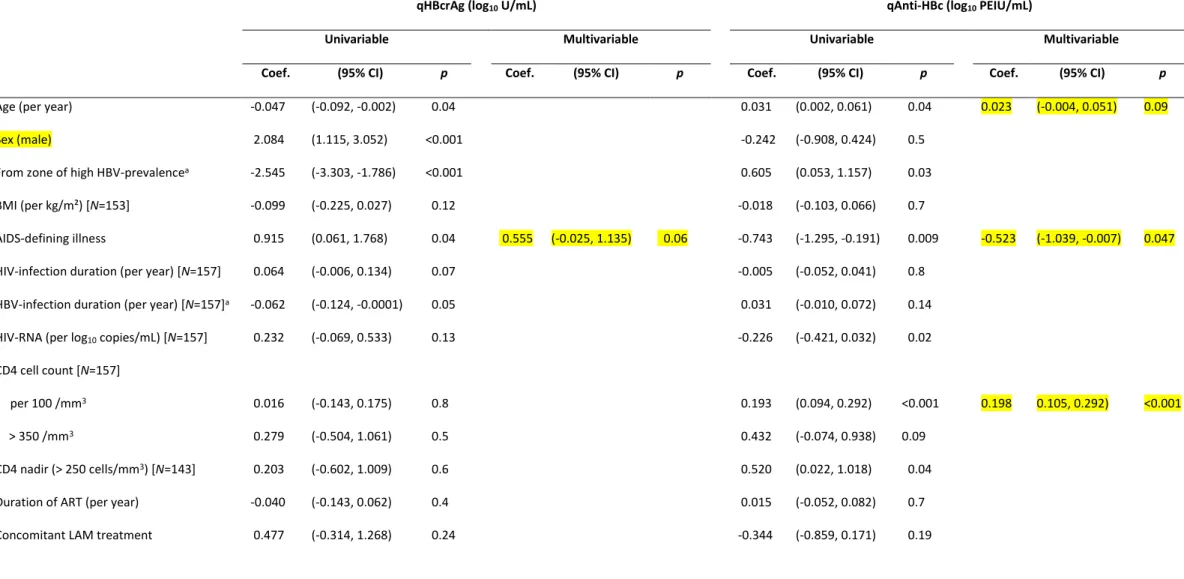
Baseline determinants of qHBcrAg and qAnti-HBc levels
214
At TDF-initiation, median levels of unadjusted qHBcrAg were significantly higher in
HBeAg-215
positive (7.8 log10 U/mL; IQR=7.0-8.2; p<0.001) versus HBeAg-negative patients (3.0 log10
216
U/mL; IQR=2.5-4.0), while median levels of unadjusted qAnti-HBc were greater in
negative (3.4 log10 PEIU/mL; IQR=3.0–3.9; p=0.008) versus HBeAg-positive patients (2.8 log10
218
PEIU/mL; IQR= 1.1–4.0) (Table 1).In multivariable analysis (Table 2), baseline qHBcrAg levels
219
(adjusted mean log10 U/mL) were higher in those with an AIDS-defining event (6.3 versus
220
without advanced HIV disease, 5.7; p=0.06), ALT >70 IU/L (6.7 versus ALT ≤70 IU/L, 5.5;
221
p<0.001) and higher serum HBV-DNA (p<0.001). Baseline qAnti-HBc levels (adjusted mean log10
222
PEIU/mL) were higher in older individuals (p=0.09), those without an AIDS-defining illness (3.0
223
versus with AIDS-defining illness, 2.3; p=0.047), with higher CD4+ cell count(p<0.001) and with
224
HBeAg-negative status at baseline (3.4 versus HBeAg-negative, 2.5; p<0.001).
225
226
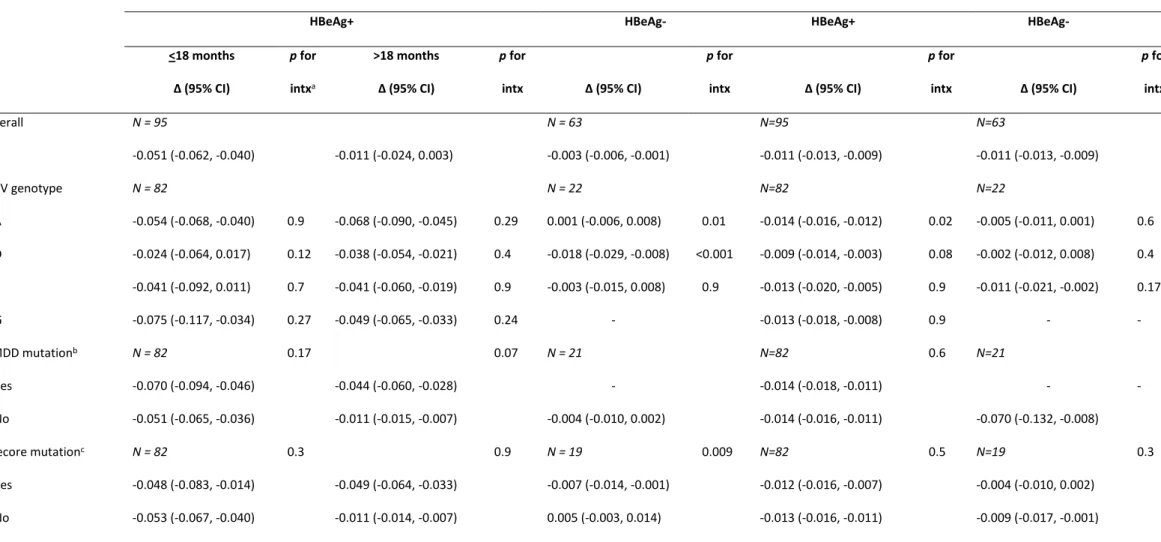
On-treatment kinetics of qHBcrAg and qAnti-HBc levels
227
Median follow-up of TDF treatment was 4.6 years (IQR=2.9-7.6). Adjusted ΔHBcrAg was faster
228
in HBeAg-positive versus HBeAg-negative patients, overall and during the first 18-months of
229
treatment (Table 3; figure 1A). In HBeAg-positive patients, adjusted ΔqHBcrAg during TDF
230
treatment was biphasic, with a significantly more rapid decline during the first 18 months
(-231
0.051 log10 U/mL/month) compared to thereafter (-0.011 log10 U/mL/month; p=0.007). In
232
HBeAg-negative patients, adjusted ΔqHBcrAg was linear during TDF treatment (-0.003 log10
233
U/mL/month). ΔqHBcrAg was faster in HBeAg-negative patients with HBV genotype D infection
234
patients (p<0.001) and slower with genotype A infection (p=0.01) compared to other
235
genotypes, while faster ΔqHBcrAg was observed in HBeAg-negative patients with precore
236
mutations compared to without (p=0.009).
237
238
Both HBeAg-positive and HBeAg-negative patients had linear ΔqAnti-HBc during TDF treatment
239
(Figure 2A), while ΔqAnti-HBc was not different between positive versus
HBeAg-240
negative patients (-0.011 log10 PEIU/mL/month for both; p=0.7) (Table 3). In HBeAg-positive
241
patients, adjusted ΔqAnti-HBc was significantly faster in HBV genotype A versus non-A
infection (p=0.02). In both HBeAg-positive and HBeAg-negative patients, those with CD4+ cell
243
count >350/mm3 versus ≤350/mm3 and those with a nadir CD4+ cell count >200/mm3 versus
244
≤200/mm3 exhibited a significantly faster ΔqAnti-HBc during TDF treatment (Table 3).
245
246
Of note, baseline qHBsAg levels were not significantly correlated with individual ΔqHBcrAg in
247
HBeAg-positive individuals (Bland-Altman rho=-0.06, p=0.11) and HBeAg-negative individuals
248
(Bland-Altman rho=0.0004, p=0.9). Baseline qHBsAg levels were also not significantly
249
correlated with individual ΔqAnti-HBc in HBeAg-positive individuals (Bland-Altman rho=0.06,
250
p=0.12) and HBeAg-negative individuals (Bland-Altman rho=-0.08, p=0.12).
251
252
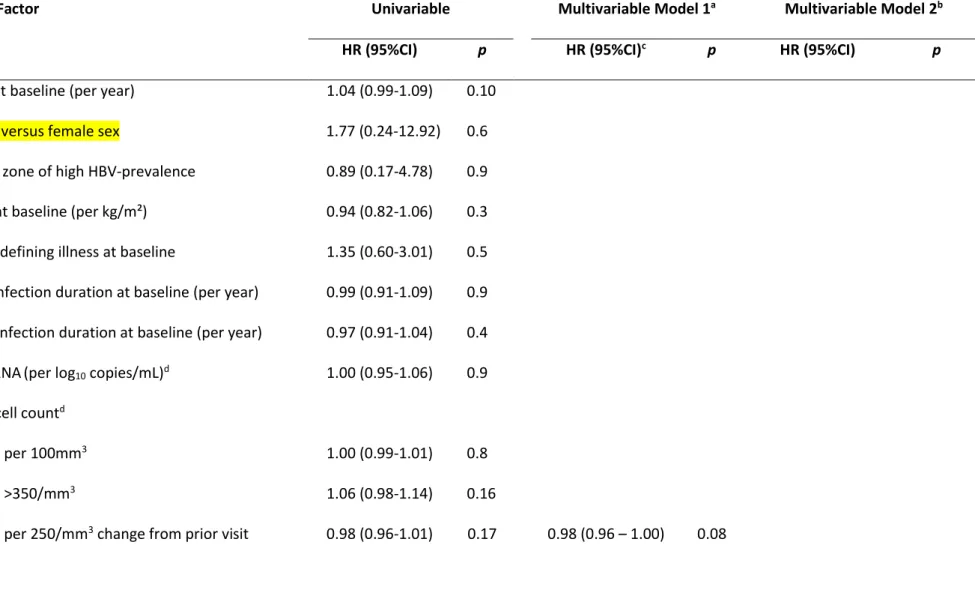
Association of qHBcrAg and qAnti-HBc levels with seroclearance
253
During TDF treatment, 26 HBeAg-positive patients achieved HBeAg-seroclearance (cumulative
254
incidence=27.4%, 95%CI=18.7%-37.5%). Of the patients with HBeAg-seroclearance, HBeAg
255
seroconversion occurred in 8 (cumulative incidence=8.4%, 95%CI=3.7%-15.9%). Patients with
256
lower baseline qHBcrAg level had a higher rate of HBeAg-seroclearance (Figure 1B) after
257
adjusting for change in CD4+ cell count from previous visit (adjusted-HR=0.48, 95%CI=0.33–
258
0.70) (Table 4). Patients with higher baseline qAnti-HBc level had higher rates of
HBeAg-259
seroclearance (HR=1.49, 95%CI=1.08-2.07) (Figure 2B), while no other variable was below the
260
p-value threshold considered for multivariable analysis (Table 4). In addition, ΔqAnti-HBc was
261
also faster among patients achieving HBeAg-seroclearance during follow-up (-0.017 log10
262
PEIU/mL/month) compared to those without HBeAg-loss (-0.010 PEIU/mL/month; p<0.001).
263
264
HBsAg-seroclearance occurred in only 5 patients (cumulative incidence=3.2%,
95%CI=1.0%-265
7.2%). There were no statistically significant differences in their baseline characteristics
266
compared to those without HBsAg-seroclearance (Supplementary table 1). Among those with
HBsAg-seroclearance, median baseline qHBcrAg was 6.7 log10 U/mL (range
HBeAg-268
positive=6.7-8.0, HBeAg-negative=3.7-4.0) and median baseline qAnti-HBc was 3.2 log10
269
PEIU/mL (range HBeAg-positive=1.2-4.6, HBeAg-negative=1.8-3.6). ΔqHBcrAg appeared
270
steeper during the first 12 months of TDF treatment in these individuals (Figure 1C), while the
271
change in qAnti-HBc was flat during follow-up (Figure 2C). Given the few numbers of patients
272
with HBsAg-seroclearance, this endpoint was not considered further in analysis.
273
274
Predictive capacity of HBV serological markers on HBeAg-seroclearance
275
Table 5 gives the Se and Sp of various criteria in predicting HBeAg-seroclearance at specific
276
time-points during TDF treatment. As expected, undetectable HBV-DNA for most time-points
277
provided optimal Se, but consistently low Sp in predicting long-term HBeAg-seroclearance.
278
qHBcrAg <6.5 log10 U/mL at months 12, 24 or 36 showed comparable Se to undetectable
HBV-279
DNA, but higher Sp especially for predicting HBeAg-seroclearance in the 12 months following
280
qHBcrAg measurement. Baseline qAnti-HBc >4.1 log10 PEIU/mL showed high Sp, but very low
281
Se in predicting HBeAg-seroclearance. When combining qHBcrAg <7.5 log10 U/mL and
qAnti-282
HBc >4.1 log10 PEIU/mL, both assessed at baseline, we found the highest levels of Sp in
283
predicting HBeAg-seroclearance of the studied markers, but low Se.
284
285
Discussion
286
Despite the extensive research on novel biomarkers of HBV viral activity, none to date have
287
examined their kinetics or association with seroclearance in HIV-HBV co-infected patients
288
undergoing TDF treatment. We have demonstrated a gradual decrease of on-treatment
289
qHBcrAg and qAnti-HBc levels, compatible with a cumulative therapeutic benefit of long-term
290
nucleos(t)ide analogue (NA) therapy. Our findings indicated that lower baseline levels of
291
qHBcrAg and higher qAnti-HBc antibodies were strong, independent predictors of HBeAg
seroclearance, suggesting some clinical applicability in TDF-treated HIV-HBV co-infected
293
patients. To our knowledge, this study is the first to report the clinical utility of qHBcrAg or
294
qAnti-HBc levels as a predictor of HBeAg-seroclearance in the treated HIV-HBV co-infected
295
population.
296
297
Despite the fact that all previous studies examining qHBcrAg and qAnti-HBc antibodies have
298
been performed in HBV mono-infected patients, we did observe several similarities to our
co-299
infected population [19,28]. A decrease in qHBcrAg during TDF treatment was indeed observed
300
for both HBeAg-positive or HBeAg-negative patients [28,29]. In addition, we demonstrated a
301
bi-phasic decline in HBeAg-positive patients, which probably reflected the initial, effective
302
inhibition of circulating virus in the blood associated with TDF followed by reductions of the
303
cccDNA pool [30]. For qAnti-HBc antibodies, its kinetics in TDF-treated HIV-HBV coinfected
304
patients showed a steady decline, for both HBeAg-positive or HBeAg-negative patients, similar
305
to HBV mono-infected individuals treated with peg-IFN or NAs [19,31,32]. Interestingly, the
306
observation of higher median baseline qAnti-HBc levels in negative versus
HBeAg-307
positive patients could be the result of increased immune activity in patients previously able to
308
clear HBeAg [33,34].
309
310
We were able to identify other viral characteristics associated with qHBcrAg and qAnti-HBc
311
kinetics. The presence of a precore mutation in HBeAg-negative patients appeared to
312
accelerate declines in qHBcrAg. Indeed, as precore mutations can block the synthesis of HBeAg
313
without adversely affecting HBV replication [35], the more rapid decrease in qHBcrAg might
314
partly reflect viral suppression linked to TDF treatment. Whether this is due to reduction of the
315
cccDNA pool in hepatocytes or from immunological clearance of virus in patients harboring
316
precore mutant variants is unknown and cannot be confirmed with the data collected in our
study. Nevertheless, it should be noted that the rates of declines observed in these patients
318
were much slower than most of the average rates of declines in HBeAg-positive patients.
319
320
On-treatment qAnti-HBc kinetics were faster in HBV genotype A versus non-A genotypes,
321
specifically among HBeAg-positive patients. In studies on the natural history of HBV
mono-322
infection, HBeAg-positive patients with HBV genotype A have demonstrated higher rates of
323
sustained transaminase normalization, HBV-DNA clearance, transition to inactive HBV carrier
324
state after HBeAg-seroconversion, and HBsAg-seroclearance [36,37]. These data would suggest
325
that a more robust antiviral immune response could be elicited against genotype A infection,
326
yet the exact mechanisms remain unknown ([38]). The faster decrease in qAnti-HBc levels
327
builds on these findings, suggesting that anti-HBV-specific immunity could be more active in
328
HBeAg-positive genotype A infected patients, even during TDF treatment.
329
330
Interestingly, given that HIV-related immunity also exerts an effect on anti-HBV-specific
331
immunity [39], qAnti-HBc levels would assumedly be influenced by the degree of HIV-induced
332
immunosuppression. This effect was already apparent at baseline, at which point qAnti-HBc
333
levels were lower in patients with a previous AIDS-defining illness and lower CD4+ T cell
334
counts. Additionally, more rapid declines of qAnti-HBc were observed in patients with higher
335
baseline (>350 cells/mm3) and nadir (>200 cells/mm3) CD4+ cell counts, regardless of baseline
336
HBeAg-status, supporting the concept that more pronounced immunosuppression lends to
337
slower declines of qAnti-HBc [40]. How this translates to HBeAg-seroclearance is unclear.
338
Faster slopes of qAnti-HBc were associated with HBeAg-seroclearance, suggesting that longer
339
time spent at higher levels of qAnti-HBc levels (i.e. with more active anti-HBV immunity) does
340
not lead to seroclearance. In addition, we observed no significant association with CD4+ cell
341
counts and HBeAg-seroclearance.
343
More importantly, we found that higher levels of qHBcrAg at the time of initiating
TDF-344
containing ART were independently associated with lower rates of HBeAg-seroclearance in
345
positive patients. Previous research linking baseline qHBcrAg levels with
HBeAg-346
seroclearance have mostly focused on treatment with IFN. In 46 patients treated with
peg-347
IFN, Chuaypen et al [18] reported that those with baseline qHBcrAg levels >8 log10 U/mL had a
348
low risk of HBeAg seroclearance and suppression of HBV-DNA at 12 weeks post-treatment.
349
Others have found that qHBcrAg levels at week 12 of peg-IFN treatment were predictive of
350
post-treatment HBeAg-seroclearance [29], while another study investigating entecavir (ETV)
351
with or without peg-IFN add-on therapy observed that higher qHBcrAg levels at both week 24
352
and week 36 were independently associated with a lower risk of HBeAg-seroclearance and
353
HBV-DNA suppression 24-weeks post-treatment in both treatment arms [37]. With regards to
354
NA-based therapy, baseline HBcrAg levels >5.7 log10 U/mL have been also associated with lack
355
of HBeAg-seroconversion at 6 and 12 months of treatment [28] and faster declines of qHBcrAg
356
were observed in patients with HBeAg-seroclearance as compared to those without [33]. Our
357
findings in TDF-treated HIV-HBV co-infected patients fall in line with these studies.
358
359
Likewise, we found an association between anti-HBc antibody levels and HBeAg-seroclearance,
360
indicating that patients with higher baseline total qAnti-HBc levels exhibited higher rates of
361
HBeAg-seroclearance. Previous research has suggested that baseline qAnti-HBc strongly
362
predicts HBeAg-seroconversion in populations of HBV mono-infected patients receiving either
363
NA or peg-IFN therapy [19,25,32]. The fact that an association between qAnti-HBc levels and
364
HBeAg-seroclearance was observed in HBV co-infected patients, given the effect of
HIV-365
induced immunosuppression on its quantification and sometimes higher rates of
HBeAg-366
seroclearance observed after anti-HBV containing ART [9,10], is noteworthy.
368
In terms of predictive capacity, we confirm the high sensitivity of qHBcrAg. We add to previous
369
studies by showing that qHBcrAg levels have higher specificity in predicting
HBeAg-370
seroclearance within 12-months of being measured, with waning specificity in predicting
371
HBeAg-seroclearance thereafter. This finding implies that repeated measurements of qHBcrAg
372
would be needed in order to continuously and more accurately gauge the risk of
HBeAg-373
seroclearance. Indeed, other studies focusing on time-specific measurements of serum
374
qHBcrAg levels have involved peg-IFN treatment in HBV mono-infected patients, with qHBcrAg
375
measured at 12 weeks representing an important milestone for treatment response and
376
stopping rules [18,29,41]. These studies have also demonstrated higher Se, but modest Sp
377
when using qHBcrAg to predict HBeAg-seroconversion. On the other hand, serum anti-HBc
378
antibodies had higher Sp at baseline than at any point during follow-up. Even when used as a
379
complementary marker with qHBcrAg, predictive capacity did not improve. Nevertheless, the
380
performance of these markers appears to be similar to qHBsAg and qHBeAg from previous
381
studies in TDF-treated co-infected individuals [42]. Coupled with the marginally higher Sp
382
when compared to using undetectable HBV-DNA to predict HBeAg-seroclearance, it is
383
debatable to what extent these markers should be used in routine care (38).
384
385
Certain limitations of our study must be acknowledged. We only included analysis on HBeAg
386
seroclearance and not HBeAg seroconversion, which could be considered a more desired
387
endpoint of treatment response [4]. Considering that few patients achieved HBsAg
388
seroclearance, our analysis on this endpoint was wholly descriptive. Second, there was
389
substantial heterogeneity of HBcrAg levels observed during follow-up, making interpretability
390
of this marker somewhat difficult. Finally, data on HBV genetic variability were available for
391
patients with HBV-DNA replication, representing a group with more active HBV infection.
393
In conclusion, we provide a thorough understanding of qHBcrAg and qAnti-HBc kinetics, and
394
their clinical applicability, in the context of HIV-HBV co-infection. Serum levels of qHBcrAg and
395
qAnti-HBc could be useful in predicting HBeAg-seroclearance in HIV-HBV co-infected patients
396
undergoing long-term TDF-containing ART. This is based on the high sensitivity of qHBcrAg and
397
high specificity of qAnti-HBc, when compared to undetectable HBV-DNA, in predicting
HBeAg-398
seroclearance. Nevertheless, whether they provide further clinical utility compared to qHBsAg
399
and qHBeAg remains debatable.
400
401
Notes
402
Conflicts of interest statement. C.D. reports receiving grants outside the submitted work from
403
ViiV and Gilead, and K.L. reports receiving advisory board fees from Gilead. All other authors
404
have no potential conflicts of interest to report.
405
406
Funding. This work was supported by SIDACTION (AO 19); and the Agence nationale de
407
recherches sur le Sida et les hépatites virales (ANRS). Gilead Sciences, Inc. provided an
408
unrestricted grant for the French HIV-HBV cohort and was not involved in any part of the data
409
collection, analysis and manuscript writing.
410
411
Meetings. These findings have been presented at the Réunion Annuelle AC42 - Réseau
412
National Hépatites de l’ANRS 2019, in February 2019, held in Paris, France; and, at the
EASL-413
AASLD HBV Endpoint Cure Conference, in March 2019, held in London, England (abstract
414
numbers: P04-01YI and P04-02YI).
415
416
Acknowledgements. This study has been sponsored by the Institut de Médecine et
417
d’Epidémiologie Appliquée (IMEA). L.D. was awarded a post-doctoral fellowship from the
418
Agence nationale de recherches sur le Sida et les hépatites virales (ANRS).
419
420
Corresponding author. Dr. Anders Boyd
421
Services de Maladies Infectieuses et Tropicales, Hôpital Saint-Antoine
422
184 Rue du Faubourg St. Antoine, 75571 Paris Cedex 12, France
423
Tel: +33 1 71 97 05 17424
Fax: +33 1 49 28 21 49425
Email: [email protected]426
427
Alternate corresponding author. Prof. Karine Lacombe
428
Services de Maladies Infectieuses et Tropicales, Hôpital Saint-Antoine
429
184 Rue du Faubourg St. Antoine, 75571 Paris Cedex 12, France
430
Tel : +33 1 49 28 31 96431
Fax: +33 1 49 28 21 49432
Email : [email protected]433
434
References435
1. World Health Organization, Global Hepatitis Programme. Global hepatitis report, 2017.
436
Available at:
http://apps.who.int/iris/bitstream/10665/255016/1/9789241565455-437
eng.pdf?ua=1. Accessed 07 November 2019.
438
2. Ioannou GN, Bryson CL, Weiss NS, Miller R, Scott JD, Boyko EJ. The prevalence of cirrhosis
439
and hepatocellular carcinoma in patients with human immunodeficiency virus infection.
440
Hepatology 2013 ; 57:249–57.
3. Hosaka T, Suzuki F, Kobayashi M, et al. Long-term entecavir treatment reduces
442
hepatocellular carcinoma incidence in patients with hepatitis B virus infection.
443
Hepatology 2013 ; 58:98–107.
444
4. Lampertico P, Agarwal K, Berg T, et al. EASL 2017 Clinical Practice Guidelines on the
445
management of hepatitis B virus infection. J Hepatol 2017 ; 67:370–98.
446
5. Boyd A, Gozlan J, Miailhes P, et al. Rates and determinants of hepatitis B ‘e’ antigen and
447
hepatitis B surface antigen seroclearance during long-term follow-up of patients
448
coinfected with HIV and hepatitis B virus: AIDS 2015 ; 29:1963–73.
449
6. Boyd A, Maylin S, Moh R, et al. Hepatitis B surface antigen quantification as a predictor of
450
seroclearance during treatment in HIV-hepatitis B virus coinfected patients from
Sub-451
Saharan Africa: Seroclearance during treatment. J Gastroenterol Hepatol 2016 ; 31:634–
452
44.
453
7. Boyd A, Maylin S, Gozlan J, et al. Use of hepatitis B surface and “e” antigen quantification
454
during extensive treatment with tenofovir in patients co-infected with HIV-HBV. Liver Int
455
2015 ; 35:795–804.
456
8. Singh KP, Crane M, Audsley J, Avihingsanon A, Sasadeusz J, Lewin SR. HIV-hepatitis B virus
457
coinfection: epidemiology, pathogenesis, and treatment. AIDS 2017 ; 31:2035–52.
458
9. Chihota BV, Wandeler G, Chilengi R, et al. High Rates of Hepatitis B Virus (HBV)
459
Functional Cure Among Human Immunodeficiency Virus-HBV Coinfected Patients on
460
Antiretroviral Therapy in Zambia. J Infect Dis 2019 ; jiz450.
461
10. Matthews GV, Ali RJ, Avihingsanon A, et al. Quantitative HBsAg and HBeAg Predict
462
Hepatitis B Seroconversion after Initiation of HAART in HIV-HBV Coinfected Individuals.
463
Tillmann H, editor. PLoS ONE 2013 ; 8:e61297.
11. Boyd A, Lacombe K, Lavocat F, et al. Decay of ccc-DNA marks persistence of intrahepatic
465
viral DNA synthesis under tenofovir in HIV-HBV co-infected patients. J Hepatol 2016 ;
466
65:683–691.
467
12. Martinot-Peignoux M, Lapalus M, Asselah T, Marcellin P. The role of HBsAg quantification
468
for monitoring natural history and treatment outcome. Liver Int 2013 ; 33:125–32.
469
13. Mak L-Y, Wong DK-H, Cheung K-S, Seto W-K, Lai C-L, Yuen M-F. Review article: hepatitis B
470
core-related antigen (HBcrAg): an emerging marker for chronic hepatitis B virus infection.
471
Aliment Pharmacol Ther 2018 ; 47:43–54.
472
14. Wong DK-H, Tanaka Y, Lai C-L, Mizokami M, Fung J, Yuen M-F. Hepatitis B Virus
Core-473
Related Antigens as Markers for Monitoring Chronic Hepatitis B Infection. J Clin Microbiol
474
2007 ; 45:3942–47.
475
15. Tanaka E, Matsumoto A, Yoshizawa K, Maki N. Hepatitis B Core-Related Antigen Assay Is
476
Useful for Monitoring the Antiviral Effects of Nucleoside Analogue Therapy. Intervirology
477
2008 ; 51:3–6.
478
16. Chen S, Jia J, Gao Y, et al. Clinical evaluation of hepatitis B core-related antigen in chronic
479
hepatitis B and hepatocellular carcinoma patients. Clin Chim Acta 2018 ; 486:237–44.
480
17. Rokuhara A, Tanaka E, Matsumoto A, et al. Clinical evaluation of a new enzyme
481
immunoassay for hepatitis B virus core-related antigen; a marker distinct from viral DNA
482
for monitoring lamivudine treatment. J Viral Hepat 2003 ; 10:324–30.
483
18. Chuaypen N, Posuwan N, Payungporn S, et al. Serum hepatitis B core-related antigen as a
484
treatment predictor of pegylated interferon in patients with HBeAg-positive chronic
485
hepatitis B. Liver Int 2016 ; 36:827–36.
486
19. Fan R, Sun J, Yuan Q, et al. Baseline quantitative hepatitis B core antibody titre alone
487
strongly predicts HBeAg seroconversion across chronic hepatitis B patients treated with
488
peginterferon or nucleos(t)ide analogues. Gut 2016 ; 65:313–20.
20. Lee BO, Tucker A, Frelin L, et al. Interaction of the Hepatitis B Core Antigen and the
490
Innate Immune System. J Immunol 2009 ; 182:6670–81.
491
21. Lacombe K, Massari V, Girard P-M, et al. Major role of hepatitis B genotypes in liver
492
fibrosis during coinfection with HIV: AIDS 2006 ; 20:419–27.
493
22. Deguchi M, Yamashita N, Kagita M, et al. Quantitation of hepatitis B surface antigen by
494
an automated chemiluminescent microparticle immunoassay. J Virol Methods 2004 ;
495
115:217–22.
496
23. Maylin S, Boyd A, Martinot-Peignoux M, et al. Quantification of hepatitis B e antigen
497
between Elecsys HBeAg and Architect HBeAg assays among patients infected with
498
hepatitis B virus. J Clin Virol 2013 ; 56:306–11.
499
24. Kimura T, Rokuhara A, Sakamoto Y, et al. Sensitive Enzyme Immunoassay for Hepatitis B
500
Virus Core-Related Antigens and Their Correlation to Virus Load. J Clin Microbiol 2002 ;
501
40:439–45.
502
25. Yuan Q, Song L-W, Liu C-J, et al. Quantitative hepatitis B core antibody level may help
503
predict treatment response in chronic hepatitis B patients. Gut 2013 ; 62:182.2-184.
504
26. Rabe-Hesketh S, Skrondal A. Multilevel and longitudinal modeling using stata. Volume I:
505
Continuous responses. 3rd edition. College Station, Texas: StataCorp LP; 2012. 497 p.
506
27. Heagerty PJ, Lumley T, Pepe MS. Time-dependent ROC curves for censored survival data
507
and a diagnostic marker. Biometrics 2000 ; 56:337–44.
508
28. Wang B, Carey I, Bruce M, Montague S, Dusheiko G, Agarwal K. HBsAg and HBcrAg as
509
predictors of HBeAg seroconversion in HBeAg-positive patients treated with nucleos(t)ide
510
analogues. J Viral Hepat 2018 ; 25:886–93.
511
29. Ma H, Yang R-F, Li X-H, Jin Q, Wei L. HBcrAg Identifies Patients Failing to Achieve HBeAg
512
Seroconversion Treated with Pegylated Interferon Alfa-2b: Chin Med J 2016 ; 129:2212–
513
19.
30. Lai C-L, Wong D, Ip P, et al. Reduction of covalently closed circular DNA with long-term
515
nucleos(t)ide analogue treatment in chronic hepatitis B. J Hepatol 2017 ; 66:275–81.
516
31. Hu H-H, Liu J, Chang C-L, et al. Level of Hepatitis B (HB) Core Antibody Associates With
517
Seroclearance of HBV DNA and HB Surface Antigen in HB e Antigen-Seronegative
518
Patients. Clin Gastroenterol Hepatol 2019 ; 17:172-181.e1.
519
32. Hou F-Q, Song L-W, Yuan Q, et al. Quantitative Hepatitis B Core Antibody Level Is a New
520
Predictor for Treatment Response In HBeAg-positive Chronic Hepatitis B Patients
521
Receiving Peginterferon. Theranostics 2015 ; 5:218–26.
522
33. Liao H, Liu Y, Li X, et al. Monitoring of serum HBV RNA, HBcrAg, HBsAg and anti-HBc levels
523
in patients during long-term nucleoside/nucleotide analogue therapy. Antivir Ther 2019 ;
524
24:105-15.
525
34. Song L-W, Liu P-G, Liu C-J, et al. Quantitative hepatitis B core antibody levels in the
526
natural history of hepatitis B virus infection. Clin Microbiol Infect 2015 ; 21:197–203.
527
35. Carman WF, Jacyna MR, Hadziyannis S, et al. Mutation preventing formation of hepatitis
528
B e antigen in patients with chronic hepatitis B infection. Lancet 1989 ; 2:588–91.
529
36. Sánchez-Tapias JM, Costa J, Mas A, Bruguera M, Rodés J. Influence of hepatitis B virus
530
genotype on the long-term outcome of chronic hepatitis B in western patients.
531
Gastroenterology 2002 ; 123:1848–56.
532
37. Campenhout MJH van, Brouwer WP, Oord GW van, et al. Hepatitis B core-related antigen
533
levels are associated with response to entecavir and peginterferon add-on therapy in
534
hepatitis B e antigen-positive chronic hepatitis B patients. Clin Microbiol Infect Off Publ
535
Eur Soc Clin Microbiol Infect Dis 2016 ; 22:571.e5–9.
536
38. Lin C-L, Kao J-H. Hepatitis B Virus Genotypes and Variants. Cold Spring Harb Perspect
537
Med 2015 ; 5:a021436–a021436.
39. Crane M, Sirivichayakul S, Chang JJ, et al. No Increase in Hepatitis B Virus (HBV)-Specific
539
CD8+ T Cells in Patients with HIV-1-HBV Coinfections following HBV-Active Highly Active
540
Antiretroviral Therapy. J Virol 2010 ; 84:2657–65.
541
40. Thio CL. Hepatitis B and human immunodeficiency virus coinfection. Hepatology 2009 ;
542
49:S138–45.
543
41. Wang M-L, Liao J, Wei B, et al. Comparison of hepatitis B virus core-related antigen and
544
hepatitis B surface antigen for predicting HBeAg seroconversion in chronic hepatitis B
545
patients with pegylated interferon therapy. Infect Dis 2018 ; 50:522–30.
546
42. Maylin S, Boyd A, Lavocat F, et al. Kinetics of hepatitis B surface and envelope antigen
547
and prediction of treatment response to tenofovir in antiretroviral-experienced HIV–
548
hepatitis B virus-infected patients: AIDS 2012 ; 26:939–49.
549
43. Boyd A, Maylin S, Gozlan J, et al. Use of hepatitis B surface and “e” antigen quantification
550
during extensive treatment with tenofovir in patients co-infected with HIV-HBV. Liver Int
551
2015 ; 35:795–804.
552
Table 1. Baseline characteristics of patients treated with tenofovir HBeAg status pa HBeAg-positive (n = 95) HBeAg-negative (n = 63) Demographics Male sexb 89 (93.7) 44 (69.8) <0.001 Age (years)c 40.3 (35.0-46.7) 41.6 (37.2-49.6) 0.26
From zone of high HBV-prevalenceb 8 (8.4) 32 (50.8) <0.001
BMI (Kg/m2)c [N=153] 22.4 (20.9-23.9) 22.8 (21.0-25.8) 0.27
HIV infection
Estimated duration of HIV infection, yearsc [N=157] 12.0 (7.7-15.3) 8.3 (5.0-14.4) 0.007
AIDS-defining eventb 29 (30.5) 10 (15.9) 0.04
HIV-RNA (log10 copies/mL)c [N=157] 1.7 (1.7-4.0) 1.7 (1.7-3.2) 0.03
HIV-RNA > 50 copies/mLb [N=157] 45 (47.8) 22 (34.9) 0.11
CD4+ cell count (cells/µL)c [N=157] 423 (312-580) 388 (277-543) 0.24
Nadir CD4+ cell count (cells/µL)c [N=143] 230 (78-321) 212 (118-324) 0.9
Duration of ART (years)c 7.0 (4.8-9.2) 6.1 (3.2-9.0) 0.17
Viral hepatitis
Estimated duration of HBV infection (years)c [N=157] 7.9 (3.8-11.8) 7.7 (3.6-13.1) 0.8
HBV-genotypeb [N=104] A D E G 55 (67.1) 7 (8.5) 4 (4.9) 12 (14.6) 13 (59.1) 1 (4.6) 8 (36.4) 0 (0) 0.5 0.5 <0.001 0.05
Precore mutationb [N=101] 13 (15.9) 9 (47.4) 0.003
Concomitant LAM treatmentb 67 (70.5) 39 (61.9) 0.26
HBV-DNA (log10 IU/mL)c [N=157] 6.6 (4.2-7.6) 1.9 (1.6-3.0) <0.001
HBV-DNA <60 IU/mLb [N=157] 3 (3.2) 31 (49.2) <0.001
ALT (IU/L)c [N=155] 63 (39-97) 28 (21-40) <0.001
AST (IU/L)c [N=155] 44 (31-78) 27 (24-37) <0.001
HBV serological markers
qHBsAg (log10 IU/mL)c [N=157] 4.7 (4.3-5.1) 3.5 (3.3-3.9) <0.001
qHBeAg level (PEIU/mL)c [N=70] 862 (328-1099)
qHBcrAg level (log10 U/mL)c 7.8 (7.0-8.2) 3.0 (2.5-4.0) <0.001
qAnti-HBc level (log10 PEIU/mL)c 2.8 (1.1-4.0) 3.4 (3.0-3.9) 0.008
ALT, alanine aminotransferase; AST, aspartate aminotransferase; ART, antiretroviral treatment; BMI, body mass index; HBeAg, hepatitis B e antigen; HBV, hepatitis B virus; LAM, lamivudine; PEIU, Paul Ehrlich Institute units; qAnti-HBc, quantified anti-hepatitis B core antibody; qHBcrAg, quantified hepatitis B core-related antigen; qHBeAg, quantified hepatitis B e antigen; qHBsAg, quantified hepatitis B surface antigen.
aComparing HBeAg-positive versus HBeAg-negative patients; significance determined using Kruskal–Wallis test for continuous
variables and Pearson’s X2-test or Fisher’s exact test for categorical variables. bNumber (%).
Table 2. Baseline determinants of hepatitis B core-related antigen and anti-hepatitis B core antibody
qHBcrAg (log10 U/mL) qAnti-HBc (log10 PEIU/mL)
Univariable Multivariable Univariable Multivariable
Coef. (95% CI) p Coef. (95% CI) p Coef. (95% CI) p Coef. (95% CI) p
Age (per year) -0.047 (-0.092, -0.002) 0.04 0.031 (0.002, 0.061) 0.04 0.023 (-0.004, 0.051) 0.09 Sex (male) 2.084 (1.115, 3.052) <0.001 -0.242 (-0.908, 0.424) 0.5
From zone of high HBV-prevalencea -2.545 (-3.303, -1.786) <0.001 0.605 (0.053, 1.157) 0.03
BMI (per kg/m²) [N=153] -0.099 (-0.225, 0.027) 0.12 -0.018 (-0.103, 0.066) 0.7
AIDS-defining illness 0.915 (0.061, 1.768) 0.04 0.555 (-0.025, 1.135) 0.06 -0.743 (-1.295, -0.191) 0.009 -0.523 (-1.039, -0.007) 0.047 HIV-infection duration (per year) [N=157] 0.064 (-0.006, 0.134) 0.07 -0.005 (-0.052, 0.041) 0.8
HBV-infection duration (per year) [N=157]a -0.062 (-0.124, -0.0001) 0.05 0.031 (-0.010, 0.072) 0.14
HIV-RNA (per log10 copies/mL) [N=157] 0.232 (-0.069, 0.533) 0.13 -0.226 (-0.421, 0.032) 0.02
CD4 cell count [N=157] per 100 /mm3 > 350 /mm3 0.016 0.279 (-0.143, 0.175) (-0.504, 1.061) 0.8 0.5 0.193 0.432 (0.094, 0.292) (-0.074, 0.938) <0.001 0.09 0.198 0.105, 0.292) <0.001 CD4 nadir (> 250 cells/mm3) [N=143] 0.203 (-0.602, 1.009) 0.6 0.520 (0.022, 1.018) 0.04
Duration of ART (per year) -0.040 (-0.143, 0.062) 0.4 0.015 (-0.052, 0.082) 0.7 Concomitant LAM treatment 0.477 (-0.314, 1.268) 0.24 -0.344 (-0.859, 0.171) 0.19
Cumulative LAM duration (per year) 0.074 (-0.050, 0.197) 0.24 0.005 (-0.075, 0.086) 0.9
HBeAg-positivea 4.153 (3.765, 4.540) <0.001 -0.949 (-1.423, -0.475) <0.001 -0.943 (-1.399, -0.487) <0.001
Precore mutation [N=101] -0.724 (-1.643, 0.196) 0.12 -0.591 (-1.424, 0.241) 0.16
HBV-DNA (per log10 IU/mL) [N=157] 0.726 (0.621, 0.831) <0.001 0.622 (0.507, 0.737) <0.001 -0.029 (-0.130, 0.073) 0.6
ALT (per IU/mL) [N=155] 0.010 (0.006, 0.014) <0.001 0.001 (-0.001, 0.004) 0.4 AST (per IU/mL) [N=155] 0.024 (0.015, 0.032) <0.001 0.001 (-0.005, 0.007) 0.8 ALT < 70 IU/mL [N=155] -2.680 (-3.423, -1.937) <0.001 -1.145 (-1.776,-0.513) <0.001 0.277 (-0.283, 0.837) 0.3 AST < 70 IU/mL [N=155] -2.639 (-3.527, -1.751) <0.001 0.201 (-0.443, 0.844) 0.5 qHBsAg level (log10 IU/mL) [N=157] 1.535 (1.246, 1.824) <0.001 -0.160 (-0.406, 0.087) 0.20
qHBeAg level (log10 PEIU/mL) [N=70] 0.571 (0.269, 0.873) <0.001 0.0001 (-0.001, 0.001) 0.8
ALT, alanine aminotransferase; AST, aspartate aminotransferase; ART, antiretroviral treatment; BMI, body mass index; HBeAg, hepatitis B e antigen; HBV, hepatitis B virus; LAM, lamivudine; PEIU, Paul Ehrlich Institute units; qAnti-HBc, quantified anti-hepatitis B core antibody; qHBcrAg, quantified hepatitis B core-related antigen; qHBeAg, quantified hepatitis B e antigen; qHBsAg, quantified hepatitis B surface antigen.
aThe following variables were not considered in multivariable analysis: both models – HBV and HIV-infection duration (unable to assess true infection duration), zone of HBV-prevalence,
sex (collinear with other variables), AST < 70 IU/mL (preferred over other transaminase variables) and HIV RNA (no longer below p-value threshold); qHBcrAg – HBeAg status, precore mutation and qHBsAg (collinearity) ; qAnti-HBc –CD4+ nadir >250/mm3, concomitant LAM treatment, and precore mutation (no longer below p-value threshold).
Table 3. Kinetics of hepatitis core-related antigen and anti-hepatitis B core antibody during follow-up
Decline in qHBcrAg log10 U/mL per month a Decline in qAnti-HBc log10 PEIU/mL per month a
HBeAg+ HBeAg- HBeAg+ HBeAg-
<18 months Δ (95% CI) p for intxa >18 months Δ (95% CI) p for intx Δ (95% CI) p for intx Δ (95% CI) p for intx Δ (95% CI) p for intx Overall N = 95 N = 63 N=95 N=63 -0.051 (-0.062, -0.040) -0.011 (-0.024, 0.003) -0.003 (-0.006, -0.001) -0.011 (-0.013, -0.009) -0.011 (-0.013, -0.009) HBV genotype N = 82 N = 22 N=82 N=22 A -0.054 (-0.068, -0.040) 0.9 -0.068 (-0.090, -0.045) 0.29 0.001 (-0.006, 0.008) 0.01 -0.014 (-0.016, -0.012) 0.02 -0.005 (-0.011, 0.001) 0.6 D -0.024 (-0.064, 0.017) 0.12 -0.038 (-0.054, -0.021) 0.4 -0.018 (-0.029, -0.008) <0.001 -0.009 (-0.014, -0.003) 0.08 -0.002 (-0.012, 0.008) 0.4 E -0.041 (-0.092, 0.011) 0.7 -0.041 (-0.060, -0.019) 0.9 -0.003 (-0.015, 0.008) 0.9 -0.013 (-0.020, -0.005) 0.9 -0.011 (-0.021, -0.002) 0.17 G -0.075 (-0.117, -0.034) 0.27 -0.049 (-0.065, -0.033) 0.24 - -0.013 (-0.018, -0.008) 0.9 - - YMDD mutationb N = 82 0.17 0.07 N = 21 N=82 0.6 N=21 Yes -0.070 (-0.094, -0.046) -0.044 (-0.060, -0.028) - -0.014 (-0.018, -0.011) - - No -0.051 (-0.065, -0.036) -0.011 (-0.015, -0.007) -0.004 (-0.010, 0.002) -0.014 (-0.016, -0.011) -0.070 (-0.132, -0.008) Precore mutationc N = 82 0.3 0.9 N = 19 0.009 N=82 0.5 N=19 0.3 Yes -0.048 (-0.083, -0.014) -0.049 (-0.064, -0.033) -0.007 (-0.014, -0.001) -0.012 (-0.016, -0.007) -0.004 (-0.010, 0.002) No -0.053 (-0.067, -0.040) -0.011 (-0.014, -0.007) 0.005 (-0.003, 0.014) -0.013 (-0.016, -0.011) -0.009 (-0.017, -0.001)
HBeAg, hepatitis B e antigen; HBV, hepatitis B virus; PEIU, Paul Ehrlich Institute units; qAnti-HBc, quantified anti-hepatitis B core antibody; qHBcrAg, quantified hepatitis B core-related antigen.
Decline in markers were determined using a mixed-effect linear model adjusted for baseline levels, body mass index, age, concomitant lamivudine treatment, cumulative treatment duration with lamivudine, HBV-DNA level and CD4+ cells count (if not stratified).
a Slopes were compared between determinant groups, p values derived from a Wald X2- test of an interaction term (calculated as the cross-product between duration of tenofovir
treatment and presence of determinant), which is included in a mixed-effect linear model with its individual components.
b Mutation at position rtM204 of the pol gene.
c Mutation in the nucleotide at position 1896 (G versus A) of the precore region.
Baseline CD4+ cell count N = 95 0.6 0.9 N = 62 0.06 N=95 0.001 N=62 0.006
>350 cells/mm3 -0.052(-0.066, -0.038) -0.050 (-0.069, -0.031) -0.002 (-0.006, 0.001) -0.015 (-0.017, -0.012) -0.010 (-0.013, -0.007)
<350 cells/mm3 -0.046 (-0.064, -0.027) -0.008 (-0.012, -0.003) -0.006 (-0.010, -0.003) -0.010 (-0.013, -0.007) -0.062 (-0.095, -0.030)
Nadir CD4+ cell count N=87 0.60 0.10 N=56 0.3 N=87 0.004 N=56 0.007
>200 cells/mm3 -0.047 (-0.063, -0.031) -0.066 (-0.082, -0.049) -0.004 (-0.008, -0.001) -0.015 (-0.018, -0.013) -0.009 (-0.012, -0.007)
Table 4 – Factors associated to HBeAg-seroclearance during follow-up
Risk-Factor Univariable Multivariable Model 1a Multivariable Model 2b
HR (95%CI) p HR (95%CI)c p HR (95%CI) p
Age at baseline (per year) 1.04 (0.99-1.09) 0.10
Male versus female sex 1.77 (0.24-12.92) 0.6
From zone of high HBV-prevalence 0.89 (0.17-4.78) 0.9
BMI at baseline (per kg/m²) 0.94 (0.82-1.06) 0.3
AIDS-defining illness at baseline 1.35 (0.60-3.01) 0.5
HIV-infection duration at baseline (per year) 0.99 (0.91-1.09) 0.9
HBV infection duration at baseline (per year) 0.97 (0.91-1.04) 0.4
HIV-RNA(per log10 copies/mL)d 1.00 (0.95-1.06) 0.9
CD4 cell countd
per 100mm3 1.00 (0.99-1.01) 0.8
>350/mm3 1.06 (0.98-1.14) 0.16
Duration of ART (per year)d 1.00 (0.99-1.01) 0.3
Concomitant LAM treatmentd 1.01 (0.98-1.05) 0.4
Cumulative LAM duration (per year)d 1.00 (0.99-1.01) 0.3
HBV-DNA at baseline (per log10 IU/mL) 0.89 (0.73-1.08) 0.24
HBV-DNA (per log10 IU/mL)d 1.01 (0.99-1.03) 0.32
ALT (per 10 IU/mL)d 1.00 (0.99-1.01) 0.26
Baseline qHBsAg level (log10 IU/mL) 0.46 (0.26-0.83) 0.009
Baseline qHBeAg level <100 PEIU/mL
Baseline qHBeAg level <10 PEIU/mL
Baseline qHBeAg level (per PEIU/mL)
2.64 (0.99-7.05) 6.64 (2.40-18.36) 0.47 (0.30-0.72) 0.05 <0.001 0.001
Baseline qHBcrAg level (per log10 U/mL) 0.49 (0.34-0.71) <0.001 0.48 (0.33 – 0.70) <0.001
Baseline qAnti-HBc level (per log10 PEIU/mL) 1.49 (1.08-2.07) 0.02 1.49 (1.08-2.07) 0.02
ALT, alanine aminotransferase; ART, antiretroviral treatment; BMI, body mass index; HBeAg, hepatitis B e antigen; HBV, hepatitis B virus; HR, hazard ratio; LAM, lamivudine; PEIU, Paul Ehrlich Institute units; qAnti-HBc, quantified anti-hepatitis B core antibody; qHBcrAg, hepatitis B core-related antigen; qHBeAg, quantified hepatitis B e antigen; qHBsAg, quantified hepatitis B surface antigen. Analysis on the 95 HBeAg-positive patients, among whom 26 had HBeAg-loss.
In multivariable analysis, qHBeAg and qHBsAg were not further considered as the intent was to study qHBcrAg and qAnti-HBc antibodies. Univariable HR are provided for comparison.
b Model 2: the following variables were no longer below the p-value threshold – age at baseline, CD4 cell count >350/mm3 and per 250/mm3 change from prior visit. c All HR are adjusted for the variables listed in the column.
Table 5. Quantifiable HBV markers in predicting HBeAg seroclearance
Criteria N Classification Probabilities a M24 n=78 M36 n=63 M48 n=40 M60 n=34 M72 n=27 M96 n=13 Se Sp Se Sp Se Sp Se Sp Se Sp Se SpqHBcrAg (log10 U/mL)
<7.5 at baseline 95 0.86 0.61 0.66 0.61 0.73 0.65 0.72 0.67 0.69 0.70 0.58 0.79
<6.5 at M12 95 0.82 0.67 0.77 0.68 0.71 0.70 0.69 0.72 0.70 0.76 0.60 0.87
<6.5 at M24 84 †† †† 1 0.58 0.97 0.61 0.94 0.64 0.96 0.69 0.80 0.82
<6.5 at M36 76 †† †† †† †† 1 0.42 1 0.44 1 0.48 0.85 0.58
qAnti-HBc (log10 PEIU/mL)
>4.1 at baseline 95 0.51 0.80 0.42 0.81 0.44 0.83 0.43 0.84 0.41 0.86 0.33 0.95
qHBcrAg <7.5 and qAnti-HBc >4.1 95 0.37 0.89 0.31 0.90 0.32 0.91 0.30 0.92 0.27 0.94 0.21 0.98
qHBcrAg <7.5 or qAnti-HBc >4.1 95 1 0.52 0.78 0.52 0.85 0.56 0.87 0.59 0.84 0.63 0.69 0.73
HBV- at M12 95 0.92 0.60 0.76 0.61 0.77 0.64 0.68 0.64 0.63 0.66 0.53 0.72
HBV- at M24 84 †† †† 1 0.33 1 0.35 1 0.37 1 0.41 0.92 0.52
HBV- at M36 76 †† †† †† †† 1 0.17 1 0.18 1 0.20 0.91 0.22
HBV, hepatitis B virus; qAnti-HBc, quantified anti-hepatitis B core antibody; qHBcrAg, quantified hepatitis B core-related antigen Analysis on 95 HBeAg-positive patients, among whom 26 had HBeAg seroclearance.
a As sensitivity (Se) and specificity (Sp) are calculated from survival probabilities, all patients (N) are included in analysis. b HBV- was defined as <60 IU/mL
For information, the number of patients (n) considered (i.e. those not lost to follow-up or having HBeAg seroclearance) during each time-interval has been included.