ORIGINAL ARTICLE
Lack of parvalbumin in mice leads to behavioral deficits
relevant to all human autism core symptoms and related neural
morphofunctional abnormalities
M Wöhr
1,7, D Orduz
2,7, P Gregory
3, H Moreno
4, U Khan
4, KJ Vörckel
1, DP Wolfer
5,6, H Welzl
5, D Gall
2, SN Schiffmann
2and B Schwaller
3Gene mutations and gene copy number variants are associated with autism spectrum disorders (ASDs). Affected gene products are
often part of signaling networks implicated in synapse formation and/or function leading to alterations in the excitation/inhibition
(E/I) balance. Although the network of parvalbumin (PV)-expressing interneurons has gained particular attention in ASD, little is
known on PV
’s putative role with respect to ASD. Genetic mouse models represent powerful translational tools for studying the role
of genetic and neurobiological factors underlying ASD. Here, we report that PV knockout mice (PV
−/−) display behavioral
phenotypes with relevance to all three core symptoms present in human ASD patients: abnormal reciprocal social interactions,
impairments in communication and repetitive and stereotyped patterns of behavior. PV-depleted mice also showed several signs of
ASD-associated comorbidities, such as reduced pain sensitivity and startle responses yet increased seizure susceptibility, whereas
no evidence for behavioral phenotypes with relevance to anxiety, depression and schizophrenia was obtained. Reduced social
interactions and communication were also observed in heterozygous (PV
+/−) mice characterized by lower PV expression levels,
indicating that merely a decrease in PV levels might be suf
ficient to elicit core ASD-like deficits. Structural magnetic resonance
imaging measurements in PV
−/−and PV
+/−mice further revealed ASD-associated developmental neuroanatomical changes,
including transient cortical hypertrophy and cerebellar hypoplasia. Electrophysiological experiments
finally demonstrated that the
E/I balance in these mice is altered by modi
fication of both inhibitory and excitatory synaptic transmission. On the basis of the
reported changes in PV expression patterns in several, mostly genetic rodent models of ASD, we propose that in these models
downregulation of PV might represent one of the points of convergence, thus providing a common link between apparently
unrelated ASD-associated synapse structure/function phenotypes.
Translational Psychiatry (2015)
5, e525; doi:10.1038/tp.2015.19; published online 10 March 2015
INTRODUCTION
Autism spectrum disorders (ASDs) comprise a series of related
neurodevelopmental disorders characterized by deficits in social
interaction, reduced/impaired communication and restricted and
stereotyped behavior.
1Anxiety, motor and sensory impairments,
reduced nociception, increased seizure susceptibility and
intellec-tual disability are common comorbidities.
1Recent data indicate
that ~1/100 children displays symptoms or mild signs related to
ASD.
1Results from many studies indicate a strong genetic
component, and a plethora of gene mutations and/or copy
number variants have been identi
fied in ASD patients.
2Most ASD
candidate gene products are involved in activity-dependent
neuronal signaling and are (i) implicated in synapse formation/
maintenance (for example, neurexins and neuroligins), (ii) proteins
of synaptic membranes (for example, kainate-type glutamate
receptor GluR6), (iii) scaffolding proteins in the postsynaptic
density (for example, Shank1/2/3) or (iv) proteins involved in
signaling pathways relaying information from the synapse to the
nucleus.
3,4At the functional level, these mutations are thought to
finally translate into changes in the excitation/inhibition (E/I)
balance.
3,4Alterations in any ASD candidate gene only accounts for a
minority of ASD cases, suggesting that they might be part of
convergent
molecular
pathways.
Genome-wide
association
studies
5,6and transcriptomic co-expression network analyses
7have identi
fied ASD risk gene networks. The top connections in
one of the neuron-speci
fic modules (‘Grey60’) contain the genes
KCNC1, SCN1B, PVALB and HAPLN4,
6all highly expressed in
fast-spiking parvalbumin (PV)-expressing (PV
+) cortical interneurons.
8As the top module M12 (ref. 7) strongly overlaps with the PVALB+
interneuron module
9and most transcripts, including PVALB and
DLX1, are downregulated in ASD brains, these two genes and/or
gene products were proposed as ASD-related candidates.
7To our
knowledge, no mutations in the human PVALB gene have been
reported up to now, neither in ASD nor other neurodevelopmental
disorders. However, decreased PV expression (protein and
messenger RNA) and/or loss of PV
+neurons were reported not
only in ASD patients,
10,11but also in other neurodevelopmental
disorders, such as schizophrenia and bipolar disorder.
12Initially,
1
Department of Behavioral Neuroscience, Faculty of Psychology, Philipps-University of Marburg, Marburg, Germany;2Laboratory of Neurophysiology, ULB Neuroscience Institute (UNI), Université Libre de Bruxelles (ULB), Brussels, Belgium;3
Anatomy Unit, Department of Medicine, University of Fribourg, Fribourg, Switzerland;4
Department of Neurology, SUNY Downstate Medical Center, The Robert F Furchgott Center for Neural and Behavioral Science, Brooklyn, NY, USA;5
Institute of Anatomy, Faculty of Medicine, University of Zürich, Zürich, Switzerland and6
Institute of Human Movement Sciences and Sport, ETH Zürich, D-HEST, Zürich, Switzerland. Correspondence: Dr B Schwaller, Anatomy, Department of Medicine, University of Fribourg, Route Albert-Gockel 1, Fribourg CH 1700, Switzerland.
E-mail: [email protected]
7
These authors contributed equally to this work.
Received 21 January 2014; revised 29 December 2014; accepted 12 January 2015
the decrease in the number and/or density of PV-immunoreactive
(PV
+) neurons was assumed to be the result of a loss/decrease of
this neuron subpopulation in affected patients,
10but the weaker
in situ hybridization signals observed in
five out of eight ASD
children were viewed as PVALB messenger RNA downregulation.
11Also others postulated PV downregulation (not PV
+-neuron loss)
as an adaptive/homeostatic mechanism.
12,13Genetic mouse models are powerful translational tools for
studying the role of those genes in the etiology of ASD.
14–17Such
mutations cause effects at various levels, from cell biology and
morphology to electrophysiology and behavior. The network of
PV
+neurons was analyzed in many studies, including not only
genetic models of ASD focusing on the impact of Cntnap2,
18Met,
19Fmr1,
20Nlgn3
R451C(ref. 21) and Nrp2,
22but also
environ-mental ASD models, with the valproic acid model probably being
the most prominent one.
21Most of these studies reported
‘a
reduction in the number of PV
+neurons
’ by ~20–25% (for details,
see Supplementary Table 1). Constitutive PV
−/−mice enabled us to
directly address the role of PV in this ASD-linked neuronal
subpopulation. Importantly, there is no evidence of a loss of
‘PV
+’
neurons in PV
−/−mice in various brain regions, including
hippocampus
23and cortex.
24Yet the absence of the Ca
2+buffer
PV profoundly affects synaptic transmission; PV prevents/delays
short-term facilitation
25–27and reduces gamma power of
asso-ciated hippocampal oscillations.
23PV affects neuron-firing timing
and consequently in
fluences the desynchronization of neuronal
networks in the cortex,
28decreases spiking rhythmicity in striatal
fast-spiking interneurons (FSIs)
27and modulates burst-
firing
properties in the thalamic reticular nucleus.
29These results from
PV
−/−mice indicate an activity-dependent increase in inhibition in
the absence of PV, thus shifting the E/I balance towards increased
inhibition, as reported in the neuroligin-3 knock-in ASD mouse
model NL3
R451C.
30The decreased PV levels and/or density of PV
+neurons reported
in several pathological conditions, including ASD, led us to
conduct a comprehensive set of behavioral phenotyping assays in
PV
−/−mice, using well-established paradigms with high relevance
and sensitivity for the diagnostic and associated symptoms of
ASD.
14–17PV
−/−mice not only display typical ASD-like phenotypes
with relevance to all human autism core symptoms, that is,
impaired social interactions, communication de
ficits and rigid/
repetitive behaviors, but also reduced nociception and startle
responses, as well as increased seizure susceptibility, viewed as
ASD-associated comorbidities. At the neuroanatomical level, PV
−/−mice show transient cerebral hypertrophy and cerebellar
hypo-plasia as juveniles at postnatal day (PND) 20, resembling
morphological changes previously reported in ASD patients.
31,32Finally, the absence of PV not only affects inhibitory synaptic
transmission, but also excitatory transmission onto PV
+FSI is
impaired, resulting in an altered E/I balance. Results obtained in
PV
+/−mice with a reduction of brain PV levels by ~60
–70% further
indicate that merely a downregulation of PV might be suf
ficient to
elicit core ASD-like de
ficits.
MATERIALS AND METHODS
Animals
Wild-type PV+/+, heterozygous PV+/− and homozygous PV−/− mice (all
littermates from heterozygous breedings, unless otherwise stated) used in the experiments were male (unless specified otherwise). They were all raised on a C57BL/6J background (backcrossed to C57BL/6J for 410 generations, as described previously33). Animals were genotyped by PCR.24 All animal experiments were carried out in accordance with local animal care legislation and to current Swiss law and EC Council Directive of 24/11/ 86 (86/609/EEC). Prior to and following experimentation, all animals were group housed and maintained on a 12-h light/dark cycle, with ad libitum access to standard rodent chow and water.
Reciprocal social interaction
To measure reciprocal social interaction behavior, pairs of juvenile mice were allowed to socially interact at PND25 ± 1 for 5 min after one mouse of the pair being habituated to the test environment for 1 min. Same-sex/ same-genotype pairs consisting of non-littermates were used. To enhance the level of social motivation, juvenile mice were socially isolated for 24 h prior to testing. Testing was performed in a clean Makrolon Type III cage with fresh bedding and a metal lid under dim red light. Behavior was recorded using a video camera placed 30 cm away from the cage. Reciprocal social interactions were tested between 0800 and 1800 hours during the light phase of the 12:12 h light/dark cycle.
Social interactions were scored by an experienced observer blind to the experimental conditions using the Noldus The Observer XT 10.0 software (Noldus Information Technology, Wageningen, The Netherlands). Param-eters of social behaviors included facial sniffing (sniffing the nose and snout region of the partner), anogenital sniffing (sniffing the anogenital region of the partner), following (walking straight behind the partner, keeping pace with the one ahead), push past (squeezing between the wall and the partner), crawling under/over (pushing the head underneath the partner’s body or crawling over or under the partner’s body), social grooming (grooming the partner) and being socially inactive while having social contact (lyingflat or standing still while maintaining close physical contact with the partner; for details see Yang et al.17and Terranova and Laviola34). All social behaviors were analyzed for frequency of occurrence
(that is, number of bouts) and duration in 1-min time bins. In addition to social behaviors, nonsocial behaviors were measured and included rearing (number of times an animal reared on its hind legs), grooming (number of bouts of face, body and genital grooming movements) and digging (number of bouts of digging in the bedding, pushing and kicking it around).
Ultrasonic vocalizations
Isolation-induced ultrasonic vocalizations in mouse pups. To induce ultrasonic vocalizations (USV) in pups, they were isolated from their mother and littermates on PND8 for 10 min at room temperature (22–24 °C). As described previously,35,36pups were removed individually from the nest at random and gently placed into an isolation container (10 × 8 × 7 cm; open surface) made of glass, containing clean bedding material. The isolation container was surrounded by a sound-attenuating box (20 × 20 × 20 cm) made of Styrofoam (thickness of walls: 4 cm). USV emission was monitored by an UltraSoundGate Condenser CM 16 Microphone (Avisoft Bioacoustics, Berlin, Germany) placed in the roof of the sound-attenuating box, 20 cm above the floor. After the 10-min isolation period, body weight and body temperature were determined. Body weight was measured using a palm scale (PS6-250; My Weigh Europe, Hückelhoven, Germany). For body temperature determination a Testo 110 thermometer (Testo Lenzkirch, Germany) was used. In addition, the following somatosensory reflexes were determined: surface righting and vertical screen holding. To measure the righting reflex, pups were placed on their back on aflat, hard surface, and a stopwatch was used to measure the time that it took to right themselves on all four paws (maximum: 30 s). To measure vertical screen holding, pups were placed on a wire mesh screen (8 × 11 cm) that was slanted vertically at an angle of 90°. Length of time the pup was able to stay on the grid at an angle of 90° was measured using a stopwatch (maximum: 30 s). Then, pups were marked with a paw tattoo for identification, using nontoxic animal tattoo ink (Ketchum permanent Tattoo Inks green paste, Ketchum Manufacturing, Brockville, ON, Canada). The ink was inserted subcutaneously through a 30-gauge hypodermic needle tip into the center of the paw. Pup isolation, determination of somatosensory reflexes and paw marking occurred between 0800 and 1800 hours during the light phase of the 12:12 h light/ dark cycle. Prior to each test, behavioral equipment was cleaned using a 0.1% acetic acid solution, followed by water and dried with paper towels. Interaction-induced USV in juvenile mice. To induce USV in juvenile mice, pairs of juvenile mice were allowed to socially interact at PND25 ± 1 for 5 min after one mouse of the pair being habituated to the test environment for 1 min. Same-sex/same-genotype pairs consisting of non-littermates were used. To enhance the level of social motivation, juvenile mice were socially isolated for 24 h prior to testing. Testing was performed in a Makrolon Type III cage with clean bedding and metal lid under dim red light. USV emission was monitored by an UltraSoundGate Condenser CM 16 Microphone (Avisoft Bioacoustics) placed 15 cm above the cage lid. Reciprocal social interactions were tested between 0800 and 1800 hours
during the light phase of the 12:12 h light/dark cycle. Clean cages and lids were used for reciprocal social interactions.
Female-induced USV in adult male mice. To induce USV in adult male mice, male mice at PND ~120 were exposed to a wild-type female for 5 min after being habituated to the test environment for 1 min. Testing was performed in a Makrolon Type III cage with clean bedding and a metal lid under dim red light. USV emission was monitored by an UltraSoundGate Condenser CM 16 Microphone (Avisoft Bioacoustics) placed 15 cm above the cage lid. Female exposure occurred between 0800 and 1800 hours during the light phase of the 12:12 h light/dark cycle. Clean cages and lids were used for all female exposures.
Acoustical recording. UltraSoundGate Condenser CM 16 Microphones (Avisoft Bioacoustics) used for USV recordings were connected via an UltraSoundGate 416H USB audio device (Avisoft Bioacoustics) to a personal computer, where acoustic data were recorded with a sampling rate of 250 000 Hz in 16-bit format by Avisoft RECORDER USGH (Avisoft Bioacoustics). The microphones are sensitive to frequencies of 15– 180 kHz with aflat frequency response (±6 dB) between 25 and 140 kHz. Acoustical analysis. For acoustical analysis, recordings were transferred to Avisoft SASLab Pro (version 4.50; Avisoft Bioacoustics) and a fast Fourier transform was conducted (512 fast Fourier transform length, 100% frame, Hamming window and 75% time window overlap). Correspondingly, the spectrograms were produced at 488 Hz of frequency resolution and 0.512 ms of time resolution. Call detection of isolation-induced USV emitted by pups was provided by an automatic amplitude threshold-based algorithm and a hold-time mechanism (hold time: 10 ms). As no USV were detected below 30 kHz, a high-passfilter of 30 kHz was used to reduce background noise outside the relevant frequency band to 0 dB. The accuracy of call detection by the software was verified manually by an experienced user. When necessary, missed calls were marked by hand to be included in the automatic parameter analysis. Interaction-induced and female-induced USV were analyzed interactively by an experienced user to avoid false positives due to high levels of background noise resulting from the animals’ movements. Total number of USV was calculated for the entire session and in 60-s time bins to visualize the time course of the USV response. Additional parameters, based on previous USV studies,35,36
included peak frequency and peak amplitude, that is, loudness, which were derived from the average spectrum of the entire call, were determined automatically. Peak amplitude was defined as the point with the highest energy within the spectrum. Peak frequency was defined as the frequency at the location of the peak amplitude within the spectrum. In addition, the extent of frequency modulation, the difference between the lowest and the highest peak frequency within each call, was measured automatically. Temporal parameters included latency to start calling, total calling time and call duration. The experienced user was blind to the experimental conditions.
Repetitive and stereotyped patterns of behavior
T-maze reversal learning paradigm. Male PV+/+(n = 9) and PV−/−(n = 8)
mice were tested for restrictive, repetitive behavior using a T-maze reversal paradigm.37 The mice were first habituated to the maze (entry arm:
35 × 10 cm, T-arms, 40 × 10 cm each, as described previously37) over 5 days immediately prior to the experiment. An appetitive reward (in this case ~200μl of malted chocolate milk) was placed in a shallow container in one of the short arms of the T-maze and the mouse was trained to retrieve it in 10 consecutive, daily trials until it had reached the criterion, in this case at least 70% of the mice had to enter the correct arm and at least partially consume the reward in at least 8/10 trials on three consecutive days. If a mouse failed to enter either arm, entered the wrong arm or entered the correct arm but failed to consume the reward, this was scored as an incorrect response. The mouse was allowed 3 min to complete each trial. In order that the mouse was not guided by olfactory clues, a little of the reward was placed outside of each short arm of the maze for the duration of the trials. Once a mouse had reached acquisition, the reward was swapped into the opposite short arm and 10 daily trials were repeated until the criterion had once again been attained or until the mouse would fail to achieve reversal by 20 days (in which case, if the mouse did not achieve 8/10 correct trials on day 18 post reversal, the mouse was discontinued in the experiment). The mice were scored for the number of correct trials/day during the acquisition and reversal phases, and each group was scored for the percentage of mice achieving acquisition or
reversal. Mice failing to achieve initial acquisition did not proceed to the reversal stage.
Water-maze reversal learning paradigm. Place navigation testing in the Morris water maze (MWM) was performed as described previously38in a round swim tank of 150 cm diameter. The goal platform (14 × 14 cm) was hidden 0.5 cm below the water surface. Animals performed 30 trials (max. duration 120 s), six per day with inter-trial intervals of 30–60 min. During thefirst 18 trials (acquisition), the hidden platform was kept in the same position and then moved to the opposite quadrant for the remaining 12 trials (reversal). Thefirst trial of the reversal phase served as probe trial to test for spatial retention. Trials were tracked using Noldus EthoVision 2.6 (Noldus Information Technology) and transferred to Wintrack 2.4 software (http://www.dpwolfer.ch/wintrack) for analysis.
Radial-maze working-memory task. The radial-maze working-memory procedure39 was implemented and adapted as described previously.40 The apparatus was constructed of gray polyvinyl chloride. Eight arms (7 × 38 cm) with clear Perspex sidewalls (5 cm high) extended from an octagonal center platform (diameter 18.5 cm, distance platform center to end of arm 47 cm). It was placed 38 cm above thefloor in a dimly lit room (4 × 40 W bulbs, 12 lux) rich in salient extra-maze cues (same room as for MWM place navigation task). Small cereal pellets (ca. 6 mg) were placed as baits in small metal cups (diameter 3 cm, 1 cm deep) at the end of each arm, in such a way that the mouse could not see them without completely entering the arm. A reversed box of clear Perspex served to confine the mouse on the center platform before each test session during which the mice were allowed to move freely on the maze. Mice were gradually reduced to and maintained at 85% of their free-feeding body weight using a premeasured amount of chow each day. Water was available ad libitum. Mice performed one trial per day lasting maximally 10 min or until the animal had collected all pellets. They began with two habituation sessions during which they were accustomed to collecting pellets from the maze that were distributed all over the maze. During the following 10 training trials each cup was baited only with one pellet. Behavioral measures: consumption of each pellet was recorded by pressing a designated key on the keyboard. With this information and the video-tracked xy-coordinates (EthoVision 2.6), the following measures were computed: total duration of trial, time spent moving, duration of arm visits, time spent in pellet area, decision time between visits, average velocity, velocity in/out of arms, number of omitted arms, number of bait neglect errors (failure to consume pellet in a baited arm), number of aborted visits (not reaching pellet area), number of working-memory errors (visits to already emptied arms), number of correct choices beforefirst error, correct choices out of first eight, relative frequency of serial choices, relative frequency of repeated angles, relative frequency of a favorite choice angle and number of visits to a favorite arm.
For all experiments on learning and memory, mice were habituated for 7 days to a reversed light/dark cycle, and experiments were performed during their normal active phase.
Rotarod and grip test
Rotarod. Mice were tested on a RotaRod device (TSE Systems, Bad Homburg, Germany) using an accelerating 10–40-r.p.m. protocol. Each mouse performed 12 trials over 2 days, with 6 trials per day separated into two batches of three trials. The mice were allowed to rest for at least 10 min between trials and the two daily batches of trials were separated by at least 2 h. Data were analyzed using the Prism software (GraphPad Software, San Diego, CA, USA) and expressed as average latency to fall, mean ± s.e.m.
Grip test. Forepaw grip strength was measured using a newtonmeter that was attached horizontally and to a metallic ring of 5.5 cm diameter and 3 mm thickness. Mice were held by the tail and allowed to grasp the ring with both forepaws. They were then gently pulled away until they released the ring. Five measurements were obtained each on two consecutive sessions and averaged.41
Open
field
Sixteen PV+/+and 16 PV−/−mice were tested, with approximately balanced representation of genders in both groups. Age at the begining of testing was 10–11 weeks. Prior to testing, mice were habituated for 7 days to reversed 12-h light/dark cycle and experiments performed during the
normal active (dark) phase. The large open-field arena had a diameter of 150 and 35-cm-high walls. Mice were released near the wall and observed for 10 min. This was repeated the following day for a total duration of 20 min, divided into four periods of 5 min for time course analysis. The square-shaped small open-field arena measured 50 × 50 cm. Twenty-four hours prior to testing, the mice were familiarized with a small home box in their homecages. They were then transferred to the open-field arena together with this home box and observed for 30 min.42 In both
experiments, animals were video-tracked using EthoVision 2.3 and data were transferred to Wintrack 2.4 for analysis. To obtain an index of linearity of locomotion, the distance from start to end point was measured for every path segment of 50 cm length and averaged along the path. As a measure of small-scale accelerations and decelerations, a ‘jerkiness’ index was calculated as the sum of unsigned length differences between successive path segments, divided by the distance moved. Because the tracking system also monitored apparent subject area, vertical activity could be estimated by counting reductions of subject area deeper than 250 mm2
while the animal was not engaged in locomotion.
Anxiety
—light/dark box, O-maze
Light/dark box. The light/dark box consisted of a 20 × 30 × 20-cm brightly illuminated chamber with transparent walls connected via a 7.5 × 7.5-cm opening to a 20 × 15 × 20-cm enclosed, dark polyvinyl chloride box. Each subject was released in the middle of the lit compartment and observed for 5 min.
O-maze. The O-maze was a 5.5-cm-wide annular runway with an outer diameter of 46 cm, placed at 40 cm above thefloor. Two opposing 90° sectors were protected by 16-cm-high inner and outer walls of gray polyvinyl chloride. Animals were released in one of the closed sectors and observed for 10 min. In both experiments, animals were video-tracked using EthoVision 2.3 and data were transferred to Wintrack 2.4 for analysis. For experiments on anxiety-related behavior, mice were habituated for 7 days to a reversed light/dark cycle and experiments were performed during their normal active phase.
Startle response and prepulse inhibition
Testing was conducted using a Hamilton-Kinder SM100 startle monitor system (http://www.hamiltonkinder.com, Poway, CA, USA). The rectangular animal restrainer (3.8 × 8.8 cm) was made of clear Perspex and had an adjustable ceiling that was set to prevent the animal from rearing. The restrainer rested on a sensing plate that carried a piezoelectric accelerometer at its bottom. The unit was mounted on a heavy metallic base plate by four mounting pins and enclosed in a sound-attenuated ventilated cabinet (internal dimensions 29 × 29 × 18 cm). The loudspeaker was located 22 cm above the animal and produced white noise pulses. A microcomputer interface controlled the loudspeaker and performed A/D conversion of the signals from the accelerometer. Signal calibration was done using a Newton impulse calibrator. Sound levels were verified using a digital sound level meter (RadioShack). The background noise level inside the closed cabinet was maintained at 70 dB. Subjects were placed in the thoroughly cleaned and dried restrainer and left undisturbed for 5 min before the session began. To record a startle response profile, 66 trials were presented in total after a habituation time of 300 s. Nine different sound levels (dB) were used: 64, 68, 72, 76, 80, 90, 100, 110 and 120. Each stimulus was 40 ms and presented six times in pseudorandom order, such that each sound level occurred once within a block of nine trials. The series began and ended with six presentations each of the 120-dB stimulus. The average inter-trial interval was 15 s (ranging from 10 to 20 s). Background noise is set at 64 dB during the entire session. In order to assess prepulse inhibition, after a habituation period of 300 s, 60 trials were presented in total, which consisted of six trial types. One was a 40-ms, 120-dB startle stimulus. There were four different prepulse plus startle stimulus trials presented, so that the onset of a prepulse stimulus was 100 ms before the onset of the startle stimulus. The 20-ms prepulse stimuli were sounds of 68, 72, 76 or 80 B. Finally, trials where no stimulus was presented served to measure baseline movements. After six presentations of the plain 120-dB startle stimulus, the six trial types were presented nine times in pseudorandom order such that each type occurred once within a block of nine trials. The average inter-trial interval was 15 s (ranging from 10 to 20 s). Mice were habituated for 7 days to a reversed light/dark cycle and experiments were performed during their nor mal active phase.
Nociception
Hot-plate test. The hot-plate test was used to evaluate sensitivity to a painful hind paw stimulus. Nine PV+/+mice (4 males, 5 females) and 10
PV−/− (5 males, 5 females) were individually placed in a transparent cylinder (20 cm diameter) on a 55.0 ± 0.5 °C hot plate, and the latency to thefirst hind paw response—shaking or licking the paw—was recorded. The latency of the response was measured with a stopwatch by an experienced observer. If no such response was observed within 30 s, the animal was removed from the plate to avoid skin damage.
Tail-flick test. To test the heat sensitivity of the tail, each mouse was gently wrapped in a soft towel and placed on a transparent platform with its tail extending into a shallow grove. An infrared beam was applied from below (7370 plantar test; Ugo Basile, Gemonio, Italy, infrared intensity of 50), and tail-flick latencies were automatically recorded. Three trials were run on different areas of the tail with about 1-min inter-trial intervals. If no tailflick was observed within 15 s, the animal was removed from the plate to avoid skin damage.
MRI sequence
A total of 42 male mice were used for the structural magnetic resonance imaging (MRI) analysis. The first groups of mice were imaged in vivo (C57BL/6J (PV+/+); juvenile (PND20): n = 6, adult: n = 12,
age = 14.1 ± 2.8 months; PV−/−: juvenile: n = 6 adult: n = 6, age = 12.9 ± 3.6 months). The second groups consisted of fixed brains within the intact cranium (C57BL/6J (PV+/+); juvenile (PND20): n = 6 and PV+/−; juvenile: n = 6). All mice were imaged with a Bruker AVANCE 400WB (Bruker, NMR, Billerica, MA) spectrometer (nuclear magnetic resonance) outfitted with an 89-mm-bore 9.4 tesla vertical Bruker magnet (Oxford Instruments, Oxford, UK), a birdcage RF probe with 30 mm inner diameter, and a shielded gradient system (100 G cm−1). For the in vivo group, anesthesia was used to immobilize the animals, and to minimize the fear and anxiety induced by the loud environment of the scanner. We used isoflurane for anesthesia; induction phase: 3 volume percent (vol%) and maintenance: 1.1–1.5 vol% at 1 l min−1airflow, via a nose cone, under conditions that do not significantly affect heart rate, respiratory rate or oxygen saturation (SaO2) in C57BL/6J mice.43
Three scout scans were first acquired that enabled to position the subsequent T2-weighted images along the standard anatomical orienta-tions in a reproducible manner. Optimal horizontal images were determined empirically by repositioning the animal to ensure that the animal’s brain was located at the center of the MRI coils. Shimming was performed to optimize B0field homogeneity. By running the auto-shim procedure, the three linear shim channels (x, y and z) were automatically adjusted by means of an iterative software routine that maximized the area of the free inductive decay. T2-weighted images were obtained with a fast spin echo sequence with TR/effective TE = 2000 ms/70 ms, rapid acquisition with relaxation enhancement factor = 16, FOV = 20 mm, acquisition matrix = 256 × 256, 17 slices, with a slice thickness = 0.5 mm and number of excitations = 28. Each set of images required 15 min, andfive sets of images were acquired sequentially to improve SNR.
Fixed brains were imaged using the same MRI sequence; only two sets of images were required to obtain an optimal SNR.
MRI processing
Labeling of the neocortex, cerebellum and hippocampus was conducted in a semi-automated, registration-dependent framework. Such a framework relies on the coregistration of a source image (that is, PV−/−mouse) to a labeled template image. We coregistered T2-weighted MRI volumes of PND20 PV+/+, PV−/−and PV+/−mice independently to a PND0 T2-weighted
atlas developed at the Laboratory of NeuroImaging (www.loni.usc.edu). A PND0 C57BL/6J atlas, as opposed to an adult mouse atlas, was used here in an effort to best match the myelination and gross structural/morphological profiles of the PND20 mice. Labels in atlas space were modified to include the hippocampus as a region distinct from its original (cortical) label, as defined by Laboratory of NeuroImaging.
As the z-plane slice thickness (500μ) of the T2-weighted source acquisitions introduced a sampling and coregistration confound, the coregistration procedure was first carried out as a series of two-dimensional (2D) operations. First, the P0 atlas (50 × 50 × 50μ) and the source T2 volume (86 × 86 × 500μ) were each split into a series of 2D slices along the dorsal–ventral axis, producing 200 2D slices of the P0 atlas, and 24 slices of the source T2-weighted volumes.
Subsequently, an iterative three-degree of freedom 2D coregistration was carried out using the fMRIB analysis group’s linear image registration tool (FLIRT—http://fsl.fmrib.ox.ac.uk/fsl/flirt/). Each slice24 of the source image served as the source slice in the coregistration, whereas each slice of the atlas (200) served as the target slice in the coregistration. Subsequent computation of the correlation ratio of the image pair (transformed source slice and target atlas slice) was computed, and the atlas slice with the best (lowest) similarity score to a transformed source slice was chosen to represent an equivalent section of the source brain. Such a calculation was carried out for each of the coregistrations (200 × 24) to determine the 24 atlas slices that best represented the source brain (Supplementary Figure S7A).
Subsequently, 24 atlas slices were then reassembled into a three-dimensional volume and served as the target of a three-three-dimensional coregistration of the three-dimensional source volume to the reassembled, 24-slice atlas. In addition to a 12-degree of freedom linear registration conducted by FLIRT, the FMRIB’s nonlinear registration tool (fNIRT—http:// fsl.fmrib.ox.ac.uk/fsl/fnirt/index.html) was used to register local deforma-tions necessary to regularize the transformation. The inverse of the linear and nonlinear transformations were then applied both to the template image and its corresponding labels with nearest-neighbor interpolation, to produce a segmented (neocortex, cerebellum and hippocampus) source brain (Supplementary Figure S7B).
Electrophysiology
Slice preparation and FSI visualization. To facilitate FSI identification in control and PV-reduced/deficient conditions, most experiments were performed on mice aged 18–24 days (PND18–24) from the PV-enhanced greenfluorescent protein (EGFP) BAC transgenic mouse line,44 PV-EGFP
PV+/− and PV-EGFP PV−/− mice, respectively (all lines on a C57Bl/6J background). The reduced/deficient lines were obtained by crossing the PV-EGFP mice with PV−/−mice.27 Some recordings were obtained from PV+/+, PV+/− and PV−/− mice at PND18–24, mice as used for all other
experiments. Recordings were obtained at least from 6–8 different animals per genotype, which belonged to 5–6 different litters. A set of experiments with n⩾ 8 embraced at least five different animals per genotype. Mice were decapitated after deep halothane anesthesia. After dissection, brains were rapidly immerged in an ice-cold bicarbonate-buffered saline solution (BBS) at 4 °C with the following composition: 125 mM NaCl, 2.5 mM KCl, 1.25 mMNaH2PO4, 26 mMNaHCO3, 2 mMCaCl2, 1 mMMgCl2, 10 mMglucose
equilibrated with a 95% O2–5% CO2 mixture (pH = 7.3). Cortico-striatal
coronal slices were cut in 250-μm-thick sections using a vibratome (Leica VT1000S; Leica Microsystemes SAS, Nanterre, France) and transferred to an incubation chamber containing the same BBS at 32 °C for at least 1 h before recordings and protected from light. Slices were transferred to a submerged recording chamber perfused with BBS at 22–24 °C with a 1.5 ml min−1flux rate. FSIs were visualized in the striatum with a × 63 water immersion objective of a Zeiss upright microscope (Axioskop 2FS Plus, Zeiss, Oberkochen, Germany) and the intrinsic EGFPfluorescence detected using short pulses of blue light from a source composed of an LED array (OptoLED, Cairn Research, Faversham, UK) emitting at 488 nm and coupled to the microscope that was equipped with a dichroic mirror and a high-pass emissionfilter centered at 505 and 507 nm, respectively. FSIs were visualized with a back-illuminated charge-coupled device camera (iXon+; Andor Technology, Belfast, UK).
Perforated-patch recordings. All recordings were made with a Dual EPC-10 operational amplifier and data were acquired using the software Patch-master (HEKA, Lambrecht-Pfalz, Germany). Using the built-infilter of EPC10, voltage-clamp recordings werefiltered at 2.9 kHz and digitized at 20 kHz. Patch pipettes were made from borosilicate glass capillaries (Hilgenberg Malsfeld, Germany) with a two-stage vertical puller (PIP 5, Heka). Pipette input resistances were in the 5–7-MΩ range. Perforated-patch recordings on FSI were made using a pipette solution containing the following (in mM): 80 K2SO4, 10 NaCl, 15 glucose, 5 HEPES, pH = 7.2 with KOH, 225–
230 mOsm l−1 and 400μg ml−1 amphotericin B. Fresh stocks of the ionophore were prepared every 2 h (4 mg amphotericine B in 50μl dimethyl sulfoxide). Series resistance was monitored to ensure that voltage attenuation in current-clamp mode was alwayso10%. Electrical stimula-tions were performed with a bipolar electrode (Phymep, Paris, France) in the presence of the GABAA blocker, gabazine (10μM). Pulses of 500μs
duration were delivered at 0.25 Hz by increasing the stimulation intensity from 0 to 9 V. These pulses were generated by an Iso-flex stimulus isolation unit (AMPI, Jerusalem, Israel) connected to an output channel of the
amplifier and triggered by the Patchmaster software. When the stimulation amplitude evoked stable excitatory postsynaptic currents (EPSCs) in time, protocols to study unitary properties of EPSC, paired-pulse ratio (PPR) and trains were started. NBQX (2,3-dihydroxy-6-nitro-7-sulfamoyl-benzo[f]qui-noxaline-2,3-dione) and gabazine were dissolved in the bath solution and applied to the preparation by superfusion. The drugs solution reached a steady-state concentration in the experimental chamber within 2 min. After reaching this steady-state period, the response to the drug was measured after a prolonged application (up to 5 min). NBXQ and gabazine were purchased from Sigma-Aldrich (St Louis, MO, USA). Stocks were prepared in water and stored at−20 °C. They were diluted in BBS before bath application.
Dendritic branching counts and measurements
For morphological reconstructions, FSIs were subjected to whole-cell recordings with a pipette solution containing the following (in mM): 150 K gluconate, 4.6 MgCl2, 10 Hepes-K, 1 EGTA-K, 0.4 Na-GTP, 4 Na-ATP, 0.1 CaCl 2, pH = 7.2 and complemented with 0.4% biocytin. A period of 20 min after
whole-cell break-in was respected and a high-resistance outside-out patch was obtained when the pipette was withdrawn. Slices were fixed by overnight immersion in 4% paraformaldehyde at 4 °C, rinsed in phosphate-buffered saline at 0.1 mM and, later, immersed for 2-h periods in a mixture of phosphate-buffered saline/Triton X-100 (0.1 mM and 0.1%, respectively). Biocytin was revealed in red with streptavidin-conjugated NL557 (R&D systems, Minneapolis, MN, USA), diluted 1:5000, always in phosphate-buffered saline/Triton X-100. After afinal rinse in Tris-buffered saline (TBS), slices were mounted on coverslips with FlourSave reagent (EMD Millipore, Billerica, MA, USA) and secured with nail polish. Experiments were obtained from 8 to 18 different animals per genotype, which belonged to 5–9 different litters. A set of experiments with n = 8 embraced at least five different animals per genotype. Confocal images were acquired using an Axiovert 200M-LSM 510 META microscope (Zeiss) equipped with a C-Apochromat × 40/1.2 and a 543-nm helium–neon laser. Band-pass emissionfilters were used for selective detection of the endogenous EGFP (500–550 nm) and red-biocytin labeling (565–615 nm). Single FSI images were acquired as 50–70-μm-thick Z-stacks composed of 2048 × 2048 pixel images (pixel size: 0.22μm) with a Z-step of 0.62 μm. Reconstructions of neuronal projections were performed using the LSM Image Browser (Zeiss) and processed with a medianfilter (2 pixel radius) from Image J. Dendritic branching was quantified by Sholl analysis45 and their elongation
measured with‘moment calculator’, an ImageJ plug-in (Francois Richard, University of Ottawa; http://imagej.nih.gov/ij/plugins/moments.html). Den-dritic distribution was evaluated by tracing vectors from the soma (as the center) and the crossing dendrites within a 100-μm-radius circle. The angular variance of those vectors was calculated for each FSI according to Batschelet.46
Statistical analysis
For analysis of isolation-induced USV, body weight, body temperature and somatosensory reflexes in mouse pups, two-way analyses of variance (ANOVAs) with the between-subjects factors genotype' (PV+/+, PV+/−and PV−/−) and sex (male or female) were calculated. In order to test whether differences in pup USV emitted in isolation emerged over time during testing, ANOVAs for repeated measurements with the same between-subject factor and the within-between-subject factor test duration were performed. For analysis of interaction-induced USV and reciprocal social interaction behavior in juvenile mice, two-way ANOVAs with the between-subject factors' genotype (PV+/+, PV+/−and PV−/−) and sex (male or female) plus the
covariate age of subject mice in PND were calculated. In order to test whether differences in juvenile USV and social interaction behavior displayed during reciprocal social interaction emerged over time during testing, ANOVAs for repeated measurements with the same between-subject factors plus the covariate age of between-subject mice in PND and the within-subject factor test duration were performed. For analysis of female-induced USV in adult male mice, one-way ANOVAs with the between-subject factors' genotype (PV+/+, PV+/−and PV−/−) plus the covariate age of
subject mice in PND were calculated. ANOVAs were followed by least significant difference post hoc analysis when appropriate. A paired t-test was used to compare the likelihood of the occurrence of a social behavior in response to a social behavior.
For analysis of repetitive and stereotyped patterns of behavior, motor functions and locomotor activity, anxiety-related behavior and sensory information processing, data were analyzed using mixed ANOVA models
with genotype (mutant, control) as between-subject factors and within-subject factors to explore the dependence of genotype effects on place, time or stimulus. Significant interactions and where necessary significant main effects were further explored by Tukey–Kramer post hoc tests or by splitting the ANOVA model, as appropriate. One-sample t-tests were used for follow-up comparisons against chance levels. Variables known to produce strongly skewed distributions and/or frequent outliers were subjected to a log transformation before ANOVA analysis (as indicated, for example, latency measures). Sex and, where applicable, cohorts were added to the ANOVA model as additional between-subject factors to check for sex or cohort dependence of any genotype effect. Main effects of sex and cohort were not studied; interactions are only reported when significant. Student’s t-test was performed to compare rotarod perfor-mance between genotypes, and pain sensitivity was analyzed by means of an ANOVA, including the factors sex and genotype.
For statistical analysis of the MRI data, ANOVAs with a post hoc Bonferroni test were used to compare groups (that is, genotypes, using their specific controls). For electrophysiological recordings and Sholl analysis, statistical analyses were performed using the Neuromatic software package (http//www.neuromatic.thinkrandom.com) and custom routines within the IgorPro environment (Wavemetrics, Lake Oswego, OR, USA). Statistical tests were performed using the Student's t-test within Excel software package (Microsoft, Redmond, WA, USA) and repeated-measures ANOVA were performed using Prism 4.0. (GraphPad Software). Gaussian statistics were used for comparisons of angular variances. All values are expressed as mean ± s.e.m. A Po0.050 was considered statistically significant.
RESULTS
ASD core symptoms are manifest in mice with reduced/absent PV
expression
With a focus on behavioral phenotypes of PV
−/−mice with
relevance to ASD core symptoms, we performed a detailed
analysis of their social behavioral repertoire during reciprocal
social interactions, measured the production of USV in pups
isolated from mother and littermates, juvenile mice during
reciprocal social interactions and adult male mice exposed to
females, along with the assessment of repetitive and stereotyped
patterns of behavior by means of a T-maze working-memory task
and the MWM place navigation task, with all paradigms known to
be sensitive for detecting behavioral deficits relevant for ASD.
14–17Social behavior de
ficits. Reduced levels (PV
+/−) or absence of PV
(PV
−/−) caused a clear reduction in the time spent in reciprocal
social interaction behavior in juvenile mice at PND25 ± 1 as
compared with PV
+/+littermate controls (Figure 1a). Although
reciprocal social behavior was overall reduced in PV
+/−and PV
−/−mice, its temporal pattern was similar in all genotypes, with most
intensive social interaction behavior during the
first 2 min of
reciprocal social interaction (Figure 1b). Importantly, similar
genotype effects were obtained for the total numbers of social
interactions (Figure 1c). When analyzing the social behavioral
repertoire in detail, its richness and reciprocal character were
found to be strongly affected by genotype. PV
+/+mice displayed a
signi
ficant preference for engaging in another social behavior
following a previous one in ~61% of the cases (~39% for nonsocial
behavior), whereas no such preference was seen in PV
+/−and
PV
−/−mice, with social behaviors following in ~53% and ~49% of
cases, respectively (Figure 1d; typical ethograms are depicted in
Figure 1e). Genotypes did not differ in nonsocial behaviors,
including rearing, grooming and digging behavior during
reciprocal social interactions (Supplementary Figures S1A
–C).
Moreover, the type and frequency of nonsocial behavior following
a social one was not different between genotypes (not shown).
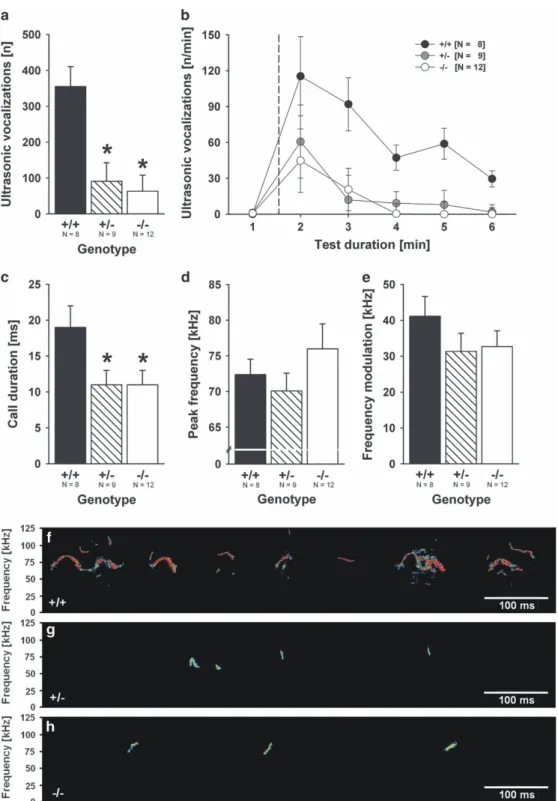
Impairments in communication.
USV emission appears to be a
major mode of communication in rodents
47and ASD mouse
models are typically characterized by altered USV production.
48We therefore tested USV production at various developmental
time points. USV emission during juvenile reciprocal social
interaction (PND25 ± 1) was reduced approximately fourfold in
PV
−/−mice as compared with PV
+/+littermate controls (Figure 2a),
with a similar, yet overall reduced temporal USV emission pattern,
characterized by the highest USV rates during the
first 2 min of
reciprocal social interaction (Figure 2b). Remarkably, USV emission
in PV
+/−animals was diminished to the same extent as in PV
−/−mice. Also duration of USV was found to be shorter in PV
+/−and
PV
−/−mice than in PV
+/+littermate controls (Figure 2c). Peak
frequency and frequency modulation were not affected (Figures
2d and e; typical spectrograms are depicted in Figures 2f
–h). Thus,
a reduction of PV to ~30–40% of PV
+/+(ref. 24) is suf
ficient for
inducing communication deficits with relevance to ASD. USV
production in adult mice was also affected by genotype. Unlike at
PND25 ± 1, however, PV
+/−vocalized like PV
+/+mice in these
experiments. When adult male mice (PND ~120) were exposed to
females for 5 min, PV
+/+and PV
+/−mice emitted ~320 USV and
~390 USV, respectively, whereas PV
−/−mice emitted ~10 USV only
(Supplementary Figures S2A and B). Furthermore, USV emitted by
PV
−/−mice were shorter in duration and less frequency-modulated
than those emitted by PV
+/+littermate controls (Supplementary
Figures
S2C
and
E).
Peak
frequency
was
not
affected
(Supplementary Figure S2D; typical spectrograms are depicted in
Supplementary Figures S2F
–H). Importantly, deficits in USV
emission were found to be speci
fic for developmental stages in
which PV supports important physiological functions. When
testing for pup isolation-induced USV (Supplementary Figures
S3A
–H), somatosensory reflexes and body development
(Supplementary Figures S4A
–D) at PND8, no genotype differences
were observed, as expected. At PND8, PV protein expression levels
in PV
+/+mice are very low, often below the detection limits of
immunohistochemistry and/or western blot analysis, for example,
in neocortex
49and cerebellum.
25Repetitive and stereotyped patterns of behavior.
To model
ASD-associated perseverative thinking and behavioral in
flexibility, we
tested PV
+/+and PV
−/−mice in reversal learning paradigms using a
T-maze working-memory task and the MWM place navigation
task.
37No genotype differences were detected during the
acquisition phase of the T-maze working-memory task. Both
genotypes demonstrated equal ability to learn the test as revealed
by the number of correct daily trials, a plateau of ~8 correct trials
was reached within 4 days. Also the time required to reach
criterion
performance
(⩾8/10 correct trials during three
Figure 1. Social behavior deficits: PV− / −null mutant and PV+/− heterozygous mice display social behavior deficits during reciprocal social
interactions as juveniles. (a) Total social interaction time displayed during the 5-min social interaction period (genotype: F2,23= 5.405,
P= 0.012; sex: NS; genotype × sex: NS). (b) Time course for the social interaction time displayed during each 1-min time bin across the 5-min social interaction period, plus 1 min habitation (dashed line indicates introduction of partner mouse). (c) Total number of social interactions displayed during the 5-min social interaction period (genotype: F2,23= 3.620, P = 0.043; sex: NS; genotype × sex: NS). Black bar: PV+/+wild-type
littermate control mice; striped bar: PV+/−heterozygous mice; white bar: PV− / −null mutant mice. Data are presented as means± s.e.m., bars denoting the s.e.m. *Po0.050 vs PV+/+. (d) Percentage of nonsocial vs social behavior following social behavior (dashed line indicates 50% chance level). Black bar: social; striped bar: nonsocial. *Po0.050 vs nonsocial.#Po0.050 vs 50% chance level (PV+/+: t8= 2.408, P = 0.043; PV+/−:
NS; PV− / −: NS). (e) Representative ethograms of social and nonsocial behavior displayed during juvenile reciprocal social interactions by a PV+/+wild-type littermate control mouse, a PV+/−heterozygous mouse and a PV− / −null mutant mouse. NS, not significant; PV, parvalbumin.
Figure 2. Impairments in communication: PV− / −null mutant and PV+/− heterozygous mice display ultrasonic vocalization deficits during
reciprocal social interactions as juveniles. (a) Total number of ultrasonic vocalizations emitted during the 5-min social interaction period (genotype: F2,21= 9.240, P = 0.001; sex: NS; genotype × sex: NS). (b) Time course for the number of ultrasonic vocalizations emitted for each
1-min time bin across the 5-min social interaction period, plus 1 min habitation (dashed line indicates introduction of partner mouse). (c) Duration of calls (genotype: F2,21= 3.870, P = 0.037; sex: NS; genotype × sex: NS), (d) peak frequency (genotype: NS; sex: NS; genotype × sex: NS)
and (e) frequency modulation of calls (genotype: NS; sex: NS; genotype × sex: NS) emitted during the 5-min social interaction period. Black bar: PV+/+wild-type littermate control mice; striped bar: PV+/− heterozygous mice; white bar: PV− / −null mutant mice. Data are presented as
means± s.e.m., bars denoting the s.e.m. *Po0.050 vs PV+/+. (f–h) Representative spectrograms of ultrasonic vocalizations emitted during juvenile reciprocal social interactions by (f) a PV+/+wild-type littermate control mouse, (g) a PV+/−heterozygous mouse and (h) a PV− / −null
mutant mouse. NS, not significant; PV, parvalbumin.
consecutive days in 70% of the mouse cohorts) was similar, with
PV
+/+and PV
−/−mice achieving criterion at 14 and 12 days,
respectively (Figure 3a). Similarly, PV
−/−mice performed normally
in the acquisition phase of the MWM place navigation task
(Figure 3c). Consistently, no evidence for learning and memory
de
ficits were observed in the radial-maze working-memory task
(Supplementary Figure S5A); the number of correct choices and
the learning rate across trials over the 10-day procedure, as well as
the errors per collected bait were not different between groups.
This indicates that both spatial reference and spatial working
memory are intact in PV
−/−mice. Repetitive and stereotyped
patterns of behavior could hence be tested using these tasks. In
the T-maze working-memory task, seven PV
+/+and six PV
−/−mice
were able to proceed to the reversal phase. During reversal
learning, PV
−/−mice exhibited a clear de
ficit in their ability to
reverse their behavior to obtain the reward from the opposite arm
of the maze. Analysis of trials to reach criterion for acquisition and
reversal showed a signi
ficant difference in reversal learning
(Figure 3b). Similar
findings were obtained in the MWM place
navigation task. Despite intact acquisition learning of a
sub-merged escape-platform location, PV
−/−mice were more strongly
disturbed by the relocation of the platform during the reversal
phase than PV
+/+mice and performed worse during the
first trial
block (Figure 3d).
ASD-linked comorbidities are prevalent in PV
−/−mice
Besides behavioral paradigms with relevance to ASD core
symptoms, mice were subjected to a battery of assays to detect
potentially confounding factors, such as motor de
ficits and
reduced exploratory activity, and to study relevant ASD
comor-bidities, such as anxiety and sensorimotor impairments.
1In line
with human studies indicating that seizures are present in ~25%
of individuals with ASD,
50increased susceptibility to seizures
induced by pentylenetetrazole in PV
−/−mice has previously been
reported, yet these mice do not show spontaneous seizures.
24Motor function and locomotor activity.
Motor performance in
adult (43 months) PV
−/−mice was normal on the acceleration
Figure 3. Repetitive and stereotyped patterns of behavior: PV−/−null mutant mice display reversal deficits in adulthood. (a) During acquisition of
the T-maze task, no effect of genotype on learning was observed (% mice not reaching criterion by day, log-rank Mantel–Cox; genotype: χ12= 0.4;
NS). (b) During T-maze reversal, the rate of improvement was significantly lower in PV−/− mice (log-rank Mantel–Cox; genotype: χ12= 3.9;
P= 0.048), with only 2/6 animals reaching criterion by 20 days. In contrast, 6/7 PV+/+mice reached criterion with a learning rate similar to the acquisition phase. (c) During place navigation acquisition in the MWM, neither performance level nor learning rate were affected by genotype (escape latency by blocks of three trials; ANOVA, genotype: F1,27= 0.5, NS; time: F5,135= 20.8, Po0.0001; time × genotype: F5,135= 0.4, NS). (d) In
the reversal stage, PV−/−were more strongly disturbed by the relocation of the platform and performed worse during thefirst trial block (ANOVA, genotype: F1,27= 1.9, NS; time: F3,81= 17.5, Po0.0001; time × genotype: F3,81= 3.5, P = 0.020; *PV−/−vs PV+/+P= 0.041). Data are presented as
means± s.e.m., bars denoting the s.e.m. ANOVA, analysis of variance; MWM, Morris water maze; NS, not significant; PV, parvalbumin.
rotarod (10
–40 r.p.m.), in the force grip test, and normal swim
parameters were found in the MWM place navigation task (not
shown). General locomotor parameters were determined by
measuring exploratory activity in a large open-
field arena over
two consecutive days. PV
+/+and PV
−/−mice were indistinguishable
in
terms
of
within-
and
between-session
habituation
(Supplementary Figures S5B and C). Essentially all parameters
including moving time and average speed were similar between
genotypes, with two exceptions: bouts of locomotion in PV
−/−mice
were less structured than in PV
+/+mice, being more linear (linearity
index: F
1,52= 9.503, P = 0.003) and showing less small-scale
accel-erations and decelaccel-erations (jerkiness index: F
1,52= 9.745, P = 0.003),
and, in line with previous observations,
51rearing activity was
reduced in PV
−/−(estimated vertical movements: F
1,28= 4.743,
P = 0.038), indicating mildly changed patterns of spontaneous
locomotion. Level and habituation rate of activity in the small open
field with home box were unchanged (Supplementary Figure S5D).
Anxiety-related and depression-like behavior.
In the large open
field, PV
−/−mice showed a larger speed difference between
centrifugal and centripetal locomotion (genotype: F
1,52= 8.599,
P = 0.005), a
finding sometimes associated with increased anxiety.
Similarly, PV
−/−mice displayed reduced rearing activity in the
center
field of the small open field (estimated vertical movements:
genotype: F
1,28= 7.02, P = 0.013), whereas center time and the
time spent inside the home box were unchanged (genotype: not
signi
ficant; Supplementary Figure S5E). Also, no genotype
differences were observed in the light/dark transition and the
O-maze test (Supplementary Figures S5F and G). In the sucrose
preference test used to assess anhedonia, a core symptom of
depression, no evidence for genotype effects were observed (not
shown).
Sensory information processing.
Altered responses to sensory
stimuli are commonly observed in ASD patients, particularly in the
auditory domain and in response to pain. Thus, we determined
sensitivity to acoustic and heat stimuli in PV
+/+and PV
−/−mice. In
the prepulse inhibition paradigm, no evidence for signi
ficantly
altered prepulse inhibition was obtained (Supplementary Figure
S5H), yet PV
−/−mice showed a reduced startle response to strong
stimuli (110 and 120 dB; Supplementary Figure S6A). In response
to heat stimuli, PV
−/−mice showed reduced nociception, as
reflected in an increased latency to withdrawal from a painful heat
stimulus in both the hot-plate and tail-
flick assays as compared
with PV
+/+controls (Supplementary Figures S6B and C).
Age-dependent brain morphology alterations in PV
−/−mice show
similarities to structural changes reported in human ASD patients
Evidence has accumulated that the time course of brain
development may be altered in ASD, with cortical lobes and
cerebellum most consistently affected.
31,32,52Using MRI cerebral
blood volume imaging, an in vivo correlate of brain metabolism in
the basal state, an age-independent impairment of metabolic
status is observed in the dentate gyrus and CA1 region of the
hippocampal formation in PV
−/−mice.
33Here we performed MRI
volumetric analysis of neocortex, cerebellum, hippocampus and
whole intracranial content (Figure 4a). PV
+/+and PV
−/−mice were
imaged in vivo at PND20 (juvenile) and between 9 and 16 months
(adult). Segmentation and volumetry of the aforementioned
regions of interest was conducted using a custom-built
semi-automated
approach
(see
Materials
and
methods
and
Supplementary Figures S7A and B). Region of interest volumes
were normalized to total intracranial content.
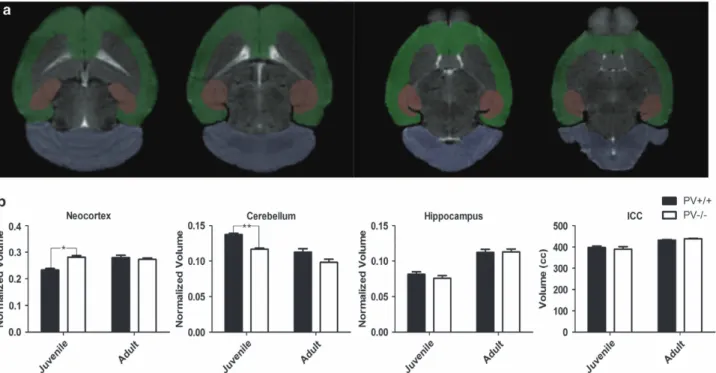
Figure 4. Absence of parvalbumin in PV− /−mice induces transient neocortical hypertrophy and cerebellar hypoplasia in male juvenile (PND20)
mice. (a) Representative axial sections acquired with T2-weighted imaging. Semi-automatically labeled cerebellar (purple), neocortical (green) and hippocampal (red) ROIs are highlighted. (b) (From left to right) neocortical volume, which was normalized to total intracranial content, from control and PV− /−mice at the specified age groups; at PND20, the neocortical volume in PV− /−mice was increased (genotype: F1,29
= 4.65, P = 0.021). Normalized cerebellar volume at the specified age groups: at PND20, the cerebellar volume in PV− /−mice was significantly
smaller (genotype: F1,29= 13.10, P = 0.0029). Normalized hippocampal volume and total intracranial content at the specified age groups. No
significant differences were observed in the normalized hippocampal or total intracranial content of juveniles (PND20) or in any of the ROIs analyzed in the adult group. Data are presented as means± s.e.m., bars denoting the s.e.m. *Po0.05,**Po0.01 two-way ANOVA followed by Bonferroni’s t-test. ANOVA, analysis of variance; ICC, intracranial content; PND, postnatal day; PV, parvalbumin; ROI, region of interest.