Supporting Online Material for
Past climate-driven range shifts and population genetic diversity in Arctic plants L. Pellissier, P. Eidesen, D. Ehrich, P. Descombes, P. Schönswetter, A. Tribsch, K.
Westergaard, N. Alvarez, A. Guisan, N. E. Zimmermann, S. Normand, P. Vittoz, M. Luoto, C. Damgaard, C. Brochmann, M. S. Wisz, I. G. Alsos
Journal of Biogeography
Appendix S1
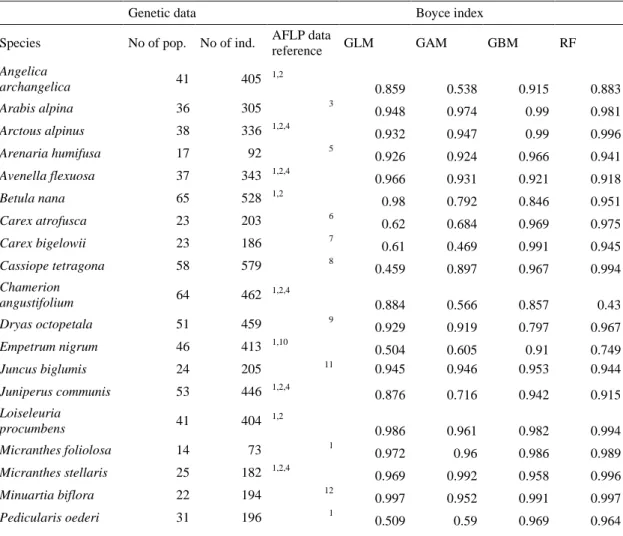
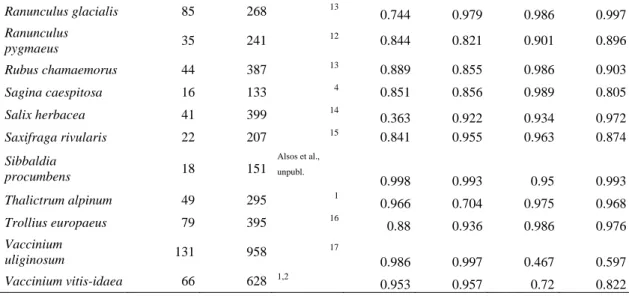
Table S1. Sample sizes for the genetic analyses of the 30 species included in the study and the predictive power from four species distribution model techniques measured with the Boyce index.
Genetic data Boyce index
Species No of pop. No of ind. AFLP data
reference GLM GAM GBM RF Angelica archangelica 41 405 1,2 0.859 0.538 0.915 0.883 Arabis alpina 36 305 3 0.948 0.974 0.99 0.981 Arctous alpinus 38 336 1,2,4 0.932 0.947 0.99 0.996 Arenaria humifusa 17 92 5 0.926 0.924 0.966 0.941 Avenella flexuosa 37 343 1,2,4 0.966 0.931 0.921 0.918 Betula nana 65 528 1,2 0.98 0.792 0.846 0.951 Carex atrofusca 23 203 6 0.62 0.684 0.969 0.975 Carex bigelowii 23 186 7 0.61 0.469 0.991 0.945 Cassiope tetragona 58 579 8 0.459 0.897 0.967 0.994 Chamerion angustifolium 64 462 1,2,4 0.884 0.566 0.857 0.43 Dryas octopetala 51 459 9 0.929 0.919 0.797 0.967 Empetrum nigrum 46 413 1,10 0.504 0.605 0.91 0.749 Juncus biglumis 24 205 11 0.945 0.946 0.953 0.944 Juniperus communis 53 446 1,2,4 0.876 0.716 0.942 0.915 Loiseleuria procumbens 41 404 1,2 0.986 0.961 0.982 0.994 Micranthes foliolosa 14 73 1 0.972 0.96 0.986 0.989 Micranthes stellaris 25 182 1,2,4 0.969 0.992 0.958 0.996 Minuartia biflora 22 194 12 0.997 0.952 0.991 0.997 Pedicularis oederi 31 196 1 0.509 0.59 0.969 0.964
Ranunculus glacialis 85 268 13 0.744 0.979 0.986 0.997 Ranunculus pygmaeus 35 241 12 0.844 0.821 0.901 0.896 Rubus chamaemorus 44 387 13 0.889 0.855 0.986 0.903 Sagina caespitosa 16 133 4 0.851 0.856 0.989 0.805 Salix herbacea 41 399 14 0.363 0.922 0.934 0.972 Saxifraga rivularis 22 207 15 0.841 0.955 0.963 0.874 Sibbaldia procumbens 18 151 Alsos et al., unpubl. 0.998 0.993 0.95 0.993 Thalictrum alpinum 49 295 1 0.966 0.704 0.975 0.968 Trollius europaeus 79 395 16 0.88 0.936 0.986 0.976 Vaccinium uliginosum 131 958 17 0.986 0.997 0.467 0.597 Vaccinium vitis-idaea 66 628 1,2 0.953 0.957 0.72 0.822
Table S2. Species traits collected for the 30 species based on several sources and databases19-23. We
selected traits that are expected to be the most influential ones in determining levels of genetic
variation in populations as well as of genetic differentiation among populations within species.
Growth form (H = Hemicryptophyte, CH = Chamaephyte, G = Geophyte, P = Phanerophyte),
Reproduction (s = Sexual, v/vv = Vegetative to varying degree), Pollination (se = predominant
self-pollination (autogamy, including kleistogamy, pseudokleistogamy and geitonogamy), in = insect
pollination (entomogamy, with or without potential for autogamy), wi = wind pollination
(anemogamy)). Category of dispersal distances represents scores based on the seed typology as
described in Vittoz and Engler 23, with 1 representing shortest (50% dispersed within 0.1 m) and 7
longest dispersal distance (50% dispersed within 500 m).
Species Growth Reprod. Pollin. Dispers.
Angelica archangelica H s in 3 Arabis alpina H s in 1 Arctous alpinus CH sv in 6 Arenaria humifusa CH s in 1 Avenella flexuosa H sv wi 3 Betula nana P svv wi 4 Carex atrofusca G sv wi 2
Carex bigelowii G sv wi 2 Cassiope tetragona CH svv in 1 Chamerion angustifolium H sv in 5 Dryas octopetala CH sv in 3 Empetrum nigrum CH sv wi 6 Juncus biglumis G sv wi 2 Juniperus communis P s wi 6 Loiseleuria procumbens CH s in 1 Micranthes foliolosa H svv in 1 Micranthes stellaris H sv in 1 Minuartia biflora CH s in 1 Pedicularis oederi H s in 3 Ranunculus glacialis H sv in 4 Ranunculus pygmaeus H s se 2 Rubus chamaemorus CH sv in 3 Sagina caespitosa CH s in 1 Salix herbacea CH svv in 5 Saxifraga rivularis H sv se 6 Sibbaldia procumbens H sv in 6 Thalictrum alpinum H sv in 2 Trollius europaeus H sv in 7 Vaccinium uliginosum CH sv in 6 Vaccinium vitis-idaea CH svv in 7
References for supplementary material
1. Alsos, I. G., Ehrich, D., Thuiller, W., Eidesen, P. B., Tribsch, A., Schönswetter, P. et al. (2012) Genetic consequences of climate change for northern plants. Proceedings of
the Royal Society B: Biological Sciences, 279, 2042–2051.
2. Eidesen, P. B., Ehrich, D., Bakkestuen, V., Alsos, I. G., Gilg, O., Taberlet, P. & Brochmann, C. (2013) Genetic roadmap of the Arctic: plant dispersal highways, traffic barriers and capitals of diversity. New Phytologist, 200, 898–910.
3. Ehrich, D., Gaudeul, M., Assefa, A., Koch, M. A., Mummenhoff, K., Nemomissa, S. & Brochmann, C. (2007). Genetic consequences of Pleistocene range shifts: contrast
between the Arctic, the Alps and the East African mountains. Molecular Ecology, 16, 2542–2559.
4. Westergaard, K. B., Alsos, I. G., Ehrich, D., Eidesen, P. B., Hollingsworth, P. M. & Brochmann, C. (2008) Genetic diversity and distinctiveness in Scottish alpine plants.
Plant Ecology and Diversity, 1, 329–338.
5. Westergaard, K. B., Alsos, I. G., Popp, M., Engelskjon, T., Flatberg, K. I. &
Brochmann, C. (2011) Glacial survival may matter after all: nunatak signatures in the rare European populations of two west‐arctic species. Molecular Ecology, 20, 376– 393.
6. Schönswetter, P. , Popp, M. & Brochmann, C. (2006). Central Asian origin of and strong genetic differentiation among populations of the rare and disjunct Carex
atrofusca (Cyperaceae) in the Alps. Journal of Biogeography, 33, 948–956.
7. Schönswetter, P., Elven, R. & Brochmann, C. (2008) Trans-Atlantic dispersal and large-scale lack of genetic structure in the circumpolar, arctic-alpine sedge Carex
bigelowii s. lat. (Cyperaceae). American Jounral of Botany, 95, 1006–1014.
8. Eidesen, P. B., Carlsen, T., Molau, U. & Brochmann, C. (2007) Repeatedly out of Beringia: Cassiope tetragona embraces the Arctic. Journal of Biogeography, 34, 1559–1574.
9. Skrede I., Eidesen, P. B., Portela, R. P. & Brochmann, C. (2006) Refugia,
differentiation and postglacial migration in arctic-alpine Eurasia, exemplified by the mountain avens (Dryas octopetala L.). Molecular Ecology, 15, 1827–1840.
10. Alsos, I. G., Eidesen, P. B., Ehrich, D., Skrede, I., Westergaard, K., Jacobsen, G. H. et al. (2007) Frequent long-distance plant colonization in the changing Arctic. Science, 316, 1606–1609.
11. Schönswetter, P., Suda, J., Popp, M., Weiss-Schneeweiss, H. & Brochmann, C. (2007) Circumpolar phylogeography of Juncus biglumis (Juncaceae) inferred from AFLP fingerprints, cpDNA sequences, nuclear DNA content and chromosome numbers. Molecular Phylogenetic and Evolution, 42, 92–103.
12. Schönswetter, P., Popp, M. & Brochmann, C. (2006) Rare arctic-alpine plants of the European Alps have different immigration histories: the snowbed species Minuartia
biflora and Ranunculus pygmaeus. Molecular Ecology, 15, 709–720.
13. Schönswetter, P., Tribsch, A., Stehlik, I. & Nickfeld, H. (2004) Glacial history of high alpine Ranunculus glacialis (Ranunculaceae) in the European Alps in a comparative phylogeographical context. Biological Journal of the Linnean Society, 81, 183–195.
14. Ehrich, D., Alsos, I. G. Brochmann, C. (2008) Where did the northern peatland species survive the dry glacials: cloudberry (Rubus chamaemorus) as an example.
Journal of Biogeography, 35, 800–814.
15. Alsos, I. G., Alm, T., Normand, S. & Brochmann, C. (2009) Past and future range shifts and loss of diversity in dwarf willow (Salix herbacea L.) inferred from genetics, fossils and modelling. Global Ecology and Biogeography, 18, 223–239.
16. Westergaard, K. B., Jørgensen, M. H., Gabrielsen, T. M., Alsos, I. G. & Brochmann, C. (2010) The extreme Beringian/Atlantic disjunction in Saxifraga rivularis
17. Espíndola, A., Pellissier, L., Maiorano, L., Hordijk, W., Guisan, A., & Alvarez, N. (2012) Predicting present and future intra-specific genetic structure through niche hindcasting across 24 millennia. Ecology Letters, 15, 649–657.
18. Eidesen, P. B., Alsos, I. G., Popp, M., Stensrud, Ø., Suda, J. & Brochmann, C. (2007) Nuclear versus plastid data: complex Pleistocene history of a circumpolar key species. Molecular Ecology, 16, 3902–3925.
19. Klotz, S., Ingolf, K. & Durka, W. (2002) BIOLFOR – Eine Datenbank mit
Biologisch-Ôkologishen Merkmalen zur Flora von Deutschland, 1 edn. Bundesamt
für Naturschutz, Bonn.
20. Aeschimann, D., Lauber, K., Moser, D. & Theurillat, J. P. Flora Alpina: ein Atlas
Sämtlicher 4500 Gefässpflanzen der Alpen. (Haupt Verlag, 2004).
21. Landolt, E. & Bäumler, B. Flora Indicativa. Ecological Indicator Values and
Biological Attributes of the Flora of Switzerland and the Alps. (Haupt Verlag, 2010).
22. Pignatti S. (2005) Biondicazione attraverso le piante vascolari. Valori di indicazione
secondo Ellenberg (Zeigerwerte) per le specie della Flora d’Italia. Braun-Blanquetia 39. Camerino, Italy.
23. Vittoz, P., Engler R. (2007). Seed dispersal distances: a typology based on dispersal modes and plant traits. Botanica Helvetica, 117, 109–124.
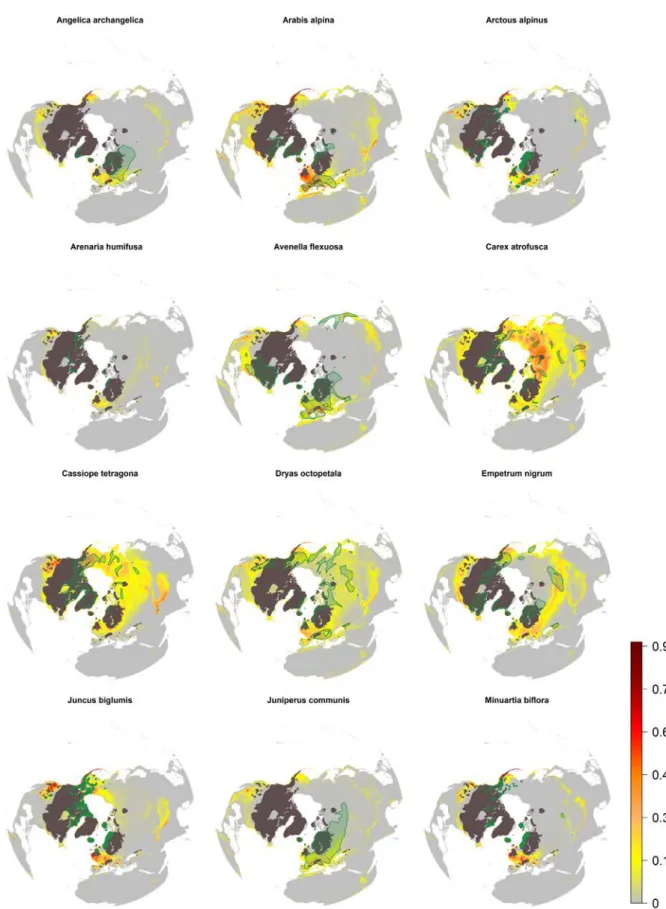
Figure S1. Potential distribution based on climatic suitability of the investigated species hindcasted to the Last Glacial Maximum (-21 Ky), from the species A. angelica to M. biflora.
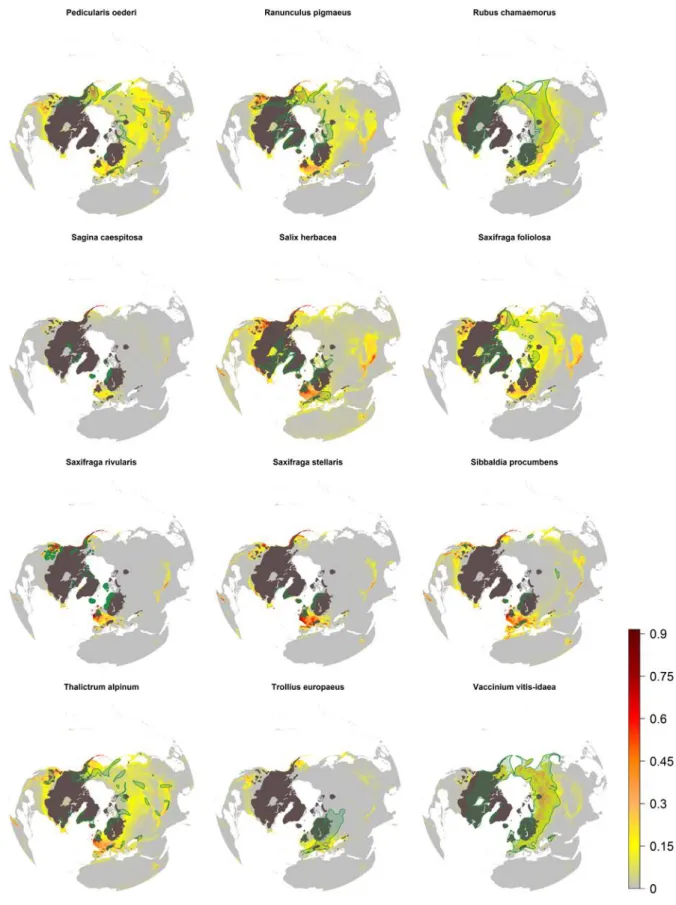
Figure S2. Potential distribution based on climatic suitability of the investigated species hindcasted to the Last Glacial Maximum (-21 Ky) from the species P. oederi to V. vitis-idaea.
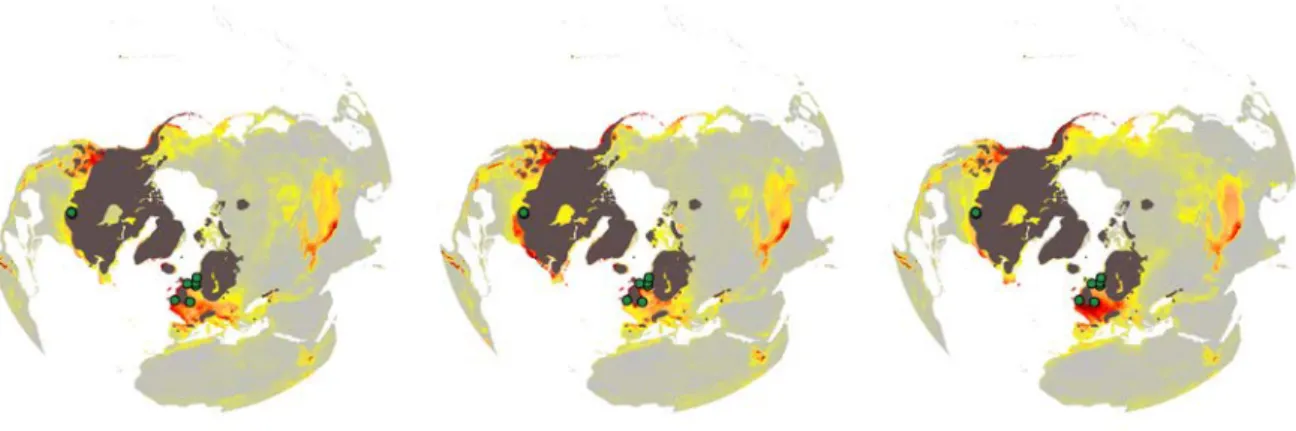
Appendix S3
Figure S3. Potential distribution based on climatic suitability for Salix herbacea hindcasted to the last glacial maximum (-21 Ky) with the three GCMs a) CCSM4, b) MPI-ESM-P, c) MIROC-ESM. Known fossil records are indicated in green. Only MPI-ESM-P was able to confidently predict fossil occurrences in eastern North America at the LGM