- 1 -
Supplementary Material
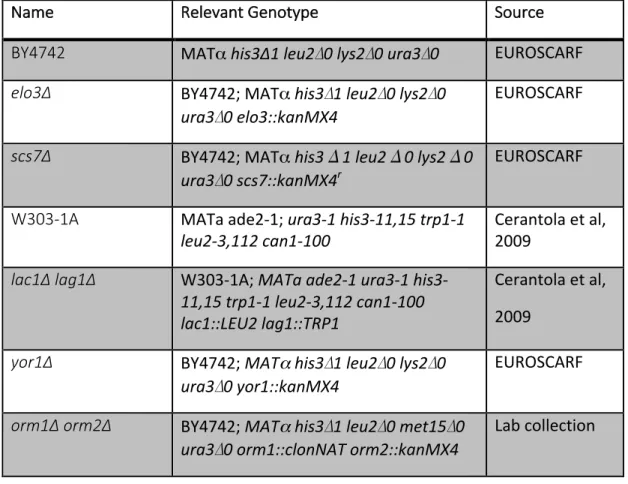
Table S1. Saccharomyces cerevisiae strains used in this study.
Name Relevant Genotype Source
BY4742 MATα his3∆1 leu2∆0 lys2∆0 ura3∆0 EUROSCARF
elo3∆ BY4742; MATα his3∆1 leu2∆0 lys2∆0 ura3∆0 elo3::kanMX4 EUROSCARF scs7∆ BY4742; MATα his3Δ1 leu2Δ0 lys2Δ0 ura3∆0 scs7::kanMX4r EUROSCARF W303-1A MATa ade2-1; ura3-1 his3-11,15 trp1-1 leu2-3,112 can1-100 Cerantola et al, 2009 lac1∆ lag1∆ W303-1A; MATa ade2-1 ura3-1 his3-11,15 trp1-1 leu2-3,112 can1-100 lac1::LEU2 lag1::TRP1 Cerantola et al, 2009 yor1∆ BY4742; MATα his3∆1 leu2∆0 lys2∆0 ura3∆0 yor1::kanMX4 EUROSCARF orm1∆ orm2∆ BY4742; MATα his3∆1 leu2∆0 met15∆0 ura3∆0 orm1::clonNAT orm2::kanMX4 Lab collection
- 2 -
Supplementary Figure Legends
Figure S1. Fragmentation of C17-containing ceramide-C.
Cells were incubated with 25 µM C17-PHS for 60 min, lipids were extracted and analyzed by mass spectrometry. C17-ceramide C at m/z = 696.5 was fragmented and product ions were analyzed in negative (panel A) and positive mode (panel B).
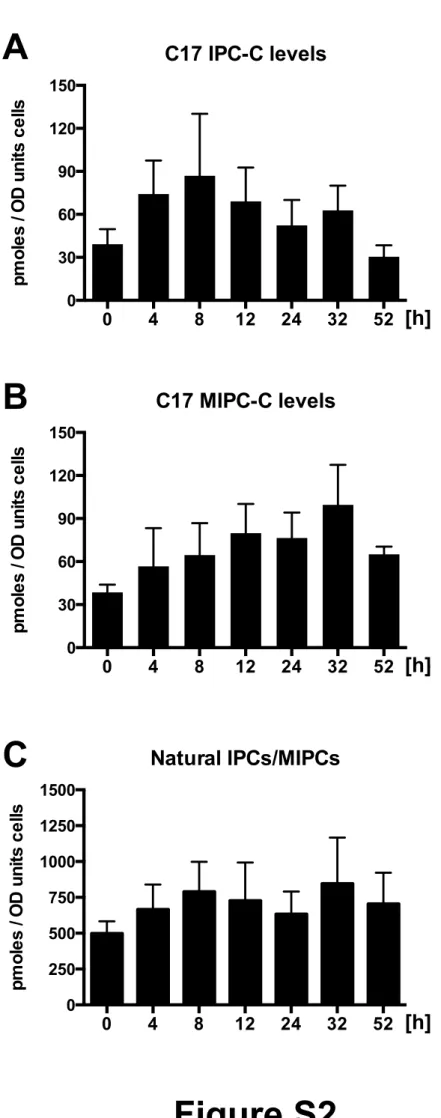
Figure S2. Complex sphingolipids are stable.
Cells were pulsed with C17-PHS (50 µM) for 90 min, washed, and then allowed to grow for the indicated period of time. Lipids were extracted and both C17- and C18-PHS containing complex sphingolipids were quantified. Values represent mean ±SD of three independent determinations.
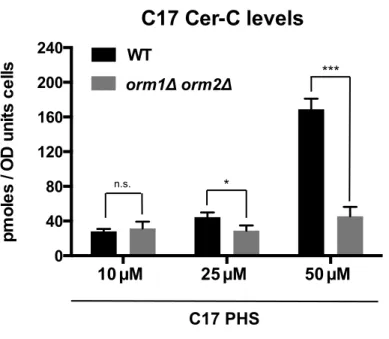
Figure S3. Elevated concentrations of C17-PHS inhibits ceramide and IPC synthesis in the Orm mutant.
Wild-type and orm1∆ orm2∆ mutant cells were incubated with different concentrations of C17-PHS for 45 min and newly synthesized C17 Cer-C (panel A) and C17 IPC-C (panel B) were quantified. Values represent mean ±SD of three independent determinations. Asterisks denote statistical significance (*P<0.05; **P<0.001; ***P<0.0001; n.s. (non significant)).
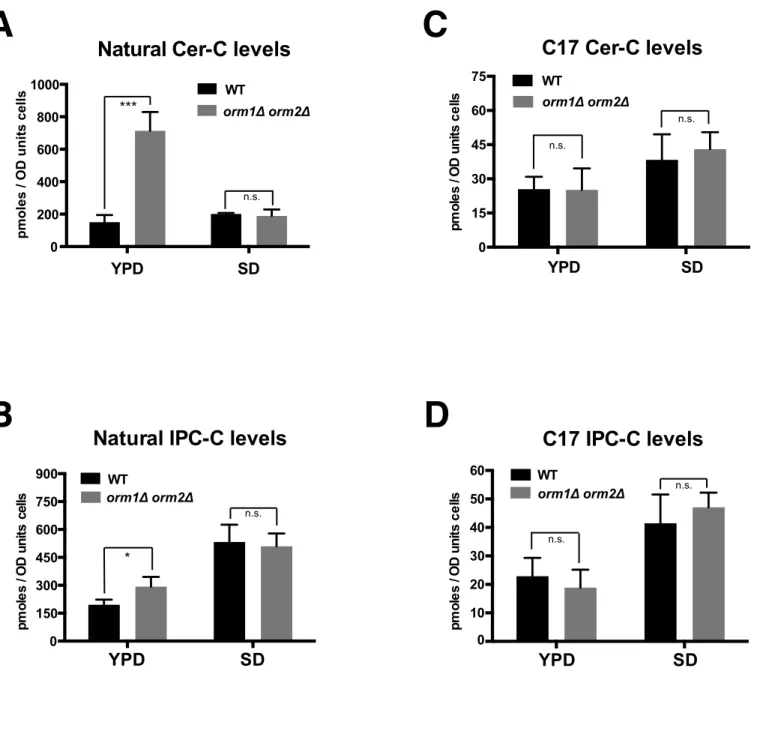
Figure S4. The media composition affects steady-state levels of ceramide but not the rate of ceramide and IPC synthesis.
Comparison of steady-state levels of ceramide (panel A) and IPC-C (panel B) of wild-type and Orm mutant cells cultivated either in rich (YPD) or synthetic (SD) media. Comparison of the rate of ceramide (panel C) and IPC-C (panel D) synthesis of wild-type and Orm mutant cells cultivated either in rich (YPD) or synthetic (SD) media. Cells were incubated with C17-PHS (10 µM) for 45 min. Values represent mean ±SD
- 3 -
of three independent determinations. Asterisks denote statistical significance (*P<0.05; ***P<0.0001; n.s. (non significant)).
Analysis Info Acquisition Date 27.09.2014 21:21:26 D:\Data\Biochemistry\696 frag rep.d
Analysis Name
Operator: F. Nyde. MS_SERVICE UNI_FR Method ceramides 900mz optimized.m
Instrument: BRUKER - Ion Trap MS esquire HCT Dummy
Sample Name Comment
ESI-MS
printed: 27.09.2014 21:33:16 Page 1 of 1 Bruker Daltonics DataAnalysis 3.2
A
B
Figure S1
696.5 [M-H2O] -[M-2H2O] -[26:0;1 –CH2O] -[26:0;1+O] -YPD_lcb4_Cer1_14jul 13.10.2015 YPD_lcb4_Cer1_14jul #509 R 48. A 1N 1.30FFTMS + p APCI corona sid=10.00 Full ms2
100 200 300 400 500 600 700 800 900 1000 1100 1200 m/z 0 5 10 15 20 25 30 35 40 45 50 55 60 65 70 75 80 85 90 95 100 662.64 268.26 680.65 250.25 95.09 286.27 698.66 109.10 238.25 135.12 547.47 149.13 632.63 412.41 605.55 377.32 300.29 720.65 [LCB+H-3H2O]+ [LCB+H-2H2O]+ [LCB+H-H2O]+ [M+H-2H2O]+ [M+H-H2O]+ [M+H]+ 2O -H 2O -H C17 PHC-C 43:0;4 m/z 696.5 H-2O -H 2O -H C17 PHC-C 43:0;4 m/z 698.6 H+ -LCB 2O -H 2O -H 2O -H Relative Intensity Intensity
Figure S2
A
C
B
C17 IPC-C levels
0 4 8 12 24 32 52 0 30 60 90 120 150 pm ole s / OD unit s c e llsh
C17 MIPC-C levels
0 4 8 12 24 32 52 0 30 60 90 120 150 pm ole s / OD unit s c e llsh
Natural IPCs/MIPCs
0 4 8 12 24 32 52 0 250 500 750 1000 1250 1500 pm ole s / OD unit s c e llsh
[h]
[h]
[h]
Figure S3
A
B
orm1Δ orm2Δ *** C17 PHS * n.s. WT C17 PHS * n.s.C17 Cer-C levels
10 µM 25 µM 50 µM 0 40 80 120 160 200 240 p m ol es / O D uni ts ce lls WT orm1Δ orm2ΔC17 IPC-C levels
10 µM 25 µM 50 µM 0 25 50 75 100 125 150 p m ol es / O D uni ts ce lls *Natural IPC-C levels
YPD SD 0 150 300 450 600 750 900 pm ol es / O D uni ts cellsC17 IPC-C levels
YPD SD pm ol es / O D uni ts ce llsFigure S4
A
C
orm1Δ orm2Δ orm1Δ orm2Δ n.s. * ***B
D
orm1Δ orm2Δ orm1Δ orm2Δ n.s.Natural Cer-C levels
p m o le s / O D u n its c el ls 0 200 400 600 800 1000 YPD SD WT WT YPD SD