HAL Id: hal-00565225
https://hal.archives-ouvertes.fr/hal-00565225
Submitted on 31 Aug 2012
HAL is a multi-disciplinary open access
archive for the deposit and dissemination of
sci-entific research documents, whether they are
pub-lished or not. The documents may come from
teaching and research institutions in France or
abroad, or from public or private research centers.
L’archive ouverte pluridisciplinaire HAL, est
destinée au dépôt et à la diffusion de documents
scientifiques de niveau recherche, publiés ou non,
émanant des établissements d’enseignement et de
recherche français ou étrangers, des laboratoires
publics ou privés.
Genetic Variation among Major Human Geographic
Groups Supports a Peculiar Evolutionary Trend in
PAX9.
Vanessa Paixão-Côrtes, Diogo Meyer, Tiago Pereira, Stéphane Mazières,
Jacques Elion, Rajagopal Krishnamoorthy, Marco Zago, Wilson Silva Jr.,
Francisco Mauro Salzano, Maria Bortolini
To cite this version:
Vanessa Paixão-Côrtes, Diogo Meyer, Tiago Pereira, Stéphane Mazières, Jacques Elion, et al.. Genetic
Variation among Major Human Geographic Groups Supports a Peculiar Evolutionary Trend in PAX9..
PLoS ONE, Public Library of Science, 2011, pp.6(1):e15656. �hal-00565225�
Groups Supports a Peculiar Evolutionary Trend in PAX9
Vanessa R. Paixa˜o-Coˆrtes1, Diogo Meyer2, Tiago V. Pereira3, Ste´phane Mazie`res4,5, Jacques Elion6, Rajagopal Krishnamoorthy6, Marco A. Zago7, Wilson A. Silva Jr.8, Francisco M. Salzano1, Maria Ca´tira Bortolini1*
1Departamento de Gene´tica, Instituto de Biocieˆncias, Universidade Federal do Rio Grande do Sul, Porto Alegre, Rio Grande do Sul, Brazil, 2 Departamento de Gene´tica e Biologia Evolutiva, Instituto de Biocieˆncias, Universidade de Sa˜o Paulo, Sa˜o Paulo, Sa˜o Paulo, Brazil, 3 Departamento de Bioquı´mica, Universidade Federal de Sa˜o Paulo, Sa˜o Paulo, Sa˜o Paulo, Brazil, 4 Laboratoire d’Anthropobiologie, FRE2960, CNRS, Toulouse, France, 5 Anthropologie Bioculturelle, Faculte´ de Me´decine, CS80011, Marseille, France, 6 Insern, UMR 763, Universite´ Paris Diderot, Hoˆpital Robert Debre´, Paris, France, 7 Departamento de Clı´nica Me´dica, Faculdade de Medicina, Universidade de Sa˜o Paulo, Ribeira˜o Preto, Sa˜o Paulo, Brazil, 8 Departamento de Gene´tica, Faculdade de Medicina de Ribeira˜o Preto, Universidade de Sa˜o Paulo, Ribeira˜o Preto, Sa˜o Paulo, Brazil
Abstract
A total of 172 persons from nine South Amerindian, three African and one Eskimo populations were studied in relation to the Paired box gene 9 (PAX9) exon 3 (138 base pairs) as well as its 59and 39flanking intronic segments (232 bp and 220 bp, respectively) and integrated with the information available for the same genetic region from individuals of different geographical origins. Nine mutations were scored in exon 3 and six in its flanking regions; four of them are new South American tribe-specific singletons. Exon3 nucleotide diversity is several orders of magnitude higher than its intronic regions. Additionally, a set of variants in the PAX9 and 101 other genes related with dentition can define at least some dental morphological differences between Sub-Saharan Africans and non-Africans, probably associated with adaptations after the modern human exodus from Africa. Exon 3 of PAX9 could be a good molecular example of how evolvability works.
Citation:Paixa˜o-Coˆrtes VR, Meyer D, Pereira TV, Mazie`res S, Elion J, et al. (2011) Genetic Variation among Major Human Geographic Groups Supports a Peculiar Evolutionary Trend in PAX9. PLoS ONE 6(1): e15656. doi:10.1371/journal.pone.0015656
Editor:Dennis O’Rourke, University of Utah, United States of America
ReceivedAugust 20, 2010; Accepted November 19, 2010; Published January 27, 2011
Copyright: ß2011 Paixa˜o-Coˆrtes et al. This is an open-access article distributed under the terms of the Creative Commons Attribution License, which permits unrestricted use, distribution, and reproduction in any medium, provided the original author and source are credited.
Funding:This work was supported by Conselho Nacional de Desenvolvimento Cientı´fico e Tecnolo´gico, Institutos do Mileˆnio and Programa de Apoio a Nu´cleos de Exceleˆncia Programs, Fundac¸a˜o de Amparo a` Pesquisa do Estado do Rio Grande do Sul, and Inserm-FAPESP 2010-2011 Joint Projects Agreement, Brazil and France. The funders had no role in study design, data collection and analysis, decision to publish, or preparation of the manuscript.
Competing Interests:The authors have declared that no competing interest exist. * E-mail: [email protected]
Introduction
The central goal of genetics is to understand how heritable information encoded in the genome determines the phenotype of an organism [1]. Some results support the idea that morphological evolution can occur basically by a small proportion of major effect mutations in structural, developmental or regulatory key genes (major gene effect hypothesis [2,3]. Considering this possibility, we studied the entire coding region as well as exon-intron boundaries of the Paired box homeotic gene 9 (PAX9; a transcription gene with a major role in early development, including dentition) to investigate the importance of small changes in major protein-coding genes that could be involved with the normal intra and interspecies dental variation [4].
The PAX9 coding sequence is divided into four exons. The first exon acts uniquely as the start codon, whereas exon 2 codes for a highly conserved region of the PAX9 protein, the paired domain, which is responsible for sequence-specific contacts with DNA [5, 6], http://www.ensembl.org/index.html. The vital importance of exon 2 is illustrated by an impressive absence of nucleotide sequence variation at this region among 44 species of mammals (V.R. Paixa˜o-Coˆrtes et al., unpublished data), as well as within and between human populations, and the identification of mutations in the paired domain as etiologic for several cases of both nonsyndromic hypodontia and oligodontia in our species (http://www.ncbi.nlm.
nih.gov/omim - OMIM#167416; OMIM#142893). Similarly, although the fourth exon of PAX9 lacks functional information, it is located in a region which is also relatively conserved across 44 mammalian species (V.R. Paixa˜o-Coˆrtes et al., unpublished data), and is involved in molar oligodontia in humans, indicating a prominent role of this exon for PAX9 function [7]. However, the expectation that a similar degree of evolutionary constraint might also be observed at exon 3 of PAX9 was not confirmed by us [4]. We have obtained evidence not only for a high level of human intraspecific variation, but also that a common polymorphism (Ala240Pro; rs4904210) is probably functional and could be associated with third molar agenesis, since 240Pro homozygotes might present a PAX9 protein with a slightly reduced DNA-binding capacity [4]. Additionally, our recent [8] as well as other family studies [9,10], showed that the derived 240Pro allele has a recessive pattern of inheritance with variable expressivity, since all homozy-gotes for it had congenital missing third molar(s); the number of missing teeth, however, was different for each affected individual, in agreement with Pereira et al’s hypothesis [4].
Here, we presented an analysis based on new PAX9 exon 3 sequence information and its exon-intron border regions from Native American, African, and Eskimo populations, which were integrated with published information encompassing all major human geographic groups. We also used data from HapMap Phase II [11] to identify signals of possible different genetic
backgrounds involved in the dental development in Africans and non-Africans. Finally, we explored the evolutionary scenario related to the origin and prevalence of the PAX9 polymorphisms, suggesting that exon 3 is an important agent in the ability to evolve (evolvability) of this extremely conserved gene.
Results
Mutations and polymorphic sites
A total of 590 base pairs, corresponding to PAX9 exon 3 and its 59and 39 flanking intronic regions were sequenced in 344 human chromosomes, and the data were analyzed together with other previously published sequences [4]. There are four polymorphic sites in the 59flanking and two in the 39 flanking intronic regions in the Apalaı´, Galibi, Mekranoti, European and African populations (Table 1). Only one of these, the variant allele A at position 36.205.241 was present in homozygous state in one Galibi individual. As for the sequence changes observed in exon 3, almost all were seen in heterozygosis, two exceptions being variants located at codons 239 and 240 (CRT, His239His; and G R C, Ala240Pro; see below).
We found several singletons in exon 3, representing new South American tribe-specific variants. They were the G R A (Ser226Asn) transition (Apalaı´), which is located in the same position as a previously described polymorphism found in the Bari from Venezuela (G RT, Ser226Ile); the G RA (Ala236Thr) transition (Tenharim); the T R A (Asn242Asp) transversion (Arara); and the A R T (Glu250Val) transversion (Apalaı´; Table 1). Another C R A (Glu251Lys) mutation, previously seen exclusively in the Guarani [4] was not observed in the present investigation. On the other hand, the derived T allele of the His239His single nucleotide polymorphism (SNP) previously observed only in the Kaingang of southern Brazil [4] was now also found among the Eskimo. Since this variant was also observed with relatively high frequencies in European (27%) and African (3%) populations, its presence among the Kaingang and Eskimo could be due to admixture with non-Amerindians.
The substitution of a G for A at chromosome 14 position 36.205.504, which results in an amino acid change at residue 240, was detected in the Mundurucu, Tenharim and Xikrin. Curiously, in this same position, variant C of the Ala240Pro SNP can be found. Our results indicate that the C/Pro allele is widely distributed in South Amerindians living in distant scattered geographic regions and speaking different linguistic stocks, as well as in Eskimos, suggesting that it came from Asia to the New World with the first migrants. Ala240Thr, on the other hand, seems to be an American autochthonous mutation, but with relatively ancient origin, since it is present in individuals who speak languages classified in the two major South Amerindian linguistic families (Tupian and Jeˆan; split at least ,5 thousand years before present [12]. Finally, allele T at the His239His SNP is only present in populations where the Ala240Pro allele C is also found (Table 1), but they occur in different individuals, indicating that the derived alleles, 239-T and 240-C, are not in linkage disequilibrium.
To better explore the results obtained with the Ala240Pro SNP, detailed information on its genotype and allele frequencies is given in Table 2. Although some sample sizes are small, C/Pro frequencies vary considerably over the 15 South American tribes analyzed: values range from zero (in seven populations) to 40% (Jamamadi). The highest and lowest C/Pro frequencies can be found in Asia (45%) and Africa (20%), respectively, while in Eskimos and Europeans (30%) the values are intermediate [4, 13, present study].
Genetic variability
Nucleotide diversity (p) values for PAX9 exon 3 and its intronic flanking regions are summarized in Table S1. Considering exon 3 only, values for p (x 104) for the Amerindian sample as a whole (16.4) are lower than those obtained for the Eskimos (37.2), Europeans (56.1), and Africans (28.1). Curiously the African value is lower than that observed for Europeans, contrasting with studies using neutral markers [14]. Table S1 also shows that the p values for exon 3 are generally several orders of magnitude higher than those calculated for the non-coding regions in all populations, indicating a reduced evolutionary constraint.
Demographic simulations and neutral/natural selection tests using PAX9 human data
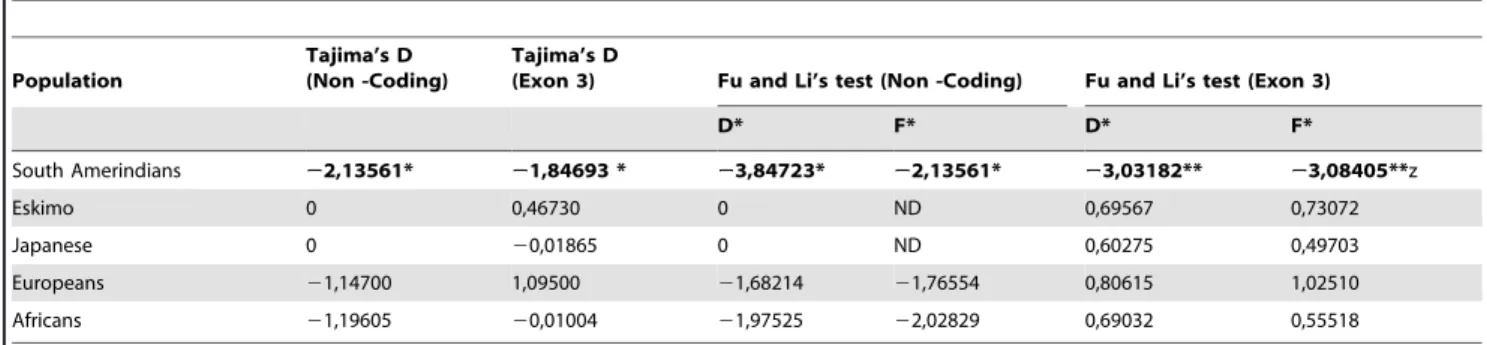
To better investigate the possibility of departures from a standard neutral model with the PAX9 human data, we used Tajima’s D, and Fu and Li’s D* and F* statistics, and afterwards considered them under the assumption of several demographic scenarios, since population history and demography can result in both negative or positive values for these statistics. The strong negative values found for South Amerindians (Table 3) are probably determined by demographic processes, since their significance is lost when scenarios of bottlenecks with later expansion are simulated (Table S2). Note, however, that for the remaining groups several values are positive and statistically significant under the different population growth scenarios, considering the exon 3 datasets only (Tables 3 and S2). Positive values for these statistics generally indicate an excess of intermediate frequency alleles which is incompatible with a simple neutral model.
Third molar agenesis and the Ala240Pro polymorphism
The number of CC/ProPro homozygotes (2%) observed in our Sub-Saharan samples is compatible with the frequency of agenesis in people that live in this African region (,2%, excluding Khoi-San and Pygmy[15–17]). On the other hand, the frequency of CC/ProPro homozygotes alone (7%, 7%, 25%) cannot explain the level of third molar agenesis among Eskimos (,18% [18]), Europeans (,20%; [17,19,20]) and Asians (47% [21]). In fact, our familial study [8] indicated that GG/ArgArg homozygotes also display third molar agenesis. Anthropological studies conducted with Native Americans, on the other hand, reveal that it is difficult to establish a general third molar agenesis pattern for Native Americans as a whole, due to the large amount of variation found (from zero to , 40% [18,22–25]. It seems that the Ala240Pro polymorphism has little influence in the level of third molar agenesis detected in Amerindian populations.
The search for distinct gene dental complexes using the HapMap panel
As indicated above, other genetic variants besides those of PAX9 should influence the dental, jaw and maxillary development in different human populations. We have therefore searched for possible distinct continental gene dental complexes using information from Africans, Europeans and Asians. Unfortunately, the available data for Native Americans are not sufficient to include them in the analysis. Data from 102 dental development genes and their adjacent regions were considered (release 21 - http://hapmap.ncbi.nlm.nih.gov/ [11]). Table S3 lists these genes and Table S4 the traits that are associated to them. The frequencies of 6,001 SNPs distributed along a 10 Mbp of the indicated region was then obtained and FSTvalues for African/
European, African/East Asian, and European/East Asian compari-sons were calculated. Higher FSTvalues (1.3%$0.6) were observed
when Africans were compared with Europeans or Asians. The former number is significantly higher than that estimated by Wu and Zhang [26] using a random gene panel. This excess of high FSTvalues can be
PAX9 Variability in Human Populations
Table 1.Mutations observed in PAX9 exon3a.
Populations (Numbers below the names indicate the total of chromosomes sequenced)b
Mutations Ache
´
Apalaı
´
Arara Bari Cayapo Guarani Galibi Jamamadi Kaigang Mekranoti Munducuru Tenharim Warao Xikrin Yucpa Eskimo Japanese European African
Region Position in chrom. 14 SNP Nucleotide change Amino acid change 40 18 42 8 2 10 14 10 40 10 16 16 8 34 8 88 28 30 94 59Flanking 36. 205. 241 C -.A 0 0 0 0 0 0 2 0 0 0 0 0 0 0 0 0 0 0 0 36. 205. 341 G -.A 0 0 0 0 0 0 0 0 0 1 0 0 0 0 0 0 0 0 0 36. 205. 356 G -.C 0 0 0 0 0 0 0 0 0 0 0 0 0 0 0 0 0 1 8 36. 205. 362 A -.T 0 1 0 0 0 0 0 0 0 0 0 0 0 0 0 0 0 0 0
Exon 3 36. 205. 463 G -.A Ser226Asn 0 1 0 0 0 0 0 0 0 0 0 0 0 0 0 0 0 0 0
36. 205. 463 G -.T Ser226Ile 0 0 0 1 0 0 0 0 0 0 0 0 0 0 0 0 0 0 0 36. 205. 492 G -.A Ala236Thr 0 0 0 0 0 0 0 0 0 0 0 1 0 0 0 0 0 0 0 36. 205. 503 rs12881240 C -.T His239His 0 0 0 0 0 0 0 0 1 0 0 0 0 0 0 3 0 8 3 36. 205. 504 rs4904210 G -.C Ala240Pro 0 2 3 0 0 0 1 4 5 0 1 2 0 2 0 26 4 7 19 36. 205. 504 G -.A Ala240Thr 0 0 0 0 0 0 0 0 0 0 1 2 0 1 0 0 0 0 0 36. 205. 510 T -.A Asn242Asp 0 0 1 0 0 0 0 0 0 0 0 0 0 0 0 0 0 0 0 36. 205. 535 A -.T Glu250Val 0 1 0 0 0 0 0 0 0 0 0 0 0 0 0 0 0 0 0 36. 205. 537 C -.A Glu251Lys 0 0 0 0 0 1 0 0 0 0 0 0 0 0 0 0 0 0 0 39Flanking 36. 205.575 G -.A 0 0 0 0 0 0 0 0 0 0 0 0 0 0 0 0 0 0 1 36. 205.611 G -.A 0 0 0 0 0 0 0 0 0 1 0 0 0 0 0 0 0 0 1 a
Sequence of 588 bp corresponding to PAX9 exon 3 (137 bp) and its 59and 39 flanking intronic segments (232 bp and 219 bp, respectively). Numbers in columns 6–24 are those observed for the derived allele in each population. bSources: Present study, Apalaı´, Arara, Cayapo, Galibı´, Jamamadı´, Mekranoti, Munducuru, Tenharim, Xikrin, Eskimo, and Africans. Ache´, Bari, Guarani, Kaingang, Warao, Yucpa, Japanese, and Europeans [4].
doi:10.1371/journal.pone.0015656.t001 PAX9 Variability in Human Populati ons ONE | www.plos one.org 3 January 2011 | Volume 6 | Issue 1 | e15656
a signal for natural selection, since population-specific positive selection tends to increase FST[27].
Additionally, a high proportion (65–70%) of extreme integrated haplotype score (iHS) negative values (,23.0), for the top score PAX9 SNPs was observed for Asians and Europeans (Table S5), while in Africans, SNPs with extreme iHS negative values represented only 30% of the cases. An excess of extreme iHS negative values can indicate that the derived alleles (or haplotypes)
have swept up in frequency, an indication of positive selection [28]. On the other hand, the extreme iHS positive values for Africans occur in 70% of the cases. This indicates that the ancestral alleles have been fixed preferentially in Africa [28].
These results reinforce the idea that PAX9 is not the unique gene involved in the dental development and that only an approach based on gene network can lead to a more comprehen-sive view of the complex biology involved.
Table 3.Statistical tests to detect departures from a standard neutral modela.
Population
Tajima’s D (Non -Coding)
Tajima’s D
(Exon 3) Fu and Li’s test (Non -Coding) Fu and Li’s test (Exon 3)
D* F* D* F* South Amerindians 22,13561* 21,84693 * 23,84723* 22,13561* 23,03182** 23,08405**z Eskimo 0 0,46730 0 ND 0,69567 0,73072 Japanese 0 20,01865 0 ND 0,60275 0,49703 Europeans 21,14700 1,09500 21,68214 21,76554 0,80615 1,02510 Africans 21,19605 20,01004 21,97525 22,02829 0,69032 0,55518
aSequence data from the present study and [4]. Statistical significance:
*P,0.05;
**P,0.02, ND: Not determined. doi:10.1371/journal.pone.0015656.t003
Table 2.Genotype and allele distributions of the Ala240Pro polymorphism in 15 South Amerindian and other human populationsa.
Population Number of individuals Genotype frequency Allele frequency References Ala/Ala G/G(%) Ala/Pro G/C (%) Pro/Pro C/C (%) G (Ala) C (Pro)
South Amerindian
Ache´ 20 20 (100) 0 0 1 0 [4]
Apalaı´ 9 7 (78) 2 (22) 0 0.89 0.11 Present study Arara 21 18 (86) 3 (14) 0 0.86 0.14 Present study
Bari 4 4 (100) 0 0 1 0 [4]
Cayapo´ 1 1 (100) 0 0 1 0 Present study Galibi 7 6 (86) 1 (14) 0 0.86 0.14 Present study
Guarani 5 5 (100) 0 0 1 0 [4]
Jamamadi 5 2 (40) 2(40) 1(20) 0.6 0.40 Present study Kaigang 20 15 (75) 5 (25) 0 0.88 0.12 [4] Mekranoti 5 5(100) 0 0 1 0 Present study Munducuru 8 7 (88) 1(12) 0 0.94 0.06 Present study Tenharim 8 6 (75) 2 (25) 0 0.88 0.12 Present study
Warao 4 4 (100) 0 0 1 0 [4]
Xikrin 17 15 (88) 2 (12) 0 0.94 0.06 Present study
Yucpa 4 4 (100) 0 0 1 0 [4]
Total 138 119 (86) 18 (13) 1 (,1) 0.91 0.08
Eskimo 44 21(48) 20(45) 3 (7) 0.70 0.30 Present study Asiansb 116 40 (35) 47 (40) 29 (25) 0.55 0.45 [4,15]
Europeansc 365* 169 (46) 172 (47) 24 (7) 0.70 0.30 [4]
Africans 47 29 (62) 17 (36) 1 (2) 0.80 0.20 Present study
aData obtained from RFLP or sequencing; bChinese and Japanese;
cSpaniards and Polish.
doi:10.1371/journal.pone.0015656.t002
PAX9 Variability in Human Populations
Discussion
Even considering that many polymorphisms are eliminated or fixed as a consequence of genetic drift, it is expected that part of the human molecular diversity is a result of variable selective pressures in different geographical regions, each with its own different climate, pathogens and sources of food [29–32]. Additionally, natural selection may act differently in distinct genome segments. While portions of a given gene, for example, are largely invariable due to a strong purifying selection, other regions may vary due to positive selection, relaxation of purifying selection, and/or balanc-ing selection [33,34]. The present work illustrates this concept, demonstrating that the human PAX9 might be a good example of these interpopulation and intragene evolutionary dynamics.
By analyzing genetic variation in several Native American tribes, one Eskimo population and other major human groups, we provide evidence for higher nucleotide diversity in exon 3 than in the non-coding sequences of the human PAX9. Given the features previously associated with other segments of PAX9 (i.e. a high degree of conservation due to strong purifying selection in exons as well as in intronic regions across species [4], a pertinent question is why the third exon of this gene possesses such dissimilar pattern of nucleotide diversity when compared to other coding and non-coding regions.
In about 60,000 years, modern humans left Africa and colonized all other continents, with the exception of Antarctica [35,36]. Since then, human populations have lived in an extraordinary variety of habitats. Additionally, for many human populations, the diet and life style changed drastically due to cultural practices. In this context, a lower number of teeth could be advantageous in populations with progressive reduction of the dental arches and a diet based on processed food, since it would prevent impacted and defective third molars, as well as related-oral problems, an important cause of morbidity in non-industrial societies [4,37]. Since PAX9 has a crucial role in skeleton, thymus and parathyroid glands organogenesis [38–40] it is valid to speculate that the high level of diversity in only one specific region of the gene might offer options for selection in a context as those resulting from dispersal to new habitats or rapid cultural changes. Biologists have increasingly been asking whether evolvability, the ability of a biological system to evolve, itself evolves, and whether this phenomenon is a result of natural selection or a by- product of other evolutionary processes [41]. PAX9 exon 3 could be a good molecular example as how evolvability develops, since it may have been an alternative to promote functional adaptations in human dentition. Our results, based on demographic simulations and neutral selection tests, showed that the variation found in PAX9 exon 3 is incompatible with a simple neutral model, being consistent with the fact that at least one variant at this exon (Ala240Pro) might be functional.
Finally, our databank analysis detected a complex involving PAX9 and 101 other genes related to dentition that can be under different patterns of evolution in Africa and in other continents, defining at least some dental morphological differences between Sub-Saharan Africans and non-Africans, probably associated with adaptations after the modern human exodus from Africa.
Methods
Populations examined
PAX9 exon 3 and its flanking intronic sequences were obtained from 172 individuals from nine South Amerindian (N = 81) one Siberian Eskimo (N = 44) and a composite Sub-Saharan African sample (N = 47). Nucleotide sequences of the same DNA region from 15 Europeans, 14 Japanese and 57 South Amerindians were re-analyzed based on our previous investigations [4]. Additional
data for the Ala240Pro (rs4904210) polymorphism were obtained through HAPMAP (http://www.hapmap.org/cgi-perl/[11]) and dbSNP (http://www.ncbi.nlm.nih.gov/projects/SNP/) databases. Relevant information about the new populations studied is provided in Supplemental Material Table S6.
Ethical approval for the present study was provided by the Brazilian National Ethics Commission (CONEP Resolution no. 123/98) for the Amerindian and Siberian samples, as well as by ethics committee of Hoˆpital Robert Debre´, Paris France for the African ones. Informed oral consent was obtained from all participants, since they were illiterate, and they were obtained according to the Helsinki Declaration. The ethics committees approved the oral consent procedure.
DNA extraction, PCR amplification and sequencing
Genomic DNA was extracted from plasma and glycerolized red blood cells stored in our laboratory as a result of previous studies, listed in Table S6, using the QIAamp DNA MiniKit (Qiagen) and following the manufacturer’s instructions. Non-Brazilian samples were collected and processed as indicated in the references given in Table S6.
PAX9 exon 3 (137 bp) and its 59and 39 flanking intronic segments (232 bp and 219 bp, respectively) were amplified using primers and conditions described elsewhere [4]. The PCR products were purified following the Exonuclease I and Alkaline Phosphatase (Amersham Biosciences - GE Healthcare) protocols. Both DNA strands were sequenced using MegaBace500 and MegaBace1000 (Amersham Biosciences - GE Healthcare) se-quencing machines. Whenever a putative mutation was identified, the sample was re-amplified and re-sequenced for confirmation.
Data analysis
Sequences were aligned and their quality as well as the assessment of the accuracy of the resulting data, were obtained using the Phred, Phrap and Consed programs (http://www. genome.washington.edu). Additionally, all chromatograms were visualized and checked manually.
For all groups with exon 3 PAX9 sequences available one population parameter was estimated using Arlequin 3.11 (http:// cmpg.unibe.ch/software/arlequin3/): nucleotide diversity (p) [2] To detect departures from a standard neutral model, we used Tajima’s D [42] and Fu and Li’s D* and F* [43] tests (implemented using Mega 4.0 [44] and DnaSP 4.10.9 [45]. Significantly positive and negative values for these statistics lead to the rejection of the null hypothesis of mutation-drift equilibrium. However, since it is well-known that these parameters are also affected by the demographic histories of the population considered [29], we incorporated in the analysis coalescence simulations using Rogers’ algorithm [46] as implemented by [47] in the DFSC 1.1 software (www.xmission.com/˜wooding/DFSC/). Distinct scenar-ios on times of expansion and initial population sizes compatible with the available data were simulated as follows: 1) For all samples, initial populations of 1,000 or 10,000 individuals [48,49] starting 60,000 years ago [35,36,49]; 2) For all non-African populations, initial population of 10,000, date 40,000 years ago; 3) For Japanese only, 3,000 starting individuals, date 37,000 years ago [50]; 4) For the Native American and Eskimo dataset, initial populations of 80 or 500 individuals [51,52], starting 18,000 years ago [51,53]. For all scenarios described above we considered assumptions of population growth ranging from 1-fold (stationary) to 100-fold. The substitution rate (m) used to obtain the h values
under the different scenarios was 161029 [47].
Based on the approach used by Wu and Zhang [26], we also searched a set of genes related with dental development using the
Gene Ontology database (browser AmiGO - http://amigo. geneontology.org/cgi-bin/amigo/browse.cgi [54]). This proce-dure allowed the selection of 102 genes (including PAX9) located in the autosomes (Table S3). The function of these genes was verified using GeneDeks V3 software (http://www.genecards.org/ [55]- Table S4). The major trait phenotype associated to these genes was growth/size (63,11%) followed by craniofacial charac-teristics (57,28%). A region covering 10 Mbp, upstream of the 59 end and downstream of the 39 terminus for each of the 102 genes was used to select SNPs, and a total of 6,001 SNPs were selected. Their allele frequencies were retrieved from HapMap Phase II (release 21 - http://hapmap.ncbi.nlm.nih.gov/ [11]) from three populations: African (YRI panel including 60 Yoruban individuals from Ibadan), European (CEU panel including 60 Utah residents with northern and western Europe ancestry) and 89 East Asian (ASN panels including Han Chinese- HCB and Japanese from Tokyo-JPT). Unfortunately, the rs4904210 Ala240Pro polymor-phism is not included in these panels. FSTvalues between African
(YRI)/European (CEU), African (YRI)/East Asian (EA) and European (CEU)/East Asian (EA), as well as iHS (integrated haplotype score statistic, used for scanning single nucleotide polymorphism data for signals of selection [28] were recovered from the Haplotter http://haplotter.uchicago.edu/selection/ and SNP@Evolution (http://bighapmap.big.ac.cn/;[56]) databases.
Supporting Information
Table S1 Additional information’s about mutations and nucle-otide sequence diversity estimates of PAX9 exon 3 and non-exon 3 bordering regions in several human populations.
(DOC)
Table S2 P values of Tajima’s D, and Fu and Lis D and F statistics calculated under several demographic scenar-ios
(XLS)
Table S3 List of dental development genes. (XLS)
Table S4 Traits associated to 102 genes (XLS)
Table S5 Integrated haplotype score (iHS) values for the top score SNPs of PAX9
(DOC)
Table S6 Sample sizes, geographic location, and linguistic information on fifteen South Amerindian, one Eskimo and one composite African populations investigated in this study
(DOC)
Acknowledgments
Thanks are due to the people who, after appropriate informed consent, donated saliva and blood for this investigation. The logistic support of the National Indian Foundation (Fundac¸a˜o Nacional do I´ndio-FUNAI) in the Brazilian field work is gratefully acknowledged. We also thank S. L. Bonatto for the Eskimo sample and V. A. Alonso, M.E. Delgado-Burbano, and J. Go´mez-Valde´s for sources of information about third molar agenesis.
Author Contributions
Conceived and designed the experiments: MCB VRP-C. Performed the experiments: VRP-C. Analyzed the data: MCB VRP-C FMS. Contributed reagents/materials/analysis tools: DM TVP SM WASJ MAZ JE RK. Wrote the paper: MCB VRP-C FMS.
References
1. Lee I, Lehner B, Crombie C, Wong W, Fraser AG, Marcotte EM (2008) A single gene network accurately predicts phenotypic effects of gene perturbation in Caenorhabditis elegans. Nat Genet 2: 181–188.
2. Nei M (1987) Molecular evolutionary genetics. New York: Columbia Univ Press. 3. Nei M (2007) The new mutation theory of phenotypic evolution. Proc Natl Acad
Sci USA 104: 12235–12242.
4. Pereira TV, Salzano FM, Mostowska A, Trzeciak WH, Ruiz-Linares A, et al. (2006) Natural selection and molecular evolution in primate PAX9 gene, a major determinant of tooth development. Proc Natl Acad Sci USA 103: 5676–5681. 5. Xu W, Rould MA, Jun S, Desplan C, Pabo CO (1995) Crystal structure of a paired domain-dna complex o at 2,5 a resolution reveals structural basis for Pax Developmental Mutations. Cell 80: 639–650.
6. Chi N, Epstein JA (2002) Getting your Pax straight: Pax proteins in development and disease. Trends Genet 18: 41–47.
7. Frazier-Bowers SA, Guo DC, Cavender A, Xue L, Evans B, et al. (2002) A novel mutation in human PAX9 causes molar oligodontia. J Dent Res 81: 129–133. 8. Paixa˜o-Cortes VR, Braga TS, Salzano FM, Munsdstock KS, Mundstock CA,
et al. (2010) PAX9 and MSX1 transcription genes in non-syndromic dental agenesis. Arch Oral Biol (in press).
9. Trimmell JB (2004) A mutation of PAX9 associated with congenitally missing teeth. M. Sc. Dissertation, Kansas City: University of Missouri.
10. Kula K, Trimmell J, lu Y, Briscoe P, Feng JQ (2008) Tooth agenesis in a family and homozygous PAX9 mutation in exon 3: a case report. World J Orthod 9(4): e55–61.
11. The International HapMap Consortium (2007) A second generation human haplotype map of over 3.1 million SNPs. Nature 449: 851–861.
12. Urban G (1998) A histo´ria da cultura brasileira segundo as lı´nguas nativas. In: Carneiro da Cunha MC, ed. Histo´ria dos ı´ndios no Brasil. Sa˜o Paulo: Companhia das Letras. pp 87–102.
13. Pan Y, Wang L, Ma J, Zhang W, Wang M, et al. (2008) PAX9 polymorphisms and susceptibility to sporadic tooth agenesis: a case-control study in southeast China. Eur J Oral Sci 116: 98–103.
14. Wang S, Lewis CM, Jakobsson M, Ramachandran S, Ray N, et al. (2007) Genetic variation and population structure in Native Americans. PloS Genet 3: e185.
15. Irish JD (1993) Biological affinities of late Pleistocene through modern African aboriginal populations: the dental evidence. Ph.D. Dissertation, Tempe: Arizona State University.
16. Chagula WK (1960) The age at eruption of third permanent molars in male East Africans. Am J Phys Anthropol 18: 77–82.
17. Rozkovcova´ E, Markova´ M, Dolejsı´ J (1999) Studies on agenesis of third molars amongst populations of different origin. Sb Lek 100: 71–84.
18. Turner CG II (1986) The first Americans: the dental evidence. Natl Geogr Res 2: 37–46.
19. Rozkovcova´ E, Markova´ M, La´nı´k J, Zva´rova´ J (2004) Development of third molar in the Czech population. Prague Med Rep 105: 391–422.
20. Rozkovcova´ E, Markova´ M, La´nik J, Zva´rova´ J (2004) Agenesis of third molars in young Czech population. Prague Med Rep 105: 35–52.
21. Turner CG II (1987) Late Pleistocene and Holocene population history of East Asia based on dental variation. Am J Phys Anthropol 73: 305–321. 22. Sutter R (2005) The prehistoric peopling of the South America as inferred from
epigenetic dental traits. Andean Past, Vol. 7. Ithaca: Cornell University. 23. Go´mez-Valde´s J (2005) Antropologı´a dental en poblaciones del Occidente de
Mesoame´rica. Tesis Licenciatura en Antropologı´a Fı´sica. Me´xico: Escuela Nacional de Antropologı´a e Historia.
24. Turner CG II, Bird J (1981) Dentition of Chilean paleo-Indians and peopling of the Americas. Science 212: 1053–1055.
25. Hydenblit R (1996) Dental variation among four prehispanic Mexican populations. Am J Phys Anthropol 100: 225–246.
26. Wu DD, Zhang YP (2010) Positive selection drives population differentiation in the skeletal genes in modern humans. Hum Mol Genet 19: 2341–2346. 27. Barreiro LB, Laval G, Quach H, Patin E, Quintana-Murci L (2008) Natural
selection has driven population differentiation in modern humans. Nat Genet 40: 340–345.
28. Voight BF, Kudaravalli S, Wen X, Pritchard JK (2006) A map of recent positive selection in the human genome. PLoS Biol 4: e72.
29. Bamshad M, Wooding SP (2003) Signatures of natural selection in the human genome. Nat Rev Genet 4: 99–111.
30. Harris EE, Meyer D (2006) The molecular signature of selection underlying human adaptations. Yearb Phys Anthropol 49: 89–130.
31. Hughes DA, Tang K, Strotmann R, Scho¨neberg T, Prenen J, et al. (2008) Parallel selection on TRPV6 in human populations. PLoS One 3: e1686. 32. Acun˜a-Alonzo V, Flores-Duarte T, Kruit J, Villareal-Molina T,
Arellano-Campos O, et al. (2010) A functional ABCA1 gene variant is associated with low HDL-cholesterol levels and shows evidence of positive selection in Native Americans. Hum Mol Genet 19: 2877–2885.
PAX9 Variability in Human Populations
33. Yang Z, Nielsen R, Goldman N, Pedersen AM (2000) Codon-substitution models for heterogeneous selection pressure at amino acid sites. Genetics 155: 431–449.
34. Hughes AL (2007) Looking for Darwin in all the wrong places: the misguided quest for positive selection at the nucleotide sequence level. Heredity 99: 364–373.
35. Alonso S, Armour JA (2001) A highly variable segment of human subterminal 16p reveals a history of population growth for modern humans outstide Africa. Proc Natl Acad Sci USA 98: 864–869.
36. Santos-Lopes SS, Pereira RW, Wilson IJ, Pena SD (2007) A worldwide phylogeography for the human X chromosome. PLoS One 2: e557. 37. Silvestri AR, Jr., Singh I (2003) The unresolved problem of the third molar:
would people be better off without it? J Am Dent Assoc 134: 450–455. 38. Peters H, Neubu¨ser A, Balling R (1998) PAX genes and organogenesis: PAX9
meets tooth development. Eur J Oral Sci 106: 38–43.
39. Hetzer-Egger C, Schorpp M, Boehm T (2000) Evolutionary conservation of gene structures of the PAX1/9 gene family. Biochim Biophys Acta 1492: 517–521.
40. Santagati F, Abe K, Schmidt V, Schmitt-John T, Suzuki M, et al. (2003) Identification of cis-regulatory elements in the mouse Pax9/Nkx2-9 genomic region: implication for evolutionary conserved synteny. Genetics 165: 235–242. 41. Pigliucci M (2008) Is evolvability evolved? Nature 9: 75–82.
42. Tajima F (1989) Statistical method for testing the neutral mutation hypothesis by DNA polymorphism. Genetics 123: 585–595.
43. Fu YX, Li WH (1993) Statistical tests of neutrality of mutations. Genetics 133: 693–709.
44. Tamura K, Dudley J, Nei M, Kumar S (2007) MEGA4: Molecular Evolutionary Genetics Analysis (MEGA) software version 4.0. Mol Biol Evol 24: 1596–9. 45. Rozas J, Sa´nchez-DelBarrio JC, Messeguer X, Rozas R (2003) DnaSP, DNA
polymorphism analyses by the coalescent and other methods. Bioinformatics 19: 2496–2497.
46. Rogers J, Comuzzie AG (1995) When is ancient polymorphism a potential problem for molecular phylogenetics? Am J Phys Anthropol 98: 216–218. 47. Wooding S, Ostler C, Prasad BV, Watkins WS, Sung S, et al. (2004) Directional
migration in the Hindu castes: inferences from mitochondrial, autosomal and Y-chromosomal data. Huma Genet 115: 221–229.
48. Liu H, Prugnolle F, Manica A, Balloux F (2006) A geographically explicit genetic model of worldwide human-settlement history. Am J Hum Genet 79: 230–237. 49. Fagundes NJ, Ray N, Beaumont M, Neuenschwander S, Salzano FM, et al. (2007) Statistical evaluation of alternative models of human evolution. Proc Natl Acad Sci USA 104: 17614–17619.
50. Cavalli-Sforza LL, Menozzi P, Piazza A (1994) The history and geography of human genes. Princeton: Princeton University Press.
51. Fagundes NJ, Kanitz R, Eckert R, Valls AC, Bogo MR, et al. (2008) Mitochondrial population genomics supports a single pre´-Clovis origin with a coastal route for the peopling of the Americas. Am J Hum Genet 82: 585–592. 52. Hey J (2005) On the number of New World founders: a population genetic
portrait of the peopling of the Americas. PLoS Biol 3: e193.
53. Gonza´lez-Jose´ R, Bortolini MC, Santos FR, Bonatto SL (2008) The peopling of America: craniofacial shape variation on a continental scale and its interpretation from an interdisciplinary view. Am J Phys Anthropol 137: 175–187.
54. The Gene Ontology Consortium Gene ontology: tool for the unification of biology. Nat Genet May 2000;25(1): 25–9.
55. Stelzer G, Inger A, Olender T, Iny Stein T, Dalah I, et al. (2009) GeneDecks: paralog hunting and gene-set distillation with GeneCards annotation. OMICS, 2009 13(6).
56. Cheng Feng, Chen Wei, Richards Elliott, Deng Libin, Zeng Changqing (2009) SNP@Evolution: a hierarchical database of positive selection on the human genome. BMC Evolutionary Biology 2009 9: 221.