doi: 10.1098/rspb.2008.0354
, 2195-2199
275
2008
Proc. R. Soc. B
Tiina M Mattila and Folmer Bokma
Extant mammal body masses suggest punctuated equilibrium
Supplementary data
ml http://rspb.royalsocietypublishing.org/content/suppl/2009/02/17/275.1648.2195.DC1.ht "Data Supplement"References
http://rspb.royalsocietypublishing.org/content/275/1648/2195.full.html#ref-list-1 This article cites 18 articles, 5 of which can be accessed freeSubject collections
(1261 articles)
evolution
Articles on similar topics can be found in the following collections
Email alerting service
right-hand corner of the article or click Receive free email alerts when new articles cite this article - sign up in the box at the topherehttp://rspb.royalsocietypublishing.org/subscriptions
go to: Proc. R. Soc. B To subscribe to
Extant mammal body masses suggest
punctuated equilibrium
Tiina M. Mattila
†and Folmer Bokma*
Department of Ecology and Environmental Sciences, Umea˚ University, 90187 Umea˚, Sweden
Is gradual microevolutionary change within species simultaneously the source of macroevolutionary differentiation between species? Since its first publication, Darwin’s original idea that phenotypic differences between species develop gradually over time, as the accumulation of small selection-induced changes in successive generations has been challenged by palaeontologists claiming that, instead, new species quickly acquire their phenotypes to remain virtually unchanged until going extinct again. This controversy, widely known as the ‘punctuated equilibrium’ debate, remained unresolved, largely owing to the difficulty of distinguishing biological species from fossil remains. We analysed body masses of 2143 existing mammal species on a phylogeny comprising 4510 (i.e. nearly all) extant species to estimate rates of gradual (anagenetic) and speciational (cladogenetic) evolution. Our Bayesian estimates from mammals as well as separate sub-clades such as primates and carnivores suggest that gradual evolution is responsible for only a small part of body size variation between mammal species.
Keywords: macroevolution; morphological evolution; phylogenetics; speciation; stasis
1. INTRODUCTION
Charles Darwin apparently hypothesized not only that natural selection causes microevolutionary changes in the average phenotype of populations from one generation to another, but also that, accumulated over thousands of years, these same changes account for phenotypic differences between species (Mayr 1982; Gould 2002). In the fossil record, however, species often appear suddenly different, to remain largely unchanged until they disappear again (Stanley 1998). For example, the European mammoth survived the climatic vicissitudes of the last ice age with apparently little phenotypic change, as Hugh Falconer pointed out to Darwin, after which Darwin added to the third edition of ‘The origin’ the following: ‘It is a more important consideration, clearly leading to the same result, as lately insisted on by Dr. Falconer, namely, that the periods during which species have been under-going modification, though very long as measured by years, have probably been short in comparison with the periods during which these same species remained without undergoing any change’ (Stanley1981,1998).
Paradoxically however, after the success of the theory of microevolution by means of natural selection in the twentieth century, Darwin’s idea of macroevolution as the long-term consequence of microevolution was the ruling paradigm when, just over 35 years ago,Eldredge & Gould (1972) introduced their theory of ‘punctuated equilibrium’. This theory, which hypothesizes that inter-specific morphological change is concentrated in rapid bursts triggered by speciation, has fuelled speculation about the mode of character evolution ever since (Gould &
Eldredge 1993;Gould 2002). The theory proved hard to test, however, because speciation typically occurs on a time span many times the duration of a biological experiment, and because species from fossil remains can be distin-guished only if morphologically distinct (Stebbins & Ayala 1981). Cryptic species, for example, would not be distinguished in the fossil record, morphologically similar ecomorphs (Losos et al. 1998) would go unnoticed, and replacement of local ecotypes with populations from elsewhere might be mistaken as a sudden morphological shift. Consequently, the importance of gradual and ‘punctuational’ evolution for the origin of morphological diversity in biological species remains largely unknown.
Fortunately, fossil morphology is not the only source of information concerning the mode of evolution. Molecular phylogenies substitute for the time frame provided by the fossil record and allow gradual evolution and punctuated equilibrium to be distinguished based on phenotypes of extant species (Pagel 1999;Pagel et al. 2006): if phenotypic evolution is concentrated in short periods of time when new species emerge, even young sister species could show significant phenotypic differentiation, whereas Darwin’s original view of gradual change implies that interspecific phenotypic variance requires sufficient time to develop (Avise 1977). Therefore, we can estimate separately the rates of both speciational and gradual phenotypic evolution from a phylogeny and phenotypes of present-day species, without reference to fossil morphology (Avise 1977;
Ricklefs 1980;Douglas & Avise 1982;Lemen & Freeman 1989;Mooers & Schluter 1998;Bokma 2002).
We estimated rates of gradual (anagenetic) and speciational (cladogenetic) body size evolution from body masses of 2143 of 4510 present-day mammal species on a composite phylogenetic tree that represents 99% of existing species (Bininda-Emonds et al. 2007). A novel Bayesian algorithm (Bokma in press) allowed us to simultaneously estimate speciation and extinction Proc. R. Soc. B (2008) 275, 2195–2199 doi:10.1098/rspb.2008.0354 Published online 2 July 2008
Electronic supplementary material is available athttp://dx.doi.org/10.
1098/rspb.2008.0354or viahttp://journals.royalsociety.org.
* Author for correspondence ([email protected]). †Present address: Department of Biology, Oulu University, 90014 Oulu, Finland.
probabilities, thus taking into account uncertainty in the number of extinct lineages and speciation events that do not show on a phylogeny reconstructed from extant species. Thereby, we overcome the major drawback of previous methods to estimate the mode of evolution from neontological data (Avise 1977; Ricklefs 1980;
Douglas & Avise 1982; Lemen & Freeman 1989;
Mooers & Schluter 1998).
2. MATERIAL AND METHODS (a)Estimation algorithm
We estimated rates of anagenetic and cladogenetic body size evolution assuming a branching Brownian motion model of evolution of the logarithmic phenotype (Bokma 2002), with speciation and extinction rates l and m and variances of Brownian motion s2
a per Myr (anagenetic) and s2c at the
instant a new species is born (cladogenetic). s2cZ 0 means evolution is purely gradual; that is, newborn species have the same phenotype as their parent. According to this model, the logarithmic body size change over a branch of the phyloge-netic tree is normally distributed with zero mean and variance tbs2aCSs2c, where tbis the branch length, S is the number of
speciations on the branch, and s2a and s2c are the ‘rates’ of
evolution per unit time and speciation event, respectively (Bokma 2002). It may appear counter-intuitive that a branch contains speciation events, but we are analysing a recon-structed phylogeny (sensuNee et al. 1994), pruned of extinct lineages. The speciation events that do not appear on the reconstructed tree may have affected the phenotypes of extant species (Bokma 2002). Given tb and S, the
likelihood of body size change over a branch depends only on s2
aand s2c, and the likelihood of the tree is simply the sum of
its branches’ likelihoods.
Obviously, S is not known, and neither are the body size changes over the branches, because we only have body sizes of some existing species. Therefore, all unknown parameters (i.e. S, the body sizes of all ancestral species, and the body sizes of extant species for which we had no measurements) were estimated from Monte Carlo Markov chains con-structed by Metropolis–Hastings sampling, started from arbitrary initial values (Bokma in press). Inference of S is the critical part of the estimation procedure. S consists of two parts: SZSoCSh, where Sois the speciation event that marks
the origin of the branch (and can be observed from the tree) and Shis the number of speciations that are hidden on the
branch. We assume that only newborn species undergo cladogenetic evolution, so that Sois either 1 or 0, depending
on whether or not the focal branch represents the newborn species. Of course, we cannot detect from the tree alone which was the newborn species, but the phenotypic data may favour one assignment over the other. Shmay assume any
(integer) value. Given probabilities of speciation and extinction l and m, respectively, and assuming l and m are constant across the tree, S can to a good approximation be sampled from a Poisson distribution (Bokma in press). l and m in turn can be estimated from the phylogenetic tree (Nee et al. 1994;Bokma 2003). Here, we used the likelihood of the distribution of species over the 83 taxa older than (arbitrarily) 50 Myr defined by the phylogenetic tree (Bininda-Emonds et al. 2007) to Metropolis–Hasting sample l and m. When analysing sub-clades (see below), we estimated l and m from the branching times of the sub-clade tree with a Bayesian modification ofNee et al.’s (1994)method that allowed us to
simultaneously estimate uncertain branching times resulting from polytomies.
The composite phylogeny used for the present analyses (Bininda-Emonds et al. 2007) contains many polytomies: 27% of all branches. Because we cannot evaluate gradual phenotypic change on zero-length branches, and because the lengths of these branches are obviously incorrect, zero-length branches as well as their immediate descendant branches were excluded from all analyses (except estimation of l and m). Estimates were obtained from every 50th sample from MCMC chains of 50 000 iterations after a burn-in of 5000 iterations.
(b)Data
Body size data (expressed in kg or ln(kg) throughout) were obtained mainly from Silva & Downing (1995). Where multiple measurements were reported per species, mean, minimum and maximum body sizes were averaged, if applicable per sex. If only a range of body sizes was available, the average was calculated as the range midpoint. Sub-sequently, if available the average of both sexes was used, otherwise the average of whatever data available. These average body masses are only estimates of the actual mean body size of a species, and therefore the latter was sampled during analyses from a normal prior distribution centred on the logarithm of the calculated average. If data from both sexes were available, the prior was assigned standard deviation 0.025, otherwise 0.05 (logarithmic scale). Con-sidering an average intraspecific phenotypic variance of 0.14m, where m is species average body size (see below) and assuming m were calculated from approximately 10 individ-uals per species, our priors are rather wide. (For comparison, the interspecific standard deviation of logarithmic body masses of all mammals is 3.10).
Assuming that the minimum and maximum body sizes reported in the literature typically enclose 95% of individ-uals, we calculated the phenotypic standard deviation s as a quarter of the reported size range. Regression of s on m yielded a neat log–linear relationship ln(s)Zln(m)K2, implying that sZ0.14m.
3. RESULTS
(a)Empirical estimates
First, we set s2cZ 0 and estimated s2aZ 0:0696 (95% CI
0.0631–0.0778) from the complete phylogenetic and body mass data. This is the estimated variance of logarithmic body mass change over a Myr if species do not change upon speciation. It is a useful reference value, as it does not depend on l, m or Sh. The rate of gradual evolution
s2a refers to evolution on a logarithmic scale, but it has
a straightforward interpretation on the ‘conventional’ body mass scale (Lynch 1990; Bokma 2002): over a Myr, the expected body mass change of a mammal species, expressed as a fraction of its mean body mass is saZ
ffiffiffiffiffiffiffiffiffiffiffiffiffiffiffi 0:0696
p
Z 26%. Subsequently, we released s2c.
Esti-mating both rates of evolution simultaneously, we obtained the significantly lower estimate s2
aZ 0:0024 (0.0002–
0.0133) and s2cZ 0:164 (0.135–0.192). Now also s2a is
affected, through s2c, by the estimates of l, m and Sh, which
explains the larger confidence intervals (figure 1).
The above calculations assume that body mass changes in all mammal species have come from the same two normal distributions with variances s2
a and s2c, but it is
possible that different parts of the phylogenetic tree have 2196 T. M. Mattila & F. Bokma Punctuated evolution of mammal body size
experienced different rates of body size evolution. There-fore, we analysed separately two parts of the phylogeny that are well resolved: carnivores (11% zero-length branches) and primates (14% zero-length branches). Body sizes were available for 220 of 230 primate and 240 of 268 carnivore species. Again, we first estimated only s2a, setting s2cZ 0, and found s2aZ 0:0333 (CI 0.0234–
0.0501) for primates and s2
aZ 0:108 (CI 0.083–0.142) for
carnivores, suggesting that if evolution were purely gradual, body size evolved three times faster in carnivores than in primates. Subsequently, both parameters were estimated simultaneously, yielding for primates s2
aZ
0:0145 (0.0030–0.0337) and s2
cZ 0:0360 (0.0018– 0.1213), and for carnivores s2aZ 0:0156 (0.0037–0.0333)
and s2cZ 0:0358 (0.0024–0.1138).
It is possible that by underestimating l and m, we underestimated Sh and overestimated s2c or vice versa.
Therefore, we quantified the proportions of observed interspecific phenotypic variance vobs (on a logarithmic
scale) explained by gradual evolution by simulating 100 variances vsim under purely gradual evolution with the
estimated values s2aZ 0:0024, 0.0145 and 0.0156 for
mammals, primates and carnivores, respectively. vsim
represents the effect of s2a (which is independent of l, m
and Sh) while the remaining part of the observed
interspecific variance vobsKvsimis due to s2c. For mammals,
primates and carnivores, gradual evolution explains 2.3, 34 and 20% of interspecific body size variance, respectively.
Finally, we identified parts of the tree with less than 50% zero-length branches, body size data for more than 50% of extant species and more than 50 but less than 500 extant species. Seven non-overlapping sub-clades met these requirements and were used to estimate rates of evolution in the same way as explained above for mammals, carnivores and primates. Two of these clades largely correspond to the carnivores and primates and yield very similar estimates of rates of evolution (table 1). Another two clades also yield very similar estimates, but two taxa yield aberrantly high estimates.
(b)Theoretical estimates
In the absence of natural selection, the per-generation change in the average phenotype of a population depends
only on its genetic variation and population size, in such a way that s2
azh2s2=t=N (Lande 1976), where h 2
is heritability, N is effective population size, t generation time, and the phenotypic standard deviation sZ0.14 (see §2). A conservative estimate is obtained assuming a relatively high long-term effective population size Nz104 and a relatively low heritability h2z0.3 for body size, with for mammals an approximately average generation time of 2 years; s2az0:29. Even this con-servative estimate is substantially higher than most of the present and most earlier (Lynch 1990) estimates.
In the absence of selection and mutation, the expected phenotypic divergence of a newborn species equals twice the additive genetic variance of the original species (Lynch & Hill 1986), or 2h2s2. Substituting h2z0.3 and sz0.14m, we obtain an approximate neutral expectation of s2cz0:11. This should be regarded as a minimum
expectation, since the heritability of body mass may well be higher than 0.3, and because genetic variance due to mutation may cause higher rates of neutral speciational evolution. This is a neutral expectation, and selection may drive speciational evolution at considerably higher rates, yet even small populations under weak selection may reach their new optimum phenotype in only a few thousand or even hundred generations (Lynch & Hill 1986).
4. DISCUSSION
A crucial assumption in the present analysis is that l and m as well as s2
a and s2c have been equal everywhere
on the phylogenetic tree. Analysis of sub-clades indicates that this assumption may be violated: some relatively closely related species show truly large differences in body size and sub-trees including such species lead to high estimates of rates of evolution with wide confidence intervals (table 1). There are two simple and non-exclusive explanations hereof: direc-tional selection on body size or frequent speciation (and thus frequent cladogenetic evolution) in a few lineages. It is difficult to distinguish between these two scenarios, but differences in rates of evolution—whether true differences in s2
a and s2c or caused by differences in l
and m—may lead to incorrect estimates, with for example s2a explaining more than 100% of observed
interspecific body size variation. Thus, the clearly aberrant analyses summarized in table 1 as well that of all mammals, including all aberrant lineages, should be regarded with caution. Clades without apparently unusual (observed) size differences in closely related species all suggest gradual evolution is responsible for 20–35% of interspecific variation.
The theory of punctuated equilibrium has often been discussed with respect to the mode of speciation, perhaps because it was originally presented as the geological consequence of Mayr’s theory of allopatric speciation (Eldredge & Gould 1972). We assumed that only newborn species undergo cladogenetic evolution, which has often been linked to the idea of peripatric species formation, where punctuational change takes place when new species arise from small peripherally isolated populations. If, on the other hand, punctuational change results from divergent selection in young sister species in (secondary) sympatry, a model in which both sister species undergo cladogenetic evolution might be more
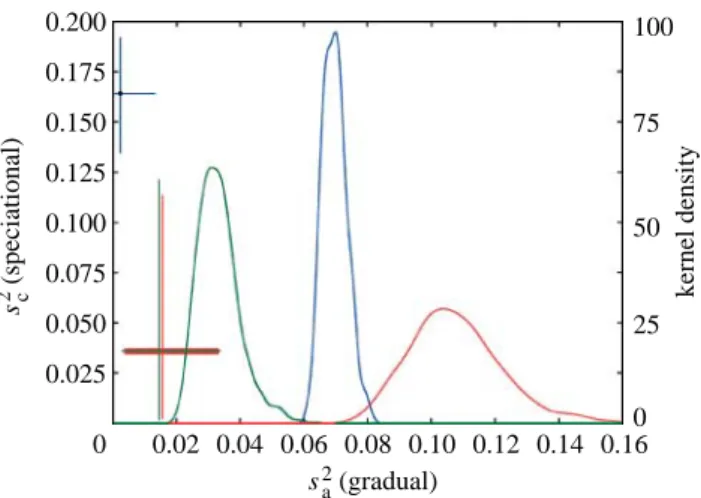
0 0.02 0.04 0.06 0.08 0.10 0.12 0.14 0.16 sa2 (gradual) 0.200 0.175 0.150 0.125 0.100 0.075 0.050 0.025 sc 2 (speciational) 100 75 50 25 0 kernel densit y
Figure 1. Estimates of s2aand s2cfor mammals (blue), primates
(green) and carnivores (red). Kernel densities show the distributions of MCMC samples of s2
a when s2cZ 0. Joint
estimates of s2aand s2c are indicated by dots, the error bars of
appropriate. However, as has repeatedly been pointed out (Gould 2002), several modes of speciation could as well result in rapid morphological change on a geological time scale, and the present results should not be interpreted as evidence for a particular mode of speciation.
The main significance of the present results concerns another controversy associated with punctuated equili-brium: to what extent macroevolution is the long-term consequence of microevolution and to what extent it represents fundamentally different processes. Above we have shown that even if s2cZ 0, estimated rates of gradual
evolution are much higher than expected under neutral mutation–drift equilibrium, which is in line with previous observations (Lynch 1990). Stabilizing selection could be, but certainly does not have to be (Hansen & Houle 2004), the explanation why observed rates of gradual evolution are an order of magnitude lower than genetic variation would allow for.
Similarly, we showed that both the speed and magnitude of speciational evolution, even though the latter is perhaps overestimated here, could be obtained with only weak selection. Thus, the observation that the rate of phenotypic (and genotypic (Pagel et al. 2006)) evolution is elevated during speciation is not at odds with Darwin’s idea of the resulting phenotypes being the products of natural selection, and provides insufficient evidence that micro- and macroevolution would be decoupled processes. Nevertheless, explaining perhaps one-third of interspecific variation, gradual evolution seems grossly overvalued.
This research was funded by a grant from the Swedish research council to F.B. We thank Olaf Bininda-Emonds for corrected versions of the mammal composite phylogeny, and the referees for constructive comments.
REFERENCES
Avise, J. 1977 Is evolution gradual or rectangular? Evidence from living fishes. Proc. Natl Acad. Sci. USA 74, 5083–5087. (doi:10.1073/pnas.74.11.5083)
Bininda-Emonds, O. et al. 2007 The delayed rise of present-day mammals. Nature 446, 507–512. (doi:10.1038/ nature05634)
Bokma, F. 2002 Detection of punctuated equilibrium from molecular phylogenies. J. Evol. Biol. 15, 1048–1056. (doi:10.1046/j.1420-9101.2002.00458.x)
Bokma, F. 2003 Testing for equal rates of cladogenesis in diverse taxa. Evolution 57, 2469–2474. (doi:10.1554/ 03-293)
Bokma, F. In press. Detection of ‘punctuated equilibirum’ by Bayesian estimation of speciation and extinction rates, ancestral character states, and rates of anagenetic and cladogenetic evolution on a molecular phylogeny. Evolution.
Douglas, M. & Avise, J. 1982 Speciation rates and morphological divergence in fishes, tests of gradual versus rectangular modes of evolutionary change. Evolution 36, 224–232. (doi:10.2307/2408040)
Eldredge, N. & Gould, S. 1972 Punctuated equilibrium: an alternative to phyletic gradualism. In Models in paleobiology (ed. T. Schopf ), pp. 82–115. San Francisco, CA: Free-man, Cooper & Co.
Gould, S. 2002 The structure of evolutionary theory. Cambridge, MA: Harvard University Press.
Gould, S. & Eldredge, N. 1993 Punctuated equilibrium comes of age. Nature 366, 223–227. (doi:10.1038/ 366223a0) T able 1. Summar y statistics of mammalian clades . (Age is the age of the first split in the clade, S its number of extant species, m its av erage body size, %p the percentage zero-length branches, %m the percentage of extant species for which body size was obser v ed and %g the percentage of interspecifi c body size v ariance explained by s 2 a.) age Sm %p %m %g lm s 2 a (s 2 cZ 0) s 2 a s 2 c 63.6 258 0.42 26 55 31 0.075 (0.065–0.089) 0.008 (0.000–0.027) 0.046 (0.021–0.089) 0.035 (0.009–0.078) 0.095 (0.004–0.318) 90.2 67 0.56 39 54 90 0.049 (0.035–0.073) 0.016 (0.000–0.049) 0.157 (0.039–0.380) 0.140 (0.002–0.568) 3.904 (0.118–15.78) 54.5 152 0.02 34 64 593 0.106 (0.088–0.129) 0.013 (0.000–0.042) 0.159 (0.023–0.479) 0.144 (0.011–0.487) 1.069 (0.035–3.934) 62.3 275 6.38 22 64 23 0.106 (0.091–0.124) 0.013 (0.000–0.039) 0.028 (0.015–0.061) 0.017 (0.005–0.033) 0.038 (0.001–0.120) 48.5 307 111.44 39 61 25 0.107 (0.086–0.134) 0.037 (0.004–0.075) 0.044 (0.022–0.085) 0.020 (0.002–0.053) 0.103 (0.007–0.368) 73.5 254 1.82 30 53 34 0.130 (0.102–0.164) 0.066 (0.021–0.114) 0.023 (0.010–0.038) 0.016 (0.004–0.032) 0.033 (0.001–0.103) 56.4 272 0.24 28 51 144 0.129 (0.111–0.153) 0.017 (0.000–0.049) 0.093 (0.026–0.187) 0.067 (0.019–0.157) 0.147 (0.009–0.469)
2198 T. M. Mattila & F. Bokma Punctuated evolution of mammal body size
Hansen, T. F. & Houle, D. 2004 Evolvability, stabilizing selection, and the problem of stasis. In The evolution-ary biology of complex phenotypes (eds M. Pigliucci & K. Preston), pp. 130–150. Oxford, UK: Oxford University Press.
Lande, R. 1976 Natural selection and random genetic drift in phenotypic evolution. Evolution 30, 314–334. (doi:10. 2307/2407703)
Lemen, C. & Freeman, P. 1989 Testing macroevolutionary hypotheses with cladistic analyses: evidence against rectangular evolution. Evolution 43, 1538–1554. (doi:10. 2307/2409467)
Losos, J., Jackman, T., Larson, A., DeQuieroz, K. & Rodriguez-Shettino, L. 1998 Contingency and determin-ism in replicated adaptive radiations of island lizards. Science 279, 2115–2118. (doi:10.1126/science.279.5359. 2115)
Lynch, M. 1990 The rate of morphological evolution in mammals from the standpoint of the neutral expectation. Am. Nat. 136, 727–741. (doi:10.1086/285128)
Lynch, M. & Hill, W. 1986 Phenotypic evolution by neutral mutation. Evolution 40, 915–935. (doi:10.2307/2408753) Mayr, E. 1982 Speciation and macroevolution. Evolution 36,
1119–1132. (doi:10.2307/2408147)
Mooers, A. & Schluter, D. 1998 Fitting macroevolutionary models to phylogenies: an example using vertebrate body sizes. Contrib. Zool. 68, 3–18.
Nee, S., May, R. M. & Harvey, P. H. 1994 The reconstructed evolutionary process. Phil. Trans. R. Soc. B 344, 305–311. (doi:10.1098/rstb.1994.0068)
Pagel, M. 1999 Inferring the historical patterns of biological evolution. Nature 401, 877–884. (doi:10.1038/44766) Pagel, M., Venditti, C. & Meade, A. 2006 Large
punctua-tional contribution of speciation to evolutionary diver-gence at the molecular level. Science 314, 119–121. (doi:10.1126/science.1129647)
Ricklefs, R. 1980 Phyletic gradualism vs. punctuated equilibirum, applicability of neotological data. Paleobiology 6, 271–275.
Silva, M. & Downing, J. 1995 CRC handbook of mammalian body masses. Boca Raton, FL: CRC Press.
Stanley, M. 1981 The new evolutionary timetable: fossils, genes, and the origin of species. New York, NY: Basic Books. Stanley, M. 1998 Macroevolution—pattern and process.
London, UK: Johns Hopkins University Press.
Stebbins, G. & Ayala, F. 1981 Is a new evolutionary synthesis necessary? Science 213, 967–971. (doi:10.1126/science. 213.4511.967)