HAL Id: hal-03094111
https://hal.archives-ouvertes.fr/hal-03094111
Submitted on 4 Jan 2021
HAL is a multi-disciplinary open access
archive for the deposit and dissemination of
sci-entific research documents, whether they are
pub-lished or not. The documents may come from
teaching and research institutions in France or
abroad, or from public or private research centers.
L’archive ouverte pluridisciplinaire HAL, est
destinée au dépôt et à la diffusion de documents
scientifiques de niveau recherche, publiés ou non,
émanant des établissements d’enseignement et de
recherche français ou étrangers, des laboratoires
publics ou privés.
cGAS/STING activation by dsDNA immune complexes
Giulia Piperno, Asma Naseem, Giulia Silvestrelli, Roberto Amadio, Nicoletta
Caronni, Karla Cervantes-Luevano, Nalan Liv, Judith Klumperman, Andrea
Colliva, Hashim Ali, et al.
To cite this version:
Giulia Piperno, Asma Naseem, Giulia Silvestrelli, Roberto Amadio, Nicoletta Caronni, et al..
Wiskott-Aldrich syndrome protein restricts cGAS/STING activation by dsDNA immune
com-plexes.
JCI Insight, American Society for Clinical Investigation, 2020, 5 (17), pp.e132857.
activation by dsDNA immune complexes
Giulia Maria Piperno, … , Richard N. Hanna, Federica Benvenuti
JCI Insight. 2020;5(17):e132857. https://doi.org/10.1172/jci.insight.132857.Graphical abstract
Research Article Cell biology Immunology
Find the latest version:
Authorship note: GMP and AN
contributed equally to this work.
Conflict of interest: The authors have
declared that no conflict of interest exists.
Copyright: © 2020, Piperno et
al. This is an open access article published under the terms of the Creative Commons Attribution 4.0 International License.
Submitted: August 21, 2019 Accepted: July 16, 2020 Published: September 3, 2020. Reference information: JCI Insight.
2020;5(17):e132857. https://doi.org/10.1172/jci. insight.132857.
Wiskott-Aldrich syndrome protein
restricts cGAS/STING activation by dsDNA
immune complexes
Giulia Maria Piperno,1 Asma Naseem,1 Giulia Silvestrelli,1 Roberto Amadio,1 Nicoletta Caronni,1
Karla Evelia Cervantes-Luevano,1 Nalan Liv,2 Judith Klumperman,2 Andrea Colliva,1
Hashim Ali,1 Francesca Graziano,3 Philippe Benaroch,3 Hans Haecker,4 Richard N. Hanna,5
and Federica Benvenuti1
1International Centre for Genetic Engineering and Biotechnology, Trieste, Italy. 2Section Cell Biology, Center for
Molecular Medicine, University Medical Center (UMC) Utrecht, Utrecht University, Utrecht, Netherlands. 3Institute Curie
Laboratoire Immunité et Cancer — INSERM U932 Transport Intracellulaire et Immunité, Paris, France. 4Department of
Infectious Diseases, St. Jude Children’s Research Hospital, Memphis, Tennessee, USA. 5Respiratory, Inflammation and
Autoimmunity, MedImmune LLC, Gaithersburg, Maryland, USA.
Introduction
The link between innate sensing of endogenous nucleic acid (NA) and autoimmune manifestations has become clear in several monogenic diseases and in common autoimmune diseases such as systemic lupus erythematosus (SLE). Pathogenic production of type I IFN was initially linked to binding of endoge-nous NA or antimicrobial peptides to endosomal Toll-like receptors (1–3). More recent evidence suggests that the cytosolic cGAS/STING sensing system plays a critical role in recognition of self-DNA in sys-temic autoimmunity (4–6). cGAS resides in the cytosol and binds to dsDNA, catalyzing the synthesis of a cyclic dinucleotide (cGAMP), which in turn binds the adaptor STING and recruits TBK1 to activate IRF3 and type I IFN transcription (7, 8). In Aicardi-Goutières syndrome (AGS) and AGS animal mod-els (4), dysregulated activation of the cGAS/STING pathway results from defects in the enzymes that degrade cytosolic DNA, such as the cytosolic exonuclease TREX1, leading to constitutive activation of IFN-stimulated genes (ISGs) and severe inflammation. Similarly, defects in lysosomal DNase II may lead to accumulation of undigested self-DNA in lysosomes, leakage to the cytosol, and severe autoin-flammation in a cGAS/STING-dependent fashion (9–13). Moreover, partner proteins binding to self-DNA or alteration in endosomal maturation may promote leakage of ingested material into the cytosol, inducing activation of cytosolic innate pathways (14–17).
Wiskott-Aldrich syndrome (WAS) is a rare immunodeficiency caused by mutations in WAS protein (WASp), a key hematopoietic-specific actin nucleation-promoting factor (NPF) of the WASp/WAVE fam-ily. Autoimmune manifestations in WAS include the presence of elevated levels of antibodies to dsDNA and dysregulated production of inflammatory cytokines (18–24). Autoantibody production is driven by
Dysregulated sensing of self–nucleic acid is a leading cause of autoimmunity in multifactorial and monogenic diseases. Mutations in Wiskott-Aldrich syndrome protein (WASp), a key regulator of cytoskeletal dynamics in immune cells, cause autoimmune manifestations and increased production of type I IFNs by innate cells. Here we show that immune complexes of self-DNA and autoantibodies (DNA-ICs) contribute to elevated IFN levels via activation of the cGAS/STING pathway of cytosolic sensing. Mechanistically, lack of endosomal F-actin nucleation by WASp caused a delay in endolysosomal maturation and prolonged the transit time of ingested DNA-ICs. Stalling in maturation-defective organelles facilitated leakage of DNA-ICs into the cytosol, promoting activation of the TBK1/STING pathway. Genetic deletion of STING and STING and cGAS chemical inhibitors abolished IFN production and rescued systemic activation of IFN-stimulated genes in vivo. These data unveil the contribution of cytosolic self–nucleic acid sensing in WAS and underscore the importance of WASp-mediated endosomal actin remodeling in preventing innate activation.
unrestrained activation of endosomal TLR9 and TLR7 (25, 26) in autoreactive B cells and by activatory signals from bystander cells such as platelets and neutrophils that contribute to exacerbate inflammation (23, 27). Recent evidence indicated that WASp myeloid cells contribute to autoimmunity by producing enhanced type I IFN and IL-1β (22–24). The major initial trigger and the sensing pathways involved in innate activation of myeloid cells remain unclear at present.
In this study we show that lack of WASp expression in DCs renders cells responsive to small doses of self-DNA in immune complex with autoantibodies (DNA-ICs), inducing activation of type I IFN genes. We further dissected the underlying cell biological mechanisms by showing that WASp controls endosomal actin and endolysosomal maturation, regulating disposal of ingested interferogenic material. Importantly, we propose that self-DNA accumulated within maturation-defective endosomes escapes into the cytosol, triggering the cGAS/STING pathway.
Results
WASp-deficient cells activate type I IFN genes upon stimulation with DNA-ICs. To document the presence of
reac-tivity to self-DNA in our cohort of WASp-null animals we collected sera at 3 different time points to analyze the presence of antibodies to dsDNA. The majority of animals developed autoantibodies after 4 months that further increased after 6 months and reached a plateau at 8 months (Figure 1A). In parallel, we observed active transcription of 3 ISGs (Mx1, Oas1a, and Isg15) in resting DCs and splenocytes of WASp-null animals, indicating ongoing responses to circulating interferogenic triggers (Figure 1, B and C). To directly link these observations, we prepared DNA immune complexes (ICs) of controlled stoichiometry mimicking that of endogenous complexes (28) to assess responses of WASp-null myeloid cells. DCs from WASp-KO (WKO) animals activated Ifnb gene transcription at the lowest concentration of DNA-ICs, whereas WT cells failed to respond to the highest dose of ICs tested (Figure 1D). Transcription of Isg15 was also significantly enhanced in WKO cells at the lowest dose of immune-stimulatory DNA-ICs (Figure 1E), indicating activation of the downstream signaling cascade. Levels of bioactive protein confirmed enhanced production by WKO cells (Figure 1F). To further evaluate reactivity to synthetic DNA, we treated cells with CpG-B, which induces type I IFN through endosomal TLR9. Ifnb gene transcription and protein secretion were 3- to 4-fold higher in WKO DCs, at 2 different time points and doses (Supplemental Figure 1A; supplemental material avail-able online with this article; https://doi.org/10.1172/jci.insight.132857DS1). Production of inflammatory cytokines (TNF-α, IL-12p40, and IL-6) was also enhanced in WKO DCs and in macrophages differenti-ated from WKO bone marrow precursors (BMDMs) (Supplemental Figure 1, B and C). To discriminate whether enhanced responsiveness to DNA-ICs is a cell-intrinsic property of WASp-null cells, we generat-ed a WASp-deficient DC line (WKOCAS) by genome editing (29) (Figure 1G and Supplemental Figure 2A). Responses of WKOCAS DCs were significantly greater than those of a control non-edited DC line (WTCAS), indicating that IFN-I levels are controlled by WASp in a cell-autonomous fashion (Figure 1H).
Immune complexes stall in early compartments in WASp-KO cells. To explore the mechanism of enhanced
reactivity of WASp-null cells, we tracked intracellular trafficking of DNA-ICs upon internalization. Seven minutes after pulse, most ICs were associated with early endosomes in both WT and WKO cells. At 15 and 40 minutes, we observed a gradual decrease in the overlap between ICs and EEA1 in WT cells, indicating exit from early compartments. The kinetics was delayed in WKO DCs, as ICs still overlapped with EEA1 at 15 and 40 minutes after pulse (Figure 2, A and B). The mean area of IC-positive structures was signifi-cantly larger in WKO cells after 15 minutes of pulse and increased even more after 40 minutes, indicating accumulation of cargo in early endocytic vesicles (Figure 2C). After 40 minutes, intracellular ICs almost completely overlapped with LAMP1 in WT cells. In contrast, WKO cells contained several large clusters of ICs that had not yet colocalized with LAMP1 (Figure 2D). To further examine delivery of ICs to lysosomes, cells were preloaded with WGA–Alexa Fluor 647 (WGA-AF647), which labels lysosomes (30). WGA-loaded DCs were exposed to ICs for 40 minutes, and their localization was analyzed by high-resolution microscopy. Most ICs clustered in the perinuclear area and overlapped with WGA in WT cells. In contrast, WKO cells contained several small and peripheral IC vesicles segregated from WGA organelles plus a few large IC struc-tures only partially overlapping with WGA, which resulted in a significantly lower overlap coefficient (Figure 2E). Delayed intracellular degradation of ICs was confirmed by blotting of WT and WKO lysates at different time points after pulsing (Supplemental Figure 3A). Together these data show that transit of ingested cargo across endosomes of WASp-null cells is delayed, increasing the instantaneous concentration of immunogenic cargo in signaling organelles.
WASp recruited on endosomes drives F-actin polymerization and controls endolysosomal architecture and function.
NPFs of the WASp family control endosomal dynamics by directly promoting endosomal F-actin nucle-ation in nonhematopoietic cells (31). To understand whether WASp may act as a regulator of endosomal F-actin in DCs, we first analyzed its intracellular distribution with respect to endosomes using high-resolu-tion microscopy. A large frachigh-resolu-tion of WASp was localized around endosomes, forming a dense coat around endocytic vesicles (Figure 3, A and B). To verify whether WASp accumulation affected F-actin polymer-ization on endosomes, we measured its density in the peri-endosomal area. Interestingly, the density of Figure 1. Enhanced type I IFN responses to endogenous DNA in Wasp-null DCs. (A) The content of anti-dsDNA in sera of WT and WKO animals was
evaluated by ELISA at 4, 6, and 8 months of age. n = 8, 7, and 11 mice/group, respectively; mean ± SEM. ****P ≤ 0.0001, 2-way ANOVA. (B) Transcription of
IFN-stimulated genes (Mx1, Oas1a, Isg15) in resting WT and WKO DCs. n = 3 for Mx1 and Oas1a and n = 5 for Isg15; mean ± SEM. **P ≤ 0.01, 2-way ANOVA. (C) Transcription of Isg15 in total resting splenocytes; n = 3 mice per group; mean ± SEM. **P ≤ 0.01, unpaired t test. (D and E) DCs were stimulated with
the indicated doses of DNA-ICs (IC). Transcription levels of Ifnb (D; n = 7) and Isg15 (E; n = 5) were evaluated by RT-PCR; mean ± SEM. *P ≤ 0.05, **P ≤ 0.01,
2-way ANOVA. (F) As in D, type IFN protein was evaluated by B16-Blue reporter assay; n = 3. n.d., not detected. (G) Histograms show WASp expression in
genome-edited WTCAS and WASpCAS Hoxb8–derived DCs. (H) Ifnb gene transcription after CpG-B stimulation was evaluated by RT-PCR; mean ± SEM of 3
endosomal F-actin was significantly diminished around WKO endosomes (Figure 3, C and D), indicating a direct role for WASp in nucleating endosomal actin. The decrease in endosomal F-actin correlated with an altered morphology, leading to enlarged endosomal area, irregular shape, and peripheral distribution in WKO cells (Figure 3E and Supplemental Figure 4A). Ultrastructural analysis of DCs that had taken up BSA-Au5 confirmed that area, perimeter, and diameter were significantly greater in WKO endolysosomes (Supplemental Figure 4B). Endosomal progression entails acquisition of specific membrane proteins that mark progressive maturation steps. Interestingly, analysis of specific markers of early (EEA1) and late Figure 2. DNA-ICs accumulate in endosomes of WASp-null cells. (A) WT or WKO DCs were pulsed with DNA-ICs (90 μg/mL) for 7 minutes and chased for
different durations. Cells were labeled with antibodies to the Fc portion of ICs and to early endosomes (EEA1). Images show representative confocal planes and the corresponding colocalization mask for early endosomes (EEs) and ICs. (B) Bars shows relative Mandel overlap coefficient (MOC) for ICs and EEs at
the different time points. Mean ± SEM of 30 cells/condition from 3 independent experiments. ***P ≤ 0.001, **** P ≤ 0.0001, 2-way ANOVA. (C) The area of
intracellular IC structures was measured 15 minutes or 40 minutes after pulse. Mean ± SEM. *P ≤ 0.05, ***P ≤ 0.001, unpaired t test, on 28 cells/condition from 2 independent experiments. (D) Images show representative central confocal planes of ICs and LAMP1 distribution after 40 minutes of chase. Insets
are magnifications of the regions indicated by dotted lines. Graph shows MOC of ICs and Lamp1. Mean ± SEM of 28 cells/condition from 2 independent experiments. ****P ≤ 0.0001, unpaired t test. (E) DC were preloaded with labeled WGA (WGA-AF647) to mark lysosomes and incubated with DNA-ICs (90
μg/mL). Representative Airyscan micrographs and the corresponding insets show the relative distribution of ICs with respect to the WGA signal. The graph shows MOC of ICs and WGA (mean ± SEM of 28 WT and 23 WKO cells from 2 independent experiments). ***P ≤ 0.001, unpaired t test . Scale bars: 5 μm.
endosomes (Rab7) showed defective segregation in WASp-null cells, suggesting loss of organelle identity (Figure 3F). By dynamic imaging of endocytic vesicles, we observed accumulation of large and poorly motile vesicles in WKO cells, confirming altered mobility and progression of endocytosed cargo (Supple-mental Videos 1 and 2 and Supple(Supple-mental Figure 4C).
Expression of the other members of the WASp/WAVE family was not modified in WKO DCs, ruling out that endosomal disorganization may depend on unbalanced expression of other NPFs (Supplemental Figure 5A). To confirm that endosome size is controlled by WASp-mediated actin dynamics, we treated cells with inhibitors of actin polymerization (latrunculin A [LAT-A]) or with the specific inhibitor of the Arp2/3 actin-nucleating factor (CK666), the downstream WASp effector. Both inhibitors induced a signif-icant increase in the size of early endosomes (mean ± SD area of vehicle-treated cells, 0.53 ± 0.15 μm2; CK666-treated cells, 0.72 ± 0.08 SD μm2; LAT-A–treated cells, 1.05 ± 0.2 SD μm2) (Supplemental Figure 5B), suggesting that endosomal architecture is perturbed by decreased actin polymerization by WASp rather than other WASp-mediated pathways. We further investigated the impact of WASp-mediated Arp2/3 activation in cells treated with the CK666 inhibitor. The drug induced a delay in DNA-IC progression (Supplemental Figure 5, C and D) and rendered cells responsive to DNA-ICs (Supplemental Figure 5E), confirming that DNA-IC trafficking and innate responses are regulated by WASp via its actin-modulatory properties.
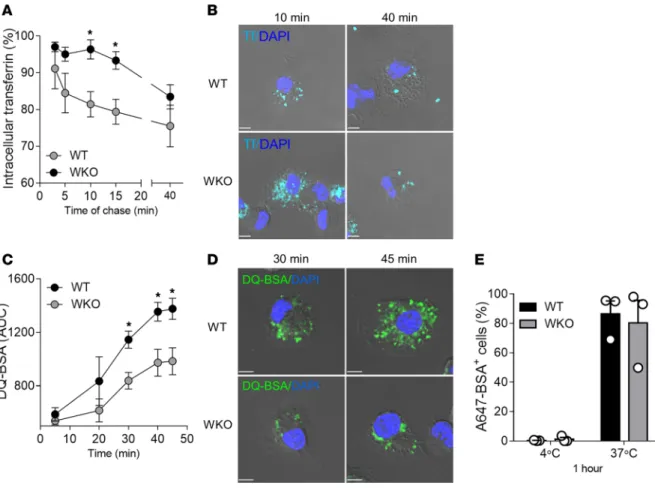
Morphological changes in WASp-null cells correlated as well with altered endosomal function. Measure-ment of recycling of labeled transferrin (Tf) indicated that recycling started after 5–10 minutes and reaches a plateau after 40 minutes in WT cells (mean ± SD, 24.5% ± 9.8% of recycled Tf). In contrast, no recycling was observed for the first 10–15 minutes in WKO DCs and only 16.5% ± 5.6% of Tf had recycled by the end of the assay, indicating a significant delay in the process (Figure 4A). Microscopy images captured at 2 time points confirmed more abundant intracellular Tf vesicles in WKO cells at early time points (10 minutes of chase) and a normalization at plateau (40 minutes of chase) (Figure 4B). Second, we assessed maturation into lysosomes by loading cells with dye-quenched BSA (DQ-BSA), a self-quenched probe that emits bright fluo-rescence only upon proteolytic cleavage. AF647-BSA, a degradation-insensitive probe, was used as a control for uptake. Fluorescence intensities (gated on cells positive for AF647-BSA) increased steadily from 20 to 45 minutes at 37°C, with a similar trend in both genotypes, but intensities were significantly higher in WT cells as compared with WKO cells at most time points tested (Figure 4C). Higher intracellular fluorescence in WT cells was confirmed by confocal microscopy (Figure 4D). Of note, uptake of Alexa Fluor 647 BSA was sim-ilar in WT and WKO cells (Figure 4E), indicating that WASp deficiency does not affect internalization but only subsequent steps of delivery toward degradative compartments.
We conclude that a large fraction of intracellular WASp localizes to endosomes, where it contributes to regulation of the pool of endosomal F-actin and endosomal architecture, which is critical for organelle shape and identity and for trafficking of endocytosed cargo for recycling and degradation.
Aberrant endosomes promote leakage of internalized cargo in the cytosol. Stalling of ICs within WKO
endo-somes increases the concentration of ligand available for triggering of endosomal receptors, in line with our previously published data showing enhanced TLR9 activation (22). We speculated that in addition to altering endosomal signaling, defective endosomal maturation may also compromise membrane integrity and increase permeability to the cytosol (32). To test this hypothesis, we pulsed WT and WKO cells with a small-size labeled dextran (10 kDa). Dextran confined in vesicular structures was discriminated from dex-tran that had escaped into the cytosol based on decreased intensity, smaller spot size, and irregular shape using a semiautomated script (described in Methods). Indeed, the fraction of dextran diffused in the cytosol was significantly higher in WKO cells as compared with WT cells, indicating increased permeability of the endocytic compartment (Figure 5A). We next pulsed cells with prelabeled ICs and we analyzed their intra-cellular distribution with respect to endocytic membranes (marked with a short pulse of WGA staining). Ninety minutes after the pulse, the remaining IC signal overlapped entirely with endolysosomes in WT cells. In contrast, the IC signal in WKO cells was diffused in an area devoid of endolysosomal membranes, indicating cytosolic localization (Figure 5B).
DNA-ICs induce type I IFN production via the STING pathway. To explore whether escape from endosomes
can activate cytosolic sensors, we analyzed proximal signaling upon DNA-IC stimulation. Beside enhanced activation of NF-κB, WKO cells showed clear activation of TBK1, the kinase recruited by STING to induce type I IFN (Figure 5C) (33). WASp-null cells responded normally to direct STING stimulation (DMXAA, Supplemental Figure 6A), indicating an intrinsically normal pathway. To examine the actual contribution of STING to DNA-IC–induced IFN-I production, we first used the specific inhibitors C-176 and C-178
(34). Titration experiments identified the minimal working concentration of DMXAA (0.25 μM) used in subsequent experiments (Supplemental Figure 6B). C-178 specifically blocked phosphorylation of TBK1 upon DMXAA, confirming its specificity (Supplemental Figure 6C). As expected, C-178 inhibited respons-es induced by bone fide activators of the STING pathway, whereas it had no effect on LPS stimulation (Fig-ure 6A). Importantly, C-178 completely inhibited type I IFN production and transcription of ISGs induced by DNA-ICs in WKO cells (Figure 6, A and B). To reinforce this finding and exclude possible nonspecific effects, we next deleted STING expression by CRISPR/Cas9 genome editing in WKO immortalized pre-cursors (Supplemental Figure 6, D and E). Double-KO cells were differentiated into DCs (WKO-STING KO) from genome-edited precursors and stimulated with control agonists and DNA-ICs. Genome-edited cells showed the expected specific functional deactivation of the STING pathway and intact responses to unrelated pathways (Figure 6C). STING deletion abrogated Ifnb gene transcription upon DNA-IC stimula-tion (Figure 6C), confirming that DNA-IC–induced responses are driven by STING-dependent signaling. To further explore the pathway of DNA sensing in WKO cells, we interfered with cGAS activity using the specific RU.521 inhibitor. Stimulation of inhibitor-treated cells with dsDNA and STING agonist confirmed the efficacy and specificity of the treatment (Figure 6D). cGAS inhibition significantly reduced Ifnb and
Isg15 transcription (Figure 6D and Supplemental Figure 6F) induced by DNA-ICs, suggesting the
involve-ment of cGAS in innate responses to self-DNA in WKO cells.
Finally, we explored the impact of inhibiting the STING pathway on constitutive activation of the IFN signature in vivo. Animals were repeatedly injected with C-176, a soluble variant of C-178 suitable for in vivo delivery (34). Organs were harvested after 12 days of treatment to assess the levels of Isg15 in the spleen. Treatment with C-176 induced a mild but significant reduction in constitutive gene transcription in treated animals as compared with vehicle-treated WKO animals (Figure 6E).
We conclude that activation of the cGAS/STING pathway of innate sensing contributes to excessive production of type IFN-I in WASp-deficient cells and to chronic activation of the type I IFN pathway in vivo.
Discussion
The mechanisms leading to erroneous recognition of self-DNA and loss of negative regulation of type I IFNs in autoimmune diseases are still not entirely understood and often disease specific. Here we reveal that a key contribution to pathogenic activation of type I IFN in WAS is the improper degradation and cytosolic leakage of ingested self-DNA. Altered endosomal dynamics in WASp-null cells affect the time of persistence of ingested cargo, lowering the threshold for activation of endosomal receptor. Second, decreased endosomal F-actin undermines membrane integrity and facilitates escape of internalized NA into the cytosol, leading to ectopic activation of the cGAS/STING pathway. These findings contribute to understanding unbalanced immune responses in WAS and suggest the potential benefit that inhibitors of the cGAS/STING pathway may have in controlling chronic innate activation.
In WAS, autoreactive B cells produce high levels of anti-dsDNA because of cell-intrinsic hyperreactivity of the B cell receptor and TLRs (18, 25, 35). These autoantibodies form complexes with dsDNA and repre-sent a potential noxious trigger that boosts autoinflammation and sustains type I IFN levels. The data prerepre-sent- present-ed here show that a tiny amount of DNA-ICs, ignorpresent-ed by WASp-proficient cells, induce activation of type I IFN and ISGs in WASp-deficient cells in a cGAS/STING-dependent manner. Notably, administration of STING inhibitors in vivo rescued chronic transcription of Isg15 in the spleen of WASp-null animals, indicat-Figure 3. WASp controls endosomal F-actin nucleation and endosome architecture. (A) Representative high-resolution image of WASp distribution
around endosomes (scale bar: 5 μm). Insets show magnification of the area indicated by the squares (scale bars: 2.5 μm). Right: Plot profiles of relative fluorescence intensity in the green and red channels along the dashed arrows indicated in the inset. (B) WASp distribution and density around endosomes
were defined by computing a peri-endosomal radial line of 0.8 μm. Bars show the relative fraction of total WASp (left) and the density of WASp signal (right) in cytosol and around endosomes. Data were calculated automatically on 30 cells from 3 independent experiments. Mean ± SEM. ***P ≤ 0.001, ****P ≤ 0.0001, unpaired t test. (C) WT and WKO DCs were labeled with antibodies to EEA1 and F-actin. Single confocal planes for each genotype are
shown; scale bar: 5 μm. Insets are zoom on individual endosomes corresponding to the indicated squares; scale bars: 1.5 μm. Right: Plot profiles of relative fluorescence intensity in the green and red channels along the indicated dashed arrows. (D) As above, the scheme shows the pipeline to quantify F-actin
density. The density of peri-endosomal F-actin in WT and WKO DCs, calculated on all endosomes of 30 cells/condition from 3 independent experiments. Graphs show mean ± SEM. *P ≤ 0.05, unpaired t test. (E) Images are single confocal planes of WT and WKO DCs labeled with antibodies to EEA1. Insets are
magnification of the area indicated by the squares (scale bars: 5 and 2 μm). Endosomal area was calculated on at least 30 cells/condition (mean ± SEM). ****P ≤ 0.0001, unpaired t test, from 2 independent experiment. (F) Single confocal planes showing EEA1 and Rab7 distribution and the corresponding
colocalization mask (white). Insets show magnification of the area indicated by the squares. The overlap (MOC) between EEA1 and Rab7 is plotted. Mean ± SEM of at least 30 cells/condition from 2 independent experiments. ****P ≤ 0.0001, unpaired t test. Scale bars: 5 μm.
ing that chronic systemic activation by circulating endogenous inducers depends on cytosolic sensing and can be modulated by inhibiting this pathway. Thus, as has been shown in monogenic disorders and in complex systemic diseases (4, 5, 36–38), cytoskeletal defects can impact the threshold of self-NA sensing.
To understand the molecular basis of increased sensitivity, we have extensively investigated endosomal architecture and function and we have followed the intracellular journey of DNA-ICs in WASp-null cells. WASp recruitment on endosomes coincident with actin enrichment suggest that hematopoietic WASp may work in a manner similar to the Arp2/3 activator WASH in nonhematopoietic cells, promoting endosomal progression and maturation (31, 39). In addition, WASp is part of a complex that bridges the actin and microtubule cytoskeleton via the adaptor CIP4 (40), affecting centripetal transport of vesicles (41), which is a further possible explanation for the delayed endosomal maturation found in WASp-null cells . An important accompanying feature of aberrant endosome dynamics that emerged in this study is increased endosomal membrane permeability. Indeed, endosomal leakage of accumulated ingested DNA or escape by active desta-bilization has been recently proposed to underlie excessive IFN responses in various conditions (10, 14, 42). Endosomal escape of engulfed DNA is facilitated by partner proteins such as HMGB1 and LL-37 that are secreted during cellular damage and are present in neutrophil extracellular traps (NETs) (15, 43). Although we have not evaluated the presence of HMGB1 in WAS, we speculate that HMGB1 levels may be elevated given the presence of NETs (23) and increased ROS activity (44), providing additional help to allow exit of DNA-ICs from stalling endosomes. Moreover, WASp-null cells show impaired autophagic flux following TLR4 and bacterial stimulation, a further factor known to predispose to membrane permeability (24, 45). Figure 4. WASp controls endosomal recycling and lysosomal degradation. (A and B) WT and WKO DCs were loaded with AF647-Tf at 37°C for 1 hour, acid
washed (t = 0), and incubated at 37°C for the indicated times. (A) Recycling is expressed as the percentage of intracellular Tf (A) remaining at the different
time points with respect to t = 0. Mean ± SEM of 3 independent experiments. *P ≤ 0.05, unpaired t test. (B) Representative confocal plane of WT and
WKO DCs at 2 different point of chase. (C–E) WT and WKO DCs were pulsed with FITC/DQ-BSA and AF647-BSA (as control for uptake) for 10 minutes at
37°C. Samples were washed and continuously acquired for 45 minutes on a flow cytometer. (C) Data represent AUC, normalized on AF647-BSA uptake
(mean ± SEM of 3 independent experiments). *P ≤ 0.05, unpaired t test. (D) Images are a representative confocal plane of WT and WKO DCs at 2 points
of chase after DQ-BSA pulsing. (E) Bars indicate the fraction of DCs positive for AF647-BSA after 1 hour at 4°C or 37°C, as a control for uptake between the
Our findings also contribute to explaining previous findings in WASp-deficient DCs. Delayed matura-tion of endosomes and escape to the cytosol are consistent with enhanced cross-presentamatura-tion of ingested antigens in WASp-null cells (44), as this would favor slower degradation of class I epitopes and access to the endoplasmic reticulum for MHC class I peptide loading. On the other hand, constitutive activation of type I IFN and ISGs by chronic endogenous triggers could establish a state of exhaustion, as we observed in aged mice (22), and explain reduced responses to viral infections (46).
In conclusion, this study identifies WASp-mediated regulation of endosomal maturation and intracel-lular trafficking as a central mechanism for restraining activation of innate sensors, and brings forward the contribution of the STING pathway to excessive production of type I IFN inflammation in WAS.
Methods
Mice. WASp–/– mice on a C57BL/6 (CD45.2) genetic background were a gift from S. Snapper
(Mas-Figure 5. Defective endolysosomes leak to the cytosol, causing TBK1 activation. (A) Representative confocal images of DCs loaded with AF488-dextran
(10 kDa) for 20 minutes (scale bar: 10 μm). Insets show magnification of the area indicated by the squares. The relative distribution of dextran signal within vesicular structures or in the cytosol was quantified in 45 individual cells from 3 independent experiments and expressed as diffuse/punctate ratio (mean ± SEM). ***P ≤ 0.001, unpaired t test. (B) DCs were pulsed with prelabeled DNA-ICs for 20 minutes, chased for 90 minutes, and counterstained with
WGA-AF647 to identify the endocytic compartment. Images show representative Airyscan confocal sections of WGA and DNA-IC distribution. The fraction of cells showing DNA-IC signal within endosomes or outside endosomes (cytosolic) was calculated on 20 cells/condition from 2 independent experiments. (C) Lysates of WT and WKO DCs stimulated with DNA-ICs (IC stim; 90 μg/mL) were probed for p-p65, total p65 (Tot p65), p-TBK1, total TBK1, and WASp.
sachusetts General Hospital, Boston, Massachusetts, USA). Mice were bred and maintained in sterile isolators. Experiments were performed using homozygous WASp–/– females or males as WKO mice and WT littermates as controls.
Primary cell culture. Mouse BM-derived DCs (BMDCs) were generated in vitro from BM of C57BL/6
WT or WKO mice using GM-CSF. DCs were cultured at a concentration of 1.5 × 10⁶ cells/mL in Nunc nontreated 6 well-plates (Thermo Fisher Scientific) for 7 days using IMDM supplemented with 10% FBS, 50 μM 2-mercaptoethanol (Gibco), 1% gentamicin, complemented with 30% supernatant of GM-CSF produced from J558 cell line. Cells were used for experiments between days 6 and 8. CD11c+ DCs were enriched from total spleen cells using the CD11c microbeads, mouse (Miltenyi Biotec).
Mouse BM-derived macrophages (BMDMs) were generated in vitro from BM of C57BL/6 WT or WKO mice using M-CSF. BM-derived cells were cultured at a concentration of 1 × 10⁶ cells/mL in non-treated 10 cm Petri dishes (Thermo Fisher Scientific) for 7 days using L929 conditioned medium: RPMI 1640 supplemented with M-CSF (30% L929 cell supernatant), 10% FBS, plus 1% penicillin/strepto-Figure 6. The cGAS/STING pathway controls responses to DNA-ICs in WASp-null cells. (A) WKO DCs were treated with C-178 (0.25 μM) or vehicle (DMSO)
and stimulated with DMXAA (5 μg/mL), cyclic di-GMP (cGAMP, 3 μg/mL), LPS (1 μg/mL), and DNA-ICs (IC, 90 μg/mL). Type I IFN protein (for DMXAA, cGAMP, and LPS) or transcripts (for DNA-ICs) were evaluated by B16-Blue reporter assay or RT-PCR, respectively. Data are expressed as ratio between inhibitor-treated and DMSO-treated cells. Significance was determined by. Mean ± SEM of 3–4 biological replicates. ****P ≤ 0.0001, ***P ≤ 0.001, 2-way ANOVA for protein and by unpaired t test for transcript. (B) Transcription level of Isg15 in resting or stimulated (DNA-IC, 90 μg/mL) WKO DCs that had
been pretreated with C-178 (0.25 μM). Mean ± SEM of 4 biological replicates. *P ≤ 0.5, **P ≤ 0.001, 2-way ANOVA. (C) WKO and WKO STING-KO DCs were stimulated with DMXAA (5 μg/mL), LPS (1 μg/mL), and DNA-ICs (90 μg/mL). Type I IFN protein (DMXAA and LPS) or transcripts (DNA-ICs) are expressed as ratio between values in WKO STING-KO and values in WKO. Significance was determined by. Mean ± SEM of 3–6 biological replicates. *P ≤ 0.5, ***P ≤ 0.001, ****P ≤ 0.0001 2-way ANOVA for protein and unpaired t test for transcript. (D) WKO DCs were treated with RU.521 (50 μM) or vehicle (DMSO) and
stimulated with dsDNA (2.5 μg), DMXAA (5 μg/mL), and DNA-ICs (90 μg/mL). Values were measured and expressed as in A. (E) WKO mice were treated for 11 consecutive days with 500 mM C-176 or DMSO. Total splenocytes were harvested after 12 days, and the levels of Isg15 mRNA were evaluated by RT-PCR. Data are from n = 5 C-176 and n = 4 DMSO animals. Significance was evaluated by t test
mycin, 1 mM sodium pyruvate. Cells were used for experiments between days 6 and 8.
L929 cells (M-CSF–producing cells) were grown for 1 week in RPMI 1640–supplemented 10% FBS plus 100 μg/mL penicillin, 100 μg/mL streptomycin, 2 mM l
-gluta-mine, 10 mM HEPES, 1 mM sodium pyruvate, and 50 μM β-mercaptoethanol. Cell-free supernatant was then harvested from the confluent monolayer, 0.22 μm filtered, and kept at –20°C until use.
Virus production and cell infection. The expression plasmid and relative packaging with envelope were
cotransfected into HEK293T cells using Lipofectamine 3000 (Invitrogen L3000-015). Twenty-four hours after transfection, the supernatant containing virus was collected, filtered, and added to cells for infection. A total of 3 × 10⁵ cells to be infected were dispensed in 1 mL per well in a 12-well plate and infected with virus by spinoculation at 1500 g for 60 minutes in the presence of Lipofectin (0.1%, Invitrogen). After spinoculation, cells were diluted by addition of 1.5 mL and incubated overnight. One day after infection 1.5 mL media was removed and replaced with 1.5 mL fresh cell culture medium supplemented with the relative selected antibiotic for resistance.
Retroviral and lentiviral plasmids. Plasmids were as follows: SEWW (EGFP-WASp) (47), Lenti CrisprV1
(Addgene 48535), Lenti CrisprV2 (Addgene 52961), MSCV herad3HAHOXB8 (29), and MSCV2.2 TLR9-HA (IRES-GFP) (48).
sgRNA design. sgRNAs for WASp and STING genome editing were designed using Genetic
Pertur-bation Platform (GPP) sgRNA Designer (https://portals.broadinstitute.org/gpp/public/analysis-tools/ sgrna-design) to minimize potential off-target effects. For WASp genome editing, 3 different WASP sgRNA sequences were cloned in a Lenti CrisprV1 plasmid previously digested with BsmBI restriction enzyme. For STING, only 1 previously published sgRNA (49) was cloned in Lenti CrisprV2 plasmid.
All sequences are reported as 5′→3′: WASp1 for CACCGGAATGTTCTGCTGAACGGC, rev AAACGCCGTTCAGCAGAACATTCc; WASp2 for CACCGGATGAAGTAGGACTTCTGA, rev AAACTCAGAAGTCCTACTTCATCC; WASp3 for CACCGAGCAAAAGTGTGGAAGAACG, rev AAACCGTTCTTCCACACTTTTGCTc; STING1 for, CACCGTCCAAGTTCGTGCGAGGCT, rev AAACAGCCTCGCACGAACTTGGAC.
Generation of Hoxb8 progenitors cell lines and differentiation in DCs. The method was previously described
(29). Briefly, BM cells were collected from femurs of 4- to 8-week-old mice and separated on a Ficoll gradient. Cells were resuspended in RPMI containing 15% FBS and supplemented with 30% GM-CSF–containing supernatant plus 15% of Flt3L-containing supernatant. After 2 days of cell culture, cells were collected and resuspended in progenitor outgrowth medium (POM): RPMI supplemented with 10% FBS, 1% gentamicin, and 1 μM β-estradiol (MilliporeSigma, E-2758) and infected with MSCV herad-3HAHOXB8 retroviral parti-cles. For 1 month cells were dispensed every 3–4 days in fresh medium and transferred into new wells. After this period, cells were expanded in Hoxb8 Outgrowth Medium (POM supplemented with 15% Flt3L super-natant). For subsequent differentiation experiments, cells were washed twice with warm PBS containing FBS and resuspended in a concentration of 0.5 × 10⁵ cells/mL in IMDM containing 30% GM-CSF.
Cell stimulation. DNA-ICs were formed in vitro by combining a monoclonal anti-DNA antibody (clone
E11) with pLIT-CG50.1.plasmid (28), provided by MedImmune. Briefly, 100 μg of the E11 antibody was mixed to 10 μg of DNA plasmid and incubated at 37°C for 30 minutes. The IC preparation was diluted in medium to stimulate cells with the indicated concentrations. Cells were incubated for 3 hours for RNA extraction and RT-PCR or for 16 hours for protein analysis.
dsDNA sequences were purchased from Integrated DNA Technologies and were annealed at 200 μM strand concentration in NEB buffer 2 (B7002S), with incubation at 95°C for 100 seconds, followed by slow cooling at 25°C (50): 5′-TACAGATCTACTAGTGATCTATGACTGATCTGTACATGATCTACA; 5′-TGTAGATCATGTACAGATCAGTCATAGATCACTAGTAGATCTGTA.
CpGB (Invivogen, tlrl-1668), DMXAA (Invivogen, tlrl dmx), LPS (Invivogen, tlrl-pb5lps), cGAMP (Invivogen, tlrl-nacga23) were all used at the indicated concentrations (3 hours for RT-PCR, 16 hours for protein analysis). For dsDNA and cGAMP, used concentration were mixed with Lipofectamine 3000 (Invi-trogen, L3000-015) following the suggested protocol.
Flow cytometry. For cell staining, FcR binding sites were blocked by using αCD16/CD32 (BioLegend,
93). Samples were then stained with specific antibodies in PBS plus 1% BSA and fixed with PBS plus 1% PFA. For intracellular staining, cells were fixed and permeabilized using Cytofix/Cytoperm solution (BD Biosciences) following manufacturer’s instructions, and then stained with specific antibodies. Flow data were acquired with a FACSCelesta or FACSAria II (BD Biosciences) and analyzed with Diva software (BD
Biosciences) or FlowJo software (Tree Star Inc.). Antibodies used were WASp (Santa Cruz Biotechnology Inc., B-9) LIVE/DEAD Fixable Dead Cell Stain (Life Technologies, L34965).
Recycling assay (Tf). Cells were starved 15 minutes in media without FBS at 37°C; then cells were pulsed
for 1 hour at 37°C with Tf 647 (50 μg/mL; Molecular Probes) to allow cells to reach equilibrium. Cells were moved to 4°C, washed twice in cold PBS, and treated for 2 minutes with cold acid buffer (glycine 50 mM, NaCl 150 mM pH 3), and the reaction was stopped by addition of 1 mL cold neutralization buffer (PBS, BSA 0.05%). Cells were then incubated at 37°C with nonlabeled Tf (50 μg/mL; Molecular Probes) for the indicated times and analyzed by FACS. Time 0 represents collection of cells after neutralization.
Degradation assay (DQ-BSA). Cells were pulsed for 10 minutes at 37°C with medium containing Alexa
Flour 647–BSA (5 μg/mL; Molecular Probes). After Alexa Flour 647–BSA pulse, cells were washed twice with cold PBS in order to remove nonspecific binding BSA from the cell surface. Cells were then acquired on a FACS Aria II in real time at 37°C, and after the first minute cells were pulsed with DQ Green BSA (5 μg/mL; Thermo Fisher Scientific), then acquired for 45 minutes at 37°C. DQ-BSA lysosomal degradation was measured by flow cytometry as AUC, normalized on AF647-BSA+ cells.
Western blot analysis. Cells were washed and lysed with buffer containing 50 mM Tris-HCl (pH 7.6), 150
mM NaCl, 0.1% SDS, 1% NP-40, and protease/phosphatase inhibitors. Protein concentration was deter-mined by Bradford Pierce BCA protein assay (Thermo Fisher Scientific) according to the manufacturer’s instructions. The supernatants were boiled for 10 minutes and separated by SDS-PAGE. Polyacrylamide gels were cast with GERBU acrylamide M-Bis 30% solution; depending on size, proteins were spread on running gel from 10% to 12%.
Primary antibodies included WASp (Santa Cruz Biotechnology Inc., B-9), phospho–NF-κB p65 (Cell Sig-naling Technology, 93H1), total NF-κB p65 (Cell SigSig-naling Technology, C22B4), p-TBK1 (Cell SigSig-naling Tech-nology, 52C2), total TBK1 (Cell Signaling TechTech-nology, D52C2), STING (Cell Signaling TechTech-nology, D2P2F).
Secondary antibodies included anti-rabbit HRP and anti-mouse HRP (Jackson ImmunoResearch Laboratories Inc.).
Real-time PCR. Total RNA was extracted from DCs with TRIzol reagent (MilliporeSigma) according to
the manufacturer’s instructions. cDNA was synthesized using SuperscriptII reverse transcriptase (Invitrogen) or SuperScript VILO (Invitrogen). Real-time PCR for gene expression was performed using SoFast Eva-Green Supermix (Bio-Rad) using specific primers, as follows: Ifnb for TCAGAATGAGTGGTGGTTG, rev GACCTTTCAAATGCAGTAGATTCA; Wash for AGGTGGGGACTTGATGTCAG, rev AGAGAAG-GCTCCTCCAGGTC; Wasp-1 for GATATCGGAGCACCGAGTGG, rev GCAGATCCGGGTCTAG-GTTG; Whamm for AGAGACATGCGAGAAGTTGC, rev CCTTCTAGGACCCAGCTCAT; N-wasp for AGGGTCACCAACGTGGGC, rev GGTGTGGGAGATGTTGTTG; Isg15 for AGCAATGGCCT-GGGACCTAAA, rev CAGACCCAGACTGGAAAGGG; Mx1 for TCATCAGAGTGCAAGCGAGG, rev TCTGATACGGTTTCCTGTGCT; Oas1a for GGTCCAGAGTTCATGGTGGC, rev AACATGAC-CCAGGACATCAAAGG; Ifit2 for GGCCTTCTGCAGTTAATGCTT, rev TGTGCAGCACCTCTA-AGTCTCAT; Gusb for ACTGACACCTCCATGTATCCCAAG, rev CAGTAGGTCACCAGCCCGATG.
Quantification of type I IFN and inflammatory cytokines. ELISA: 2 × 10⁵ cells were stimulated with CpG-B (1 μg/mL) for different times, and cytokine levels in cell culture supernatants were assessed by ELISA. IL-12p70 and TNF were detected by ELISA Max Standard sets (BioLegend), following the manufacturer’s instructions. The absorbance was read at 450 nm with an iMark Microplate Absorbance Reader (Bio-Rad). Soluble cytokines were measured in the supernatant of BMDMs using a bead-based immunoassay (Cytometric Bead Array [CBA], eBioscience). Fluorescence was read using an LSR II flow cytometer (BD Biosciences). Type I IFN was dosed using a biological assay based on the reporter B16-Blue IFN-α/β cells (InvivoGen). Cells were stimulated with the various treatments, and the cell culture supernatant was col-lected for the assay according to the manufacturer’s instructions.
Cellular imaging. To track intracellular ICs, 105 DCs were seeded on fibronectin-coated slides (10 μg/
mL; MilliporeSigma) and allowed to adhere for 30 minutes at 37°C. The indicated concentrations of ICs were added to the slides and incubated for 7, 15, or 40 minutes at 37°C. Cells were gently washed with warm PBS and fixed (4% paraformaldehyde). ICs were detected using an AF594–conjugated Fab to the Fc portion of ICs. For the other markers, cells were incubated with the primary antibodies listed in the next paragraph (in PBS: BSA 0.2%, saponin 0,05%) for 2 hours at room temperature (RT). After 2 washes with PBS, slides were incubated with secondary antibody (in PBS: BSA 0.2%, saponin 0.05%) for 1 hour at RT. Slides were mounted using Fluoro-Gel II with Dapi (Electron Microcopy Science).
Antibodies used for cell labeling. Primary antibodies included the following: EEA1 (Santa Cruz
Biotech-nology, sc-6415), Rab7 (Abcam, ab 137029), Lamp1 (BD Pharmingen, 1D4B), GFP (Life Technologies, A11122). Secondary antibodies included the following: donkey anti-goat–AF555 (Invitrogen, A21432), goat anti-rat–AF488 (Invitrogen A11006), chicken anti-rabbit–AF488 (Invitrogen, A21441).
Other reagents included the following: AF594/Fab (Jackson ImmunoResearch Laboratories Inc., 309-586-003), A488 phalloidin (Life Technologies, A12379), AF555 phalloidin (Life Technologies, A34055), DQ Green BSA (Life Technologies, D12050), Tf-AF647 (Life Technologies, T23366), dextran-AF488 (Life Technologies, ID7178), WGA-AF647 (Life Technologies, W32466).
Image acquisition and analysis. Confocal images were acquired with a LSM 880 META reverse
micro-scope (Zeiss) with a 63×/1.4 NA plan oil objective. The super-resolution images in Figure 2E and Figure 3, A and C, were acquired using the Airyscan detector and processed by online reassignment of the pixel information, followed by linear deconvolution. Image analyses were performed using Volocity 3D Image Analysis Software 5.5.1 (PerkinElmer) and Fiji, ImageJ plugin (NIH). For quantification of organelles, objects were identified using a cutoff of 0.1μm2, and vesicle areas were measured automatically by the Volocity software. To measure the distance of each endosome from the nucleus, the length of the seg-ment between the centroid of the endosome and the centroid of the nucleus was calculated using ImageJ. Peri-endosomal WASp and F-actin distribution and density were quantified as depicted in the scheme in Figure 3B. To identify the peri-endosomal area, we computed a region spanning 0.8 μm from endosome boundaries. Endosomes were defined as EEA1-positive structures greater than 0.1 μm2. Then we applied a threshold to isolate F-actin and WASp signals from the background. Finally, we calculated WASp distribu-tion as the percentage of its signal present in cytosol and in peri-endosomal area, and WASp and F-actin density as the ratio of signal above the threshold on the total area analyzed.
Dextran-FITC assay to assess endosomal membrane permeability. To analyze dextran leakage, cells were
starved for 20 minutes in medium without FBS and pulsed with 200 μg/mL dextran-AF488 for 20 minutes. Cells were washed fixed and analyzed by confocal microscopy. To analyze the fraction of diffused cytosolic dextran, we optimized a preexisting macro to analyze images of dextran-FITC–labeled cells in a semiau-tomated fashion. The macro’s output was coupled with a function written in R language (R software ver-sion 3.4.2) for data mining and rearrangement. In brief, dextran signal was categorized as “compartmen-talized” or “diffuse,” according to a stringent, manually chosen threshold of pixel intensity (of 0–255). Subsequently, green areas that were at first recognized as diffuse underwent a second round of filtering according to their surface and shape. Regardless of pixel intensity, green spots of 0.05–0.80 μm bearing a round coefficient greater than 0.40 were considered as “compartmentalized” signal in the final output.
Electron microscopy. DCs were incubated with BSA-Au5 conjugates (Cell Microscopy Core, UMC
Utrecht) added to the medium for 2 hours at 37C° to mark endocytic trafficking route. Afterward, DCs were fixed at RT by addition of Karnovsky fixative (2.5% glutaraldehyde and 2% formaldehyde [Electron Microscopy Sciences] in 0.2 M phosphate buffer, pH 7.4) in equal amount to culture medium for 15 min-utes. Then, the medium was replaced by fresh fixative for 2 hours at RT. DCs were then post-fixed with 1% OsO4/1.5% K3Fe(III) (CN)6 in 0.065 M phosphate buffer for 2 hours at 4°C and finally 1 hour with 0.5% uranyl acetate. After fixation, cells were dehydrated and embedded in epoxy Epon resin (Polysciences). Ultrathin sections of 60 nm were contrasted with uranyl acetate and lead citrate using AC20 (Leica) and examined with a Tecnai T12 transmission electron microscope (FEI Thermo Fisher Scientific). Images were taken from 3 different blocks of cells per condition. Quantification of electron microscopic images was done using Fiji. For quantification of the area and perimeter of endolysosomes, the smallest possible ellipse to surround the organelle was drawn in Fiji with the freehand selection tool, and then the ellipse was measured. Fifty random images per block were taken and analyzed (in total 3 × 50 = 150 cell profiles were measured per experimental condition).
Live microscopy. To mark endocytosis, 2 × 10⁵ DCs were seeded for 30 minutes in a Nikon
cham-ber at 37°C with 5% CO2 on MatTek microwell dish. After adhesion, cells were pulsed for 5 seconds with 5 μg/mL WGA-AF647. After 2 washes in warm PBS, warm complete media was added. Cells were recorded in epifluorescence for 45 minutes with 1 frame every 15 seconds on a C1 Nikon reverse microscope with a 60× objective.
Treatment with inhibitors. Cells were treated with 25 μM of Arp2/3 inhibitor CK666 (Tocris Bioscience,
3950), Lat-A (0.5 μM; MilliporeSigma, L5163). Control cells were treated with an equivalent concentration of DMSO. After 30 minutes of incubation, cells were washed and used for the different experiments. The
STING inhibitors C-176 (PC-35311) and C-178 (PC-35310) (34) were purchased from ProbeChem. The cGAS inhibitor RU.521 was purchased from Invivogen (inh-ru521). For in vitro treatments, cells were pre-incubated with 0.5 μM C-176, 50 μM RU.521, or the equivalent concentration of DMSO. After 30 minutes, stimuli were added to the wells without washing the inhibitor. RNA or cell culture supernatant was collect-ed after 3 and 16 hours, respectively. For in vivo treatment, mice were injectcollect-ed with 7.5 μL C-176 or DMSO dissolved in 85 μL corn oil twice per day for 11 consecutive days. Mice were euthanized, and total spleen was harvested. RNA was extracted from single-cell suspension to perform RT-PCR.
Statistics. All statistical analyses were performed using GraphPad Prism 6 software. All data are
report-ed as mean ± SEM. Unpairreport-ed 1-tailreport-ed Student’s t test or 2-way ANOVA was usreport-ed to assess significance. P values less than 0.05 were considered significant.
Study approval. The study was approved by International Centre for Genetic Engineering and
Biotechnol-ogy (ICGEB) board for animal welfare and authorized by the Italian Ministry of Health (Aut. N.1155/2016-PR). Animal care and treatment were conducted with national and international laws and policies (European Economic Community Council Directive 86/609; OJL 358; December 12, 1987). Mice were housed and han-dled according to institutional guidelines and experimental procedures approved by the International Centre for Genetic Engineering and Biotechnology (ICGEB) board. All experiments were performed in accordance with Federation of European Laboratory Animal Science Association (FELASA) guidelines.
Author contributions
GMP and AN performed key experiments, analyzed data, prepared figures, and contributed to manuscript writing. GS, RA, NC, KECL, AC, HA, and FG performed extra experiments. NL and JK performed and analyzed electron microscopy experiments. PB provided conceptual support and data interpretation. HH and RNA provided reagents. FB ideated and supervised the study and wrote the manuscript.
Acknowledgments
This work was supported by Telethon grant GGP14281 to FB. GMP, AN, and KECL were supported by ICGEB Arturo Falaschi pre- and postdoctoral fellowships. NC was supported by an AIRC grant to FB. Address correspondence to: Benvenuti Federica, Cellular Immunology, Area di Ricerca, Padriciano 99, 34149 Trieste, Italy. Phone: 39.040.3757389; Email: benvenut@icgeb.org.
1. Means TK, Latz E, Hayashi F, Murali MR, Golenbock DT, Luster AD. Human lupus autoantibody-DNA complexes activate DCs through cooperation of CD32 and TLR9. J Clin Invest. 2005;115(2):407–417.
2. Lande R, et al. Plasmacytoid dendritic cells sense self-DNA coupled with antimicrobial peptide. Nature. 2007;449(7162):564–569. 3. Marshak-Rothstein A. Toll-like receptors in systemic autoimmune disease. Nat Rev Immunol. 2006;6(11):823–835.
4. Crowl JT, Gray EE, Pestal K, Volkman HE, Stetson DB. Intracellular nucleic acid detection in autoimmunity. Annu Rev
Immu-nol. 2017;35:313–336.
5. Soni C, Reizis B. DNA as a self-antigen: nature and regulation. Curr Opin Immunol. 2018;55:31–37.
6. Motwani M, Pesiridis S, Fitzgerald KA. DNA sensing by the cGAS-STING pathway in health and disease. Nat Rev Genet. 2019;20(11):657–674.
7. Sun L, Wu J, Du F, Chen X, Chen ZJ. Cyclic GMP-AMP synthase is a cytosolic DNA sensor that activates the type I interferon pathway. Science. 2013;339(6121):786–791.
8. Chen Q, Sun L, Chen ZJ. Regulation and function of the cGAS-STING pathway of cytosolic DNA sensing. Nat Immunol. 2016;17(10):1142–1149.
9. Kawane K, et al. Chronic polyarthritis caused by mammalian DNA that escapes from degradation in macrophages. Nature. 2006;443(7114):998–1002.
10. Ahn J, Gutman D, Saijo S, Barber GN. STING manifests self DNA-dependent inflammatory disease. Proc Natl Acad Sci U S A. 2012;109(47):19386–19391.
11. Gao D, et al. Activation of cyclic GMP-AMP synthase by self-DNA causes autoimmune diseases. Proc Natl Acad Sci U S A. 2015;112(42):E5699–E5705.
12. Okabe Y, Kawane K, Akira S, Taniguchi T, Nagata S. Toll-like receptor-independent gene induction program activated by mam-malian DNA escaped from apoptotic DNA degradation. J Exp Med. 2005;202(10):1333–1339.
13. Rodero MP, et al. Type I interferon-mediated autoinflammation due to DNase II deficiency. Nat Commun. 2017;8(1):2176. 14. Yanai H, Savitsky D, Tamura T, Taniguchi T. Regulation of the cytosolic DNA-sensing system in innate immunity: a current
view. Curr Opin Immunol. 2009;21(1):17–22.
15. Chamilos G, et al. Cytosolic sensing of extracellular self-DNA transported into monocytes by the antimicrobial peptide LL37.
Blood. 2012;120(18):3699–3707.
16. Monteith AJ, et al. Defects in lysosomal maturation facilitate the activation of innate sensors in systemic lupus erythematosus.
17. Lood C, et al. Neutrophil extracellular traps enriched in oxidized mitochondrial DNA are interferogenic and contribute to lupus-like disease. Nat Med. 2016;22(2):146–153.
18. Crestani E, et al. Broad spectrum of autoantibodies in patients with Wiskott-Aldrich syndrome and X-linked thrombocytopenia.
J Allergy Clin Immunol. 2015;136(5):1401–1404.e1.
19. Catucci M, Castiello MC, Pala F, Bosticardo M, Villa A. Autoimmunity in wiskott-Aldrich syndrome: an unsolved enigma.
Front Immunol. 2012;3:209.
20. Massaad MJ, Ramesh N, Geha RS. Wiskott-Aldrich syndrome: a comprehensive review. Ann N Y Acad Sci. 2013;1285:26–43. 21. Candotti F. Clinical manifestations and pathophysiological mechanisms of the Wiskott-Aldrich syndrome. J Clin Immunol.
2018;38(1):13–27.
22. Prete F, et al. Wiskott-Aldrich syndrome protein-mediated actin dynamics control type-I interferon production in plasmacytoid dendritic cells. J Exp Med. 2013;210(2):355–374.
23. Cervantes-Luevano KE, et al. Neutrophils drive type I interferon production and autoantibodies in patients with Wiskott-Al-drich syndrome. J Allergy Clin Immunol. 2018;142(5):1605–1617.e4.
24. Lee PP, et al. Wiskott-Aldrich syndrome protein regulates autophagy and inflammasome activity in innate immune cells. Nat
Commun. 2017;8(1):1576.
25. Kolhatkar NS, et al. Altered BCR and TLR signals promote enhanced positive selection of autoreactive transitional B cells in Wiskott-Aldrich syndrome. J Exp Med. 2015;212(10):1663–1677.
26. Castiello MC, et al. In vivo chronic stimulation unveils autoreactive potential of Wiskott-Aldrich syndrome protein-deficient B cells. Front Immunol. 2017;8:490.
27. Sereni L, et al. Autonomous role of Wiskott-Aldrich syndrome platelet deficiency in inducing autoimmunity and inflammation.
J Allergy Clin Immunol. 2018;142(4):1272–1284.
28. Henault J, et al. Noncanonical autophagy is required for type I interferon secretion in response to DNA-immune complexes.
Immunity. 2012;37(6):986–997.
29. Redecke V, et al. Hematopoietic progenitor cell lines with myeloid and lymphoid potential. Nat Methods. 2013;10(8):795–803. 30. Bretou M, et al. Lysosome signaling controls the migration of dendritic cells. Sci Immunol. 2017;2(16):eaak9573.
31. Derivery E, Sousa C, Gautier JJ, Lombard B, Loew D, Gautreau A. The Arp2/3 activator WASH controls the fission of endo-somes through a large multiprotein complex. Dev Cell. 2009;17(5):712–723.
32. Serrano-Puebla A, Boya P. Lysosomal membrane permeabilization in cell death: new evidence and implications for health and disease. Ann N Y Acad Sci. 2016;1371(1):30–44.
33. Zhang C, Shang G, Gui X, Zhang X, Bai XC, Chen ZJ. Structural basis of STING binding with and phosphorylation by TBK1.
Nature. 2019;567(7748):394–398.
34. Haag SM, et al. Targeting STING with covalent small-molecule inhibitors. Nature. 2018;559(7713):269–273.
35. Castiello MC, et al. Wiskott-Aldrich syndrome protein deficiency perturbs the homeostasis of B-cell compartment in humans. J
Autoimmun. 2014;50:42–50.
36. Pawaria S, et al. Taking the STING out of TLR-driven autoimmune diseases: good, bad, or indifferent? J Leukoc Biol. 2017;101(1):121–126.
37. Gkirtzimanaki K, et al. IFNα Impairs autophagic degradation of mtDNA promoting autoreactivity of SLE monocytes in a STING-dependent fashion. Cell Rep. 2018;25(4):921–933.e5.
38. Li Y, et al. TMEM203 is a binding partner and regulator of STING-mediated inflammatory signaling in macrophages. Proc Natl
Acad Sci U S A. 2019;116(33):16479–16488.
39. Duleh SN, Welch MD. WASH and the Arp2/3 complex regulate endosome shape and trafficking. Cytoskeleton (Hoboken). 2010;67(3):193–206.
40. Tian L, Nelson DL, Stewart DM. Cdc42-interacting protein 4 mediates binding of the Wiskott-Aldrich syndrome protein to microtubules. J Biol Chem. 2000;275(11):7854–7861.
41. Campellone KG, Webb NJ, Znameroski EA, Welch MD. WHAMM is an Arp2/3 complex activator that binds microtubules and functions in ER to Golgi transport. Cell. 2008;134(1):148–161.
42. Benmerzoug S, et al. STING-dependent sensing of self-DNA drives silica-induced lung inflammation. Nat Commun. 2018;9(1):5226.
43. Andersson U, Yang H, Harris H. High-mobility group box 1 protein (HMGB1) operates as an alarmin outside as well as inside cells. Semin Immunol. 2018;38:40–48.
44. Baptista MA, et al. Deletion of Wiskott-Aldrich syndrome protein triggers Rac2 activity and increased cross-presentation by dendritic cells. Nat Commun. 2016;7:12175.
45. Papadopoulos C, Meyer H. Detection and clearance of damaged lysosomes by the endo-lysosomal damage response and lys-ophagy. Curr Biol. 2017;27(24):R1330–R1341.
46. Lang PA, et al. Reduced type I interferon production by dendritic cells and weakened antiviral immunity in patients with Wis-kott-Aldrich syndrome protein deficiency. J Allergy Clin Immunol. 2013;131(3):815–824.
47. Blundell MP, et al. Improvement of migratory defects in a murine model of Wiskott-Aldrich syndrome gene therapy. Mol Ther. 2008;16(5):836–844.
48. Lee BL, et al. UNC93B1 mediates differential trafficking of endosomal TLRs. Elife. 2013;2:e00291.
49. Schadt L, et al. Cancer-cell-intrinsic cGAS expression mediates tumor immunogenicity. Cell Rep. 2019;29(5):1236–1248.e7. 50. Vincent J, et al. Small molecule inhibition of cGAS reduces interferon expression in primary macrophages from autoimmune