HAL Id: hal-02433888
https://hal.archives-ouvertes.fr/hal-02433888
Submitted on 9 Jan 2020HAL is a multi-disciplinary open access archive for the deposit and dissemination of sci-entific research documents, whether they are pub-lished or not. The documents may come from teaching and research institutions in France or abroad, or from public or private research centers.
L’archive ouverte pluridisciplinaire HAL, est destinée au dépôt et à la diffusion de documents scientifiques de niveau recherche, publiés ou non, émanant des établissements d’enseignement et de recherche français ou étrangers, des laboratoires publics ou privés.
Flow analysis in the upper plenum of the micas model in
support of the astrid reactor program
D. Guenadou, P. Aubert, V. Biscay, Jp. Descamps
To cite this version:
D. Guenadou, P. Aubert, V. Biscay, Jp. Descamps. Flow analysis in the upper plenum of the micas model in support of the astrid reactor program. NURETH17, Sep 2017, Xi’An, China. �hal-02433888�
FLOW ANALYSIS IN THE UPPER PLENUM OF THE MICAS MODEL IN
SUPPORT OF THE ASTRID REACTOR PROGRAM
D. Guenadou, P. Aubert, V. Biscay and J-P. Descamps
CEA Cadarache, DTN/STCP/LHC 13108 Saint Paul lez Durance, France
[email protected]; [email protected]; [email protected], [email protected]
ABSTRACT
The sodium cooled reactor ASTRID project (Advanced Sodium Technological Reactor for Industrial Demonstration) led by the CEA has entered the basic design phase. Current developments are focused on the large equipment such as the vessels. Even if France has a great experience in the SFR technology because of the 90’s EFR program, new experiments are needed both to qualify the design options and to validate the code calculations. Since experiments with sodium are more complex to carry out, most tests are conducted in models using water as simulant fluid. According to the dimensionless analysis,
experiments can be designed to be representative of the phenomenology to study. The MICAS mock-up of the ASTRID upper plenum was designed regarding this methodology using the Froude number for the free surface flow issues and the Richardson number for the thermal studies. It was built at a 1/6 scale in transparent polymer for optical measurements.
First experiments were dedicated to study the free surface flow and the gas entrainment. Experimental conditions, such as the water flow rate, were calculated to get the representative Froude number. From those operating conditions and the MICAS geometry, calculations were led using TRIO_CFD at CEA and Adapco StarCCM+ at AREVA. This article is devoted to present the methodology and the results of the velocity measurements in the MICAS model dedicated to validate the code calculations. A PIV system was used to measure the velocity. As this technique is based on an optical access to two perpendicular planes, its implementation on the MICAS mock-up was complex. Indeed, many immerged components, such as the pump pits and the decay heat exchangers, prevent any optical access in specific areas. Most measurements were performed around the core, the Intermediate Heat Exchanger (IHX) and the Above Core Structure (ACS). The integration of the velocity around the ACS allows calculating the flow rate crossing this structure. As the control rods in the ACS are modeled by porous media, it is an important result to fit the pressure drop coefficient in the code.
KEYWORDS
Sodium fast reactor, mock-up, PIV, validation.
1. INTRODUCTION
Nuclear energy can play an important role to provide sustainable and carbon-free electricity. Many nuclear reactors are under construction all over the world, but they are Gen II or Gen III type. This kind of reactors uses only the uranium 235 isotope, which accounts for only a very low part (0.71%) of the raw uranium mineral. The estimate stocks cover reactors operations during about 100 years. Gen IV reactors intend to use the 238 uranium isotope, which is the wide spread type (99.28%). In this case, the stocks are estimated for thousands years of operation. Another interest is the lessening of the former generation volume of waste. Indeed, their spent fuels are composed mainly by the 238 uranium isotope. For all those
advantages, the Gen IV reactors are the future of the nuclear industry. For those reasons, CEA and many industrial partners are involved in the development of a Gen IV industrial prototype: ASTRID (Advanced Sodium Technological Reactor for Industrial Demonstration) [1].
Many coolants can be employed, such as helium, lead or sodium. This latter was used in the reactors built in France during the 70s and 80s (Phénix and Superphénix) and as CEA has a lot of experience in sodium cooled reactors technology [2], this coolant was preferred for ASTRID. For its development,
experimentations are needed both for studying the design options and for validating the code calculations. Even if CEA carried out many experiments in the 90s for the EFR project, new tests, specific to the ASTRID design, are required. Experimentations with sodium are very complex due to its opacity and its high reactivity with water. As water and sodium are very close regarding physical properties, in terms of density and viscosity, most experiments are performed with water. In this framework, the PLATEAU loop was built in 2012 [3]. It aims at providing the experimental conditions, in terms of flow rate and
temperature, to the various models. The first mockup, MICAS, commissioned in 2015, represents the upper plenum of the ASTRID reactor at a 1/6 scale. It aims at studying the main different thermohydraulic issues such as the gas entrainment at the free surface [4], the flow around the Intermediate Heat
Exchangers (IHX), the behavior of the jet going out from the core, and the flow crossing the Above Core Structure (ACS). During the past projects in the 90s, various models were built to study those issues. A lot of experiments were carried out in the 1/8 scale mockup COLCHIX4 [5] regarding the free surface state, the IHXs supply, and the flow crossing the ACS. The velocity fields around the IHX were measured using propellant sensor probes. This technique, wildly used in the hydrogeological domain to measure the river flow, is very accurate, but intrusive. Regarding the flow in the ACS, it was measured by analyzing the pressure losses inside the sheath tubes hanging the control rods and the instrumentation of the core. The flow versus the pressure losses was calibrated in a dedicated setup prior to the COLCHIX experiments. This method is quite heavy to implement because it requires specific tests to build a pressure losses versus flow correlation. Spaccapaniccia and al. [6] presented some Particle Imaging Velocity (PIV)
measurements around the ACS of the MYRRHABELLE models. This one is similar to MICAS but it is dedicated to the MYRRHA heavy liquid metal cooled reactor. The results show the jets going out from the ACS into the upper plenum for various operating conditions. Nobuyuki and al. [7] also used PIV in a water model of a Fast Breeder Reactor to optimize the design. As PIV offers the great advantage to be non-intrusive, we decided to implement it for analyzing the flow behavior in the MICAS model.
This study focuses on the flow behavior inside the upper plenum of the ASTRID reactor model using the PIV velocity measurement technique. The first part of this article briefly introduces the MICAS mockup and the PIV setup. The second part presents the velocity measurements at various key locations, such as around the core and the IHX inlets, along the ACS. By using these results, analysis will be carried out to calculate the flow rate crossing the ACS by different ways and the influence of the water head is studied. The determination of this parameter is capital to validate the numerical code calculations.
2. THE MICAS MODEL AND THE VELOCITY MEASUREMENT SETUP 2.1 The MICAS Mockup and the Experimental Operating Conditions
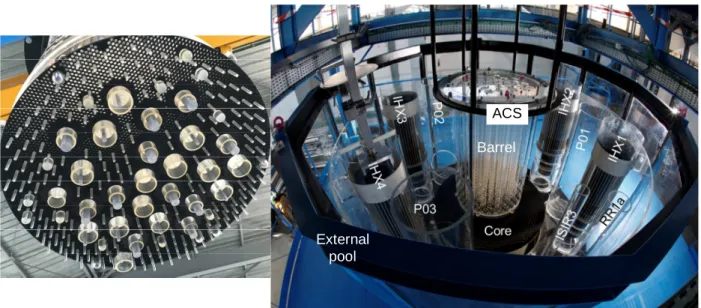
The figure 1 shows the MICAS mockup of the ASTRID upper plenum. Most of the components of this 1/6 scale model are built in Polymethyl methacrylate (PMMA) transparent polymer for optical
visualizations. This scale was chosen as a compromise between the overall size and the detail of the geometry of the vessel. But due to high mechanical stresses or their specific design, some of them were not manufactured in polymer but in aluminum. This is the case for:
• the upper part of the core, due to the high pressure in the injection chamber,
• the inlet of the IHX (cf. right hand side of the figure 1), due to its thin and soaring structure,
These aluminum structures appear in black in the photos of the figure 1 because of anodization. It avoids laser reflection both for safety reasons and measurements accuracy. The model is surrounded by a 12 walls pool filled with water to reduce the optical deformations. The planes are made with a high optical quality grade PMMA. As water and PMMA have close refraction index (1.3 and 1.5) compared to air (refraction index≈1), the optical deformations are lessened by the thin water layer between the mockup and the plane faces of the external pool.
The left hand side of the figure 1 shows the bottom part of the ACS. It exhibits numerous tubes and many small tips. The tips are located in front of the fuel assemblies of the core. They represent the
instrumentation dedicated to measure the velocity and the temperature at the outlet fuel assembly in order to detect any blockage. The tubes exhibit various diameters and they represent the sheath holding the control rods. One part of the core water flows horizontally along the black grid. Another part crosses the grid and is deflected by the ACS. Finally the last part goes through these sheath tubes and exit around the ACS. One aim of this study is to determine this flow rate.
Figure 1. Photos of the MICAS model. Left hand side: bottom view of the ACS. Right hand side: Top view of the MICAS mock-up.
In order to be relevant regarding the flow pattern in the ASTRID reactor, dimensionless analysis was achieved. As the studies are mainly focused on the hydraulic aspect and the free surface behavior, the Froude number was observed. Detailed calculations are presented in [3]. The MICAS core is split in three outlets to represent the ASTRID design: the fission area, the reflectors and the internal fuel storage. In those zones, the flow rates are fitted according to the real flow distribution in the ASTRID reactor. The flow rate injections are tuned using three Coriolis flowmeters (accuracy 0.1%). As the influence of the water level on the flow pattern is studied, this one is monitored by a guided wave radar sensor
EMERSON Rosemont 5301 (accuracy +/- 2 mm). The whole experimental parameters are presented in the table I. The water level origin is set at the core outlet.
External pool
ACS
Table I. Experimental parameters Temperature 20°C Flow rate 385 m3/h Fissile zone 95.5% Reflectors 1.1% Internal Storage 3.4% Water level 900 mm 786 mm 619 mm
Figure 2: PIV setup used to measure the velocity fields
2.2 The Velocity Measurement Setup
The flow field inside the MICAS model is measured using a PIV technique. A photo of the setup is presented on the figure 2. This technique allows acquiring 2D large velocity fields. It is based on the measurement of particles displacement during two short laser pulses separated by a brief delay. In our setup, the laser is set on a 3-axis motion table to get as accurate as possible positioning. Large
measurement domains are obtained thanks to a laser sheet to enlighten the particles. Clean DI water is used in the MICAS mockup, but as the free surface is open air, it catches dust and atmospheric particles so that no additional particles were needed in the water. The particles scatter the laser light which is recorded on a 4 Mpixels CCD camera located perpendicular to the laser sheet. A filter at the laser wavelength is set on the camera in order to only get the light scattered by the particles and to avoid the noise due to ambient light. Nevertheless, the ambient light has an influence on the results and to reduce
Laser Camera External
this effect, black curtains are put all around and over the model to be in the darkest conditions possible. Moreover, those curtains were compulsory for laser safety reasons. Calibrations are carried out prior to the measurement using a target. The measurement domain is meshed in cells depending on the amount of particles. The time delay between the two laser pulses is calculated regarding the mean velocity and particles density. A particle should not exit the cells during its motion between the two laser pulses. The knowledge of the approximate mean velocity and the cell size allows calculating the time delay between the two pulses. This parameter is tuned during the experiments regarding the velocity results. Data were analyzed using the Insight 4G software (version 10.10.4).
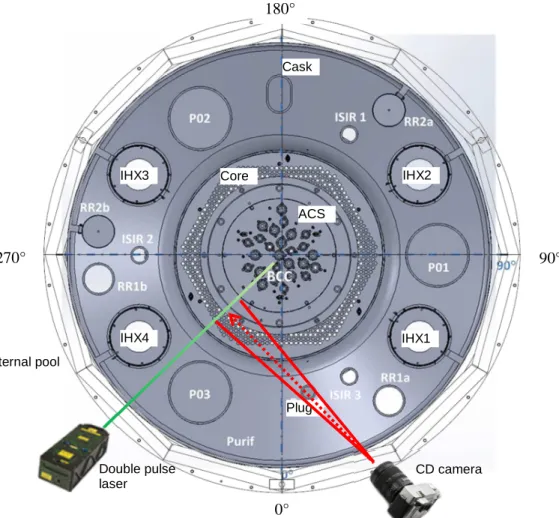
The figure 3 shows the configuration to get the velocity around the core and the ACS. Measurements cannot be possible everywhere around those elements because of optical obstacles. On the one hand, the laser beam cannot cross the IHX and on the other hand the camera cannot be positioned in front of the IHX. Moreover, as the external pool is made with vertical steel bars (in blue on the figure 2) to hold the PMMA flat panels, it reduces the optical access to the model. Finally, as the laser sheet and the camera must be perpendicular, only few locations are reachable for the velocity measurements. Fortunately, as the camera is equipped with a 35mm lens, the measurement domain is quite large: 400 mm X 400 mm. Only average velocity field is presented in this article. The acquisition rate is 15 Hz and the mean values are calculated over 150 images, i.e. over 10 s of test.
Figure 3. Configuration to measure the velocity field around the ACS and the core exit
Plug Cask IHX1 IHX2 IHX3 IHX4 ACS Core CD camera Double pulse laser External pool 0° 90° 270° 180°
3. RESULTS AND COMMENTS
3.1 Velocity around the Core
Because of the geometrical constraints exhibited in the last part, three locations were only studied around the core. The results are presented on the figures 4-6 for various water heads and azimuth angles around the core. The azimuth 0° origin angle is mentioned on the figure 3. On every figure, the velocity results field and the raw photo overlap to better understand the flow pattern.
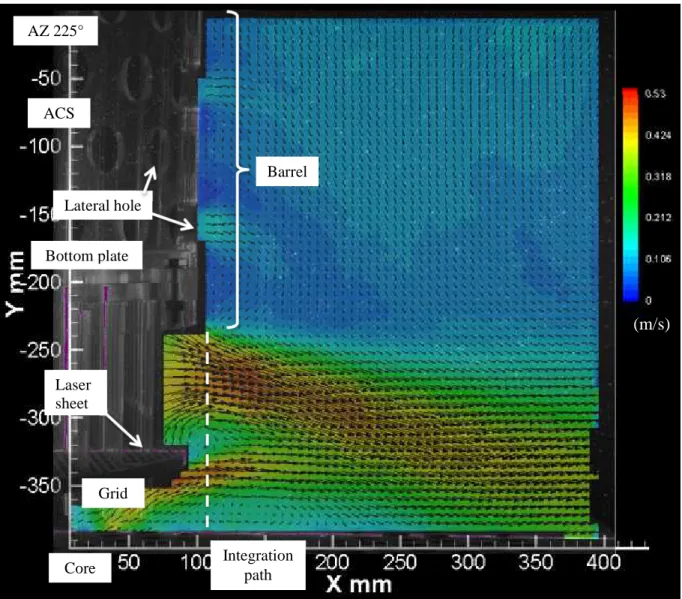
Figure 4. Velocity field around the core for a 900 mm water head above the core outlet (azimuth angle 225°)
On the figure 4, first of all, we can notice the trace (in purple) made by the laser sheet on the plate grid of the ACS and on the core. From the velocity field results, we can observe that the flow going out from the
(m/s)
ACS
Grid Laser sheet
Core Integration path AZ 225°
Lateral hole
Bottom plate
under-ACS-area is split in two jets. The under-ACS-area corresponds to the fissile and the reflector zones of the table I. The main part of the core flow crosses the plate grid and is deflected down by the ACS waterproof plate. The other part flows along the bottom side of the plate grid and goes up at its edge. The two jets mix at about 20 mm from the ACS and flow down along the outside part of the core. This pattern is expected to avoid any jet fluctuation that can induce thermal fatigue on the immerged components. Indeed, should the jet rise from core, it would oscillate due to the mixing with the cold fluid and the buoyancy effects. This situation must be avoided. Two small loops occur close to the grid plate: one between the two jets, and another between the bottom jet and the core.
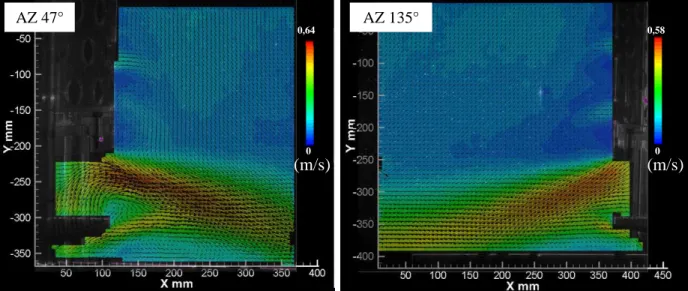
Figure 5. Influence of the location on the velocity field around the core for a 900 mm water head: azimuth angle 47° on the left hand side, azimuth angle 135° on the right hand side.
Figure 6. Influence of the water level on the velocity field around the core for the azimuth angle 225°: 786 mm on the left hand side, 618 mm on the right hand side.
0 0 0,58 0,64 (m/s) (m/s) 0 0 0,52 (m/s) (m/s) 0,55 AZ 47° AZ 135° 786mm 619mm
The results for the two other azimuth angles are drawn on the figure 5. At first glance, we can notice that the azimuth 47° on the right hand side looks like the 225° angle on the figure 4. Few little differences occur such as bigger loops and a higher maximum velocity. On the other hand, the azimuth 135° on the right hand side of the figure 5 differs a little more from the other results. No loop occurs between the two jets exiting from core jets and a little one is noticed along the core. For this azimuth angle, the
measurement domain is wider than the others and we can observe the whole pattern of the jet, flowing down along the core until a horizontal behavior. From those results, we can conclude that the flow has different patterns around the core.
The figure 6 shows the influence of the water level on the flow velocity around the core. For comparison, only the results of the azimuth 225° are shown. No noticeable differences exist between the three results. The maximum velocities flow patterns are rather the same for every water head. It seems that the water level does not influence the flow behavior around the core.
3.1 Flow around the ACS
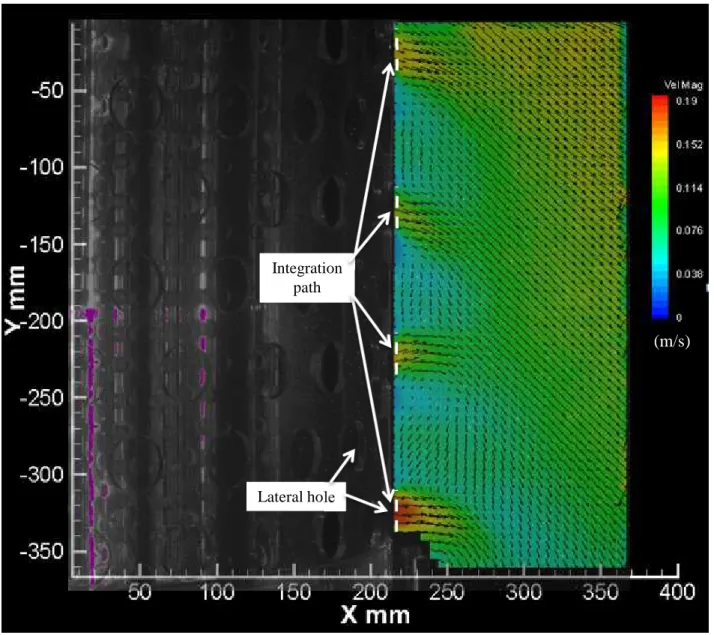
We can see on the figures 4-6 in the barrel area, the flow across the ACS lateral holes for the various water heads and azimuths around the core. More detailed measurements were performed along the ACS in order to analyze the jets exiting from the holes. The figure 7 shows the flow across the holes for a 900 mm water head configuration. From a general point of view, the water flows downward as if it is attracted by the core jet. Moreover we can notice the maximum velocity is rather low and located at the lowest hole. The jets going out from the two lowest holes exhibit a horizontal motion, while the two highest one flow downward. Except for few cases, we generally observe this trend whatever the water level and the measurement location around the barrel. This behavior seems consistent with the general flow pattern in the model. Even if the flow is sucked into the IHX, a fluid loop occurs in the mockup. The water from the core edge flows to the walls model and goes upward to the free surface. At the surface, it returns back to the ACS and dives along the barrel, involving vertical velocity. Spaccapaniccia and al. [6] measured similar maximum velocities but an opposite behavior: the lowest jets flow upward and the highest ones to a horizontal direction.
From the measurements around the ACS and the core, we can calculate the flow rate crossing the ACS by integrating the velocity. As mentioned previously, this datum is capital for the code validation. Two ways may be used to achieve this task: by direct calculation along the ACS lateral holes and by indirect
calculation along the core jet.
• By direct calculation along the ACS lateral holes.
As the velocity measurements are 2D and they are achieved in a vertical plane crossing the lateral ACS holes center, we assume for the calculations that the jets exiting from the holes are axisymmetric. The flow rate is calculated according to the equation 1 for each hole along the path reported on the figure 7.
= / / . (1)
Where Qhole is the flow rate across the hole, d is the ACS holes diameter and Vx is the horizontal velocity
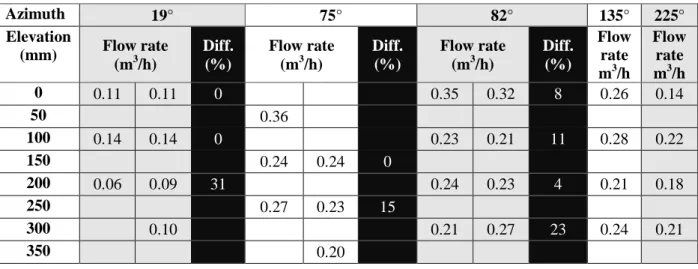
component. To investigate the accuracy, some measurements are carried out twice. The table II shows the flow rates across the holes at the 900 mm water level for various azimuths around the ACS. As the holes are not all aligned on a vertical row but shifted line by line (see figure 7), the PIV measurements can only reach 4 holes on the whole ACS height. Moreover, since the optical field is 400 mm X 400 mm, in some configurations we are not able to get the entire ACS. In those cases, two measurements are necessary to deal all the ACS holes, one in the lowest part, the other, in the highest one. These two facts explain the blanks in the table II. At the end, 5 planes and 20 holes are investigated. One can argue that it is a small
sample compared to the total amount of holes (i.e. 240), but as the measurements are quite wide spread in azimuth, we believe this is a quite good representative sample. In the table II, first of all, we can see that the discrepancies between the measurements at the same azimuth are rather small. Exceptions occur at the highest elevations but the values are in the same range. From a general point of view in the table II, the flow rate is very heterogeneous regarding the azimuth angle. It is difficult to conclude if it is due to the ACS or the vessel design since they are both asymmetric. Moreover, we notice in the table II that the flow rate is higher trough the lowest holes. Indeed, as the sheath tubes of the ACS hold the control rods, the pressure losses increase versus the elevation and thus the flow rate decreases. From these two remarks, we can conclude the flow rate crossing the ACS is very heterogeneous around the barrel. As a consequence, we advise to observe the exact ACS design, and especially the barrel holes, for the code validation. Indeed, as some calculations consider the barrel to be a homogenous porous media, the heterogeneous flow around the ACS may not be observed.
Figure 7. Velocity field around the ACS for a 900 mm water head above the core outlet (azimuth angle 82°)
(m/s)
Integration path
Table II. Flow rates across the lateral ACS holes at the 900 mm water level. The 0 elevation is considered at the center of the lowest holes.
Azimuth 19° 75° 82° 135° 225° Elevation (mm) Flow rate (m3/h) Diff. (%) Flow rate (m3/h) Diff. (%) Flow rate (m3/h) Diff. (%) Flow rate m3/h Flow rate m3/h 0 0.11 0.11 0 0.35 0.32 8 0.26 0.14 50 0.36 100 0.14 0.14 0 0.23 0.21 11 0.28 0.22 150 0.24 0.24 0 200 0.06 0.09 31 0.24 0.23 4 0.21 0.18 250 0.27 0.23 15 300 0.10 0.21 0.27 23 0.24 0.21 350 0.20
The overall flow rate crossing the ACS is calculated by averaging the flow rates through the holes multiplied by the amount of holes. The results in function of the water level are presented in the table IV.
• By indirect calculation along the core jet.
The flow exiting from the core is split in two parts: one is deflected horizontally by ACS bottom plate; the other one crosses the ACS through the sheath tubes. Considering a flow balance around the core, we can obtain the flow rate crossing the ACS by calculating the one deflected by the ACS bottom plate, as expressed on the equation 2 below.
Qcore = QACS + Qjet (2)
Where Qcore is the flow rate in the core, QACS is the flow rate through the ACS and Qjet is the flow rate of
the jets deflected by the ACS bottom plate. As Qcore is set and known (table I) thanks to the flowmeter of
the PLATEAU loop [3], we need to get Qjet to calculate QACS. As previously, Qjet is calculated by
integrating the velocity along the path shown on the figure 4 according to the following equation 3.
= . (3)
Where Vx is the horizontal velocity component, h is the distance between the core and the bottom of the
ACS barrel and D is the barrel diameter. In the equation 3, we assume that the jet deflected by the bottom plate is equal all around the ACS. But this assumption is not rigorously true as discussed in the paragraph 3.1 by analyzes of the figures 4 and 5. Thus to get a more accurate value of the flow rate crossing the ACS we calculate the average of Qjet at the various azimuths. The table III presents an example of
calculations at the 900 mm water level. We notice that the flow rates at the azimuths 47° and 225° are equal. That is consistent with analyzes of the jets going out from the core of the paragraph 3.1 where we concluded the flow behaviors of these two azimuths are rather similar. The azimuth 135° shows a higher flow rate even if the maximum velocity is lower than that at 225°. The final results regarding the flow rate crossing the ACS are presented in the table IV.
Table III. Flow rates of the jets deflected by the bottom ACS plate at the 900 mm water level.
Azimuth 47° 135° 225° Average
Flow rate Qcore (m3/h) 308 327 309 315
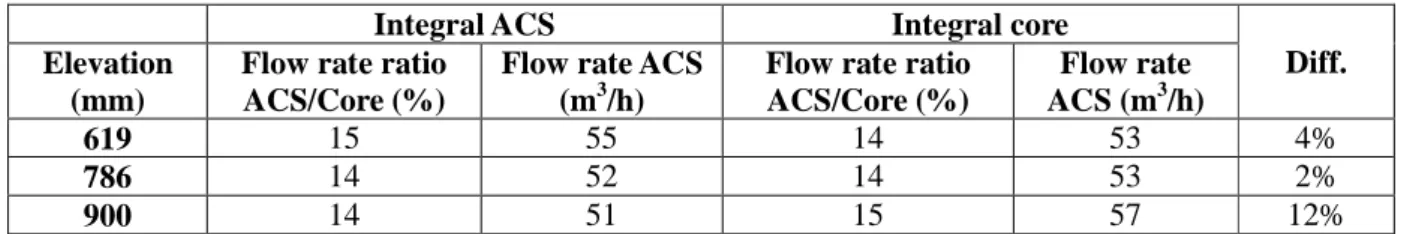
The table IV shows the flow rate crossing the ACS versus the water head calculated using two different methods. First of all, the two ways to determine the flow rate across the ACS give the same results. The values are very close, except for the 900 mm water level, but the difference is still rather low to be considered as correct. We can be more confident in our results as we found the same values even if we only use few PIV planes to calculate the flow rate. Regarding the effect of the water head, we can notice that this one has not impact on the flow rate across the ACS. The results are rather the same whatever the water level and the method of calculation. We can conclude that the flow rate ratio across the ACS is 14% of the core flow. The independence of the flow rate across the ACS and the water level may be explained by the pressure losses through the ACS. As, whatever the water head, the entire flow goes out from the ACS under the free surface, the hydrostatic pressure loss is still the same versus the water level. Since the flow rate only depends on the pressure losses due to the ACS design, it is constant versus the water head.
Table IV. Flow rate across the ACS (QACS) for various water levels
Integral ACS Integral core
Diff. Elevation
(mm)
Flow rate ratio ACS/Core (%)
Flow rate ACS (m3/h)
Flow rate ratio ACS/Core (%) Flow rate ACS (m3/h) 619 15 55 14 53 4% 786 14 52 14 53 2% 900 14 51 15 57 12% 4. CONCLUSIONS
The 1/6th scaled MICAS mock-up is dedicated to study the flow behavior in the upper plenum of the ASTRID reactor. The first studies were carried out with the same Froude number among the reactor and the model to get a similar surface flow behavior. The main goal is to obtain the flow rate across the ACS and its dependence versus the water level. The PIV technique was used to measure the velocity in various area of the model, such as the core exit and around the ACS. As this method needs a laser sheet
perpendicular to the camera, it was not possible to measure everywhere in the model due to optical obstacles. The IHX and the external pool steel bars disturb the measurements. The water flowing from the core was investigated based on three azimuth angles and water levels. The flow going out from the core is divided in two jets. One is crossing the ACS grid plate and it is deflected by the ACS bottom plate, the other one goes horizontally along the grid. Little differences are noted regarding the azimuth so that we can conclude the jet exiting from the core is not homogenous. At the opposite, the jet is equal whatever the water level. The flow around the ACS was analyzed using five azimuth angles and three water heads. A general trend is noticed for the flow going out from the ACS barrel holes. At the lowest ones, the jet goes horizontally, and at the highest ones, the jet flows down. Two techniques are used to calculate the flow rate across the ACS, by direct calculation around the ACS and by indirect calculation along the core jet. For the first one, we assumed the jets exiting the ACS barrel holes are axisymmetric. Measurements were performed twice at several locations to check the accuracy of this method. Few discrepancies are noticed, but the results are in the same range. By analyzing the flow rate across the ACS holes, we can conclude it is heterogeneous regarding the azimuth angle so that we advise to observe the exact design for
the CFD calculations. The second method to determine the flow rate crossing the ACS takes into account a balance of the flows around the core. The flow going out from the core is divided in two parts; one crosses the ACS, the other one is deviated by the ACS bottom plate. As the flow rate exiting from the core is set and measured by the PLATEAU loop, the ACS flow rate can be calculated from the flow rate of the jets deflected by the ACS. To obtain it, the velocity is considered axisymmetric and integrated between the ACS barrel edge and the core surface. The results are consistent with the analyses of the jets around the core as two azimuths exhibit the same flow rate. The comparison of the flow rate across the ACS calculated by these two methods shows very little difference, so that we can be confident on the results. The water level has no influence on the flow rate crossing the ACS. The flow rate ratio ASC/core is approximately 14% and only depends on the sheath tubes pressure losses.
The main conclusions of this study are:
• The jet going out from the core is heterogeneous but doesn’t change whatever the water level.
• The water crossing the ACS holes flows to different directions versus the elevation.
• The flow rate across the ACS is heterogeneous regarding the azimuth angle but is not influence by the water level.
• We recommend taking into account the exact design for the code calculations.
Other PIV measurements are ongoing regarding the free surface flow and will be presented in a next article.
NOMENCLATURE
DI Deionized
ASTRID Advanced Sodium Technological Reactor for Industrial Demonstration SFR Sodium Fast Reactor
EFR European Fast Reactor PIV Particle Image Velocimetry IHX Intermediate Heat Exchanger ACS Above Core Structure PMMA Polymethyl methacrylate
REFERENCES
1. P. Alphonse, J-L. Perrin, P. Gama, “Status of ASTRID architecture and pre-conceptual design”,
Proceedings of Fast Reactors and Related Fuel Cycles (FR13), Paris, March 4-7, 2013.
2. P. Dufour, C. Latge, L Gicquel, “Knowledge passing on in France in the perspective of ASTRID realization”, Proceedings of Fast Reactors and Related Fuel Cycles (FR13), Paris, March 4-7, 2013. 3. D. Guenadou, I. Tkatshenko and P. Aubert, “Plateau Facility in Support to Astrid and the SFR
Program: An Overview of the First Mock-Up of the Astrid Upper Plenum, MICAS”, Proceedings of
the16th International Topical Meeting on Nuclear Reactor Thermal Hydraulics (NURTEH16),
Chicago, Illinois, August 30-September 4, 2015.
4. D. Guenadou, P. Aubert, V. Biscay, M. Bottin, J-P. Descamps, “Study of the Free Surface Flow in the MICAS Mock-Up in Support of the ASTRID SFR Program”, Proceedings of The 11th International
Topical Meeting on Nuclear Reactor Thermal Hydraulics, Operation and Safety (NUTHOS-11),
Gyeongju, Korea, October 9-13, 2016.
5. D. Tenchine, “Some Thermal Hydraulic Challenges in Sodium Cooled Fast Reactors”, Nuclear
Engineering and Design, 240, pp. 1195-1217 (2010).
6. C. Spaccapaniccia, P. Planquart, J-M. Buchlin, M. Greco, F. Mirelli, K. Van Tichelen, “Experimental Results from a Water Scale Model for the Thermal-Hydraulic Analysis of a HLM Reactor”,
Proceedings of the16th International Topical Meeting on Nuclear Reactor Thermal Hydraulics (NURTEH16), Chicago, Illinois, August 30-September 4, 2015 pp 2182-2195 (2015).
7. N. Kimura, K. Hayashi, H. Kamide, M. Itoh, T. Sekine, “Experimental Study on Flow Optimization in Upper Plenum of Reactor Vessel for a Compact Sodium-Cooled Fast Reactor”, Nuclear