HAL Id: hal-02442280
https://hal-cea.archives-ouvertes.fr/hal-02442280
Submitted on 16 Jan 2020
HAL is a multi-disciplinary open access
archive for the deposit and dissemination of
sci-entific research documents, whether they are
pub-lished or not. The documents may come from
teaching and research institutions in France or
abroad, or from public or private research centers.
L’archive ouverte pluridisciplinaire HAL, est
destinée au dépôt et à la diffusion de documents
scientifiques de niveau recherche, publiés ou non,
émanant des établissements d’enseignement et de
recherche français ou étrangers, des laboratoires
publics ou privés.
Study on neutron scattering in light water
J. Scotta, I. Damian, G. Noguère, D. Bernard
To cite this version:
J. Scotta, I. Damian, G. Noguère, D. Bernard. Study on neutron scattering in light water. WONDER
2015 - 4
th International Workshop on Nuclear Data Evaluation for Reactor Applications, Oct 2015,
Aix-En-Provence, France. �hal-02442280�
Juan Pablo Scotta1a, Ignacio Marquez Damian2, Gilles Noguere1, and David Bernard1
1
SPRC/LEPh, CEA Cadarache, F-13108 Saint-Paul-Lez-Durance, France 2
Neutron Physics Department, Centro Atomico Bariloche, Argentina
Abstract. It is presented a method to produce covariance matrices of the light water total cross
section from thermal scattering laws of the JEFF-3.1.1 nuclear data library and CAB model. The generalized least square method was used to fit the LEAPR module parameters of the processing tool NJOY with light water experimental transmission measurements at 293.6K with CONRAD code. The marginalization technique was applied to account for systematic uncertainties.
1. Introduction
The probability of an incident neutron with energy and solid angle (E;Ω) of scattering a light water molecule and being emitted at a different energy and different solid angle (E';Ω') can be expressed with the double differential scattering cross section:
( )
α β π σ σ β , ' 4 ) ' , ' ( 2 2 S e E E kT E E dE d d b − = Ω → Ω → Ω(1)
where σb is the characteristic bound cross section of the material, T is the temperature and k is the
Boltzmann constant.
The double differential cross section depends on the thermal scattering law function S(α,β), where α and β are the dimensionless momentum and energy transfer respectively:
AkT E E E E θ α= '+ −2 ' cos ; kT E E− = ' β (2) where cos θ is the cosine of the scattering angle in the laboratory system and A is the ratio between the mass of the scattering molecule and the neutron mass.
EPJ Web of Conferences
In order to evaluate the function S(α,β) some approximations are often used: the incoherent and the Gaussian approximation. The processing of the thermal scattering law is done with LEAPR module of NJOY code [1], and is computed with these approximations.
The main parameter that defines the dynamics of the function S(α,β) is the frequency spectrum of the material, which defines its excitation states. When using LEAPR module, the frequency spectrum is a resultant of three different components: a solid type spectrum, a translational spectrum and discrete oscillators.
2. Models for H into H2O
It will be presented two different models that describe the frequency distribution of H into H2O.
The first one is IKE model, developed by M. Mattes and J. Keinert [2]. It is based on experimental frequency spectrum measured by B. C. Haywood and D. I. Page [3]. The rotational mode of hydrogen bound to the water molecule is represented by a solid type spectrum with a weight wR. Two discrete
oscillators, with energies E1 and E2, define the intra-molecular modes of vibration (bending and
stretching modes), with corresponding weight w1 and w2. Finally, an effective mass describes the
molecular clustering effect of the water molecule with a weight wt. The sum of all the weights must be
equal to unity.
The nuclear data library JEFF-3.1.1 adopted this model in its database. Table 1 resumes the LEAPR parameters of this model at 293.6K.
The second model, CAB model, was calculated by I. Marquez Damian [4] and is based on molecular dynamic simulations with GROMACS code. It was obtained an equivalent model to IKE model but the translational mode was replaced by the diffusional model of Egelstaff-Schofield [5] to better describe low energy dynamics. The key parameter in this model is the diffusion constant c. Table 1 resumes the LEAPR parameters of CAB model at 293.6K.
Figure 1 compares the frequency spectrum for IKE model (used in the JEFF-3.1.1 nuclear data library) and CAB model at 293.6K.
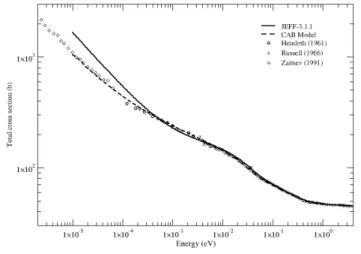
The total cross section is obtained integrating equation (1) in all emitted neutron energies and solid angles. It was computed for JEFF-3.1.1 library and CAB model at 293.6 K. Figure 2 compares them with experimental data [6- 8].
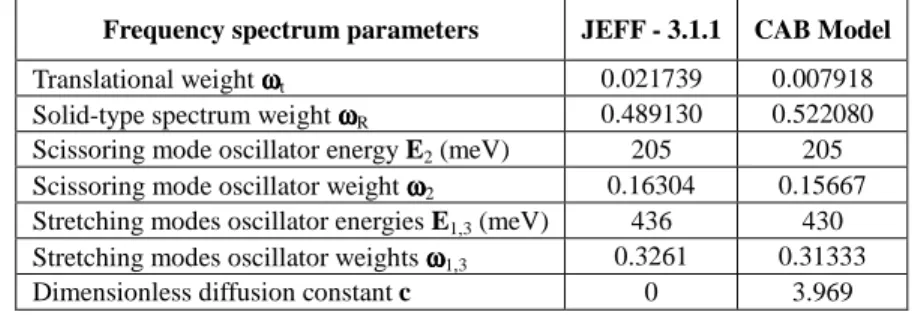
Tab. 1. IKE and CAB model parameters of H into H2O at 293.6K for the LEAPR module of NJOY.
Frequency spectrum parameters JEFF - 3.1.1 CAB Model
Translational weight ωωωωt 0.021739 0.007918
Solid-type spectrum weight ωωωωR 0.489130 0.522080
Scissoring mode oscillator energy E2 (meV) 205 205
Scissoring mode oscillator weight ωωωω2 0.16304 0.15667
Stretching modes oscillator energies E1,3 (meV) 436 430
Stretching modes oscillator weights ωωωω1,3 0.3261 0.31333
Fig. 1. Frequency spectrum for JEFF-3.1.1 and CAB model at 293.6 K.
Fig. 2. Total cross section for JEFF-3.1.1 and CAB model, at 293.6 K.
3. Covariance matrices of differential and total cross section
3.1 Governing equations
In this work, the full covariance matrix between the model parameters is defined as follow:
Σ Σ Σ Σ = Σ 22 21 12 11 (3)
where each element of the matrix is obtained by:
(
)
1(
)
1 11 − − + = Σ x T x x T T x x T x x G G G G M G G G G M θ θ θ (4) G G GTGθMθ x x T x 1 12 ( ) − − = Σ (5)EPJ Web of Conferences
Σ22=Mθ (6)
in which Mx stands for the covariance matrix between the best-fit values of the model parameter and
Mθ represents the covariance matrix between the nuisance parameters that account systematic uncertainties. The nuisance parameters included in the present study were the normalization and the background. In our context, the model parameter vector x and the nuisance parameter vector θ are: x=(c,ωt,ωR,∆,E1,E2,ω1,ω2) → ; =(N,B) → θ (7)
The matrices Gx and Gθ correspond to the derivatives of the calculated quantity z to the model and the
nuisance parameters respectively:
=
∂ ∂ ∂ ∂ ∂ ∂ ∂∂ ∂∂ ∂ ∂ ∂ ∂ ∂ ∂ ∂ ∂ 2 2 2 2 2 2 1 1 1...
...
...
...
ω ω ω ω ω ω k t k k t t z z c z z z c z z z c z xG
M
M
M
;
=
∂ ∂ ∂ ∂ ∂ ∂ ∂ ∂ ∂ ∂ ∂ ∂ B z N z B z N z B z N z k kG
M
M
2 2 1 1 θ (8)To calculate the covariance matrices of the total cross sections CONRAD code [9] was used. The Generalized Least Square method (GLS) was used in association with the marginalization technique in which the zero variance penalty condition accounts for systematic uncertainties [10].
The “best estimates values” of the LEAPR module parameters were obtained from water transmission experimental measures.
3.2 Sensitivity analysis of the model parameters
A sensitivity analysis of the LEAPR module parameters to the H2O transmission at 293.6 K was done.
Their sensitivity as a function of the incident neutron energy is plotted in figure 3 for the H2O
transmission calculated with CAB model.
The parameters ωR and ∆ are one order of magnitude more sensitive to the transmission than the rest.
This highlights the relevance of the continuous part of the frequency spectrum, described by these two parameters. Their anticorrelation suggests that only one of them should be taken into account in the marginalization technique.
The parameters c and ωt follow an equivalent trend because they are physically correlated. The
parameters not included in figure 3 (E1, E2, ω1 and ω2) have a negligible sensitivity. Their
Fig. 3. Sensitivity (in %/%) of the LEAPR model parameters to the H2O transmission as a function of the energy
calculated with CAB model.
3.3 Results
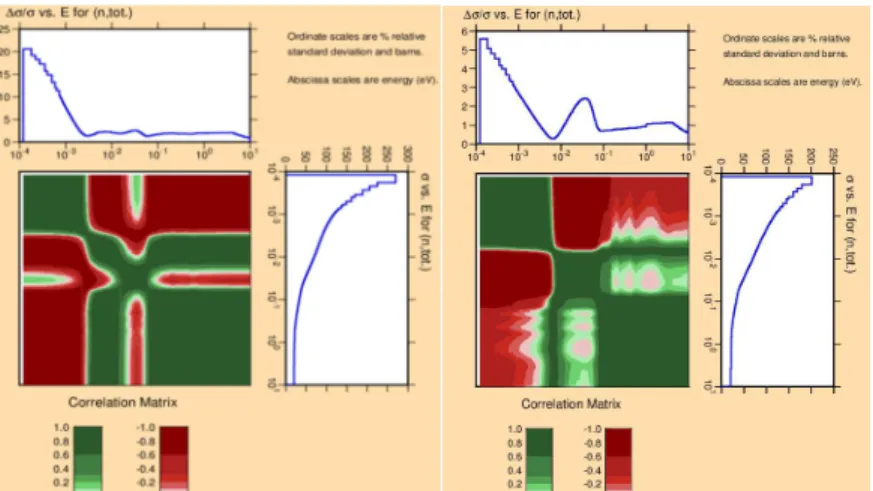
According to our sensitivity analysis, the uncertainty on the total cross section is mainly driven by the parameters ∆ and ωt. The relative uncertainties and the correlation matrices of the total cross section
for JEFF-3.1.1 and CAB model at 293.6 K are shown in figure 4.
In the cold neutron energy range, below 10-3 eV, the uncertainty associated to JEFF-3.1.1 is larger than the uncertainty associated to CAB. This is explained by the better agreement of the CAB model with the low energy total cross section measurements.
Around 5 meV, the uncertainty found for CAB model is low. Additional work is needed for improving this underestimated magnitude.
Above the thermal energy, the relative uncertainties remain lower than 2%. The main contribution is related to the 1H free atom cross section whose uncertainty is lower than 1% [11].
Fig. 4. Relative uncertainties and correlation matrices of the total cross section for JEFF-3.1.1 (left) and CAB
EPJ Web of Conferences
4. Conclusions
The covariance matrices of the light water total cross sections from thermal scattering laws of JEFF-3.1.1 nuclear data library and CAB model were obtained by using CONRAD code. In the cold neutron energy range, differences in the relative uncertainties between both models are important. The uncertainties associated to JEFF-3.1.1 are larger because the agreement with the low energy total cross section is poor.
Present work is being done to propagate uncertainties due to the thermal scattering laws to integral calculations. Preliminary calculations performed on MOX fuel provide uncertainties on the multiplication factor ranging from 100 pcm with the CAB model to 200 pcm with JEFF-3.1.1.
The next step would be to determine uncertainties on the water potential parameters used in the molecular dynamic simulation code GROMACS, in order to obtained directly uncertainties on the frequency spectrum introduced in LEAPR module.
References
1. R.E. MacFarlane and A.C. Kahler, Nucl. Data Sheets 111, 2729 (2010).
2. M. Mattes and J. Keinert, “Thermal Neutron Scattering Data for the moderator Materials H2O, D2O and ZrHx in ENDF-6 Format and as ACE Library for MCNP(x) Codes”, International Atomic Energy Agency, INDC(NDS)-0470, 2005.
3. D.I. Page, B.C. Haywood, “The Harwell scattering law program: frequency distributions of moderators”, Harwell Report AERE-R 5778, 1968.
4. J. I. Marquez Damian et al, Ann. Nucl. Ener. 65, 280 (2014). 5. P.A. Egelstaff and P. Schofield, Nucl. Sci. Eng. 12, 260 (1962).
6. J.L. Russell Jr., J.M. Neill and J.R. Brown, “Total cross section measurements of H2O”, General Atomic Report GA-7581, 1966.
7. K.N. Zaitsev, V.N. Petrov, S.P. Kuztnesov, O.A. Langer, I.V. Meshkov, A.D. Perekrestenko, Sov. At. Energy 70, 238 (1991).
8. K. Heinloth, Z. Phys. 163, 218 (1961).
9. C. De Saint Jean et al., “CONRAD, a new software for nuclear data analysis”, Nuclear Energy Agency, JEFFDOC-1142, 2006.
10. G. Noguere, P. Archier and C. De Saint Jean, Nucl. Sci. Eng. 172, 164 (2012). 11. S. Mughabghab, “Atlas of Neutron Resonance”, Elsevier, 2006.