HAL Id: inserm-00848065
https://www.hal.inserm.fr/inserm-00848065
Submitted on 25 Jul 2013
HAL is a multi-disciplinary open access
archive for the deposit and dissemination of
sci-entific research documents, whether they are
pub-lished or not. The documents may come from
teaching and research institutions in France or
abroad, or from public or private research centers.
L’archive ouverte pluridisciplinaire HAL, est
destinée au dépôt et à la diffusion de documents
scientifiques de niveau recherche, publiés ou non,
émanant des établissements d’enseignement et de
recherche français ou étrangers, des laboratoires
publics ou privés.
Immune deficiency could be an early risk factor for
altered insulin sensitivity in antiretroviral-naive
HIV-1-infected patients: the ANRS COPANA cohort.
Faroudy Boufassa, Cécile Goujard, Jean-Paul Viard, Robert Carlier,
Bénédicte Lefebvre, Patrick Yeni, Olivier Bouchaud, Jacqueline Capeau,
Laurence Meyer, Corinne Vigouroux
To cite this version:
Faroudy Boufassa, Cécile Goujard, Jean-Paul Viard, Robert Carlier, Bénédicte Lefebvre, et al..
Im-mune deficiency could be an early risk factor for altered insulin sensitivity in antiretroviral-naive
HIV-1-infected patients: the ANRS COPANA cohort.. Antiviral Therapy, International Medical
Press, 2012, 17 (1), pp.91-100. �10.3851/IMP1916�. �inserm-00848065�
sensitivity in antiretroviral-naïve HIV-1-infected patients: the ANRS COPANA cohort
Running head:
Immune deficiency and insulin resistance in untreated HIV infection
F. Boufassa,1 C. Goujard,1,2 JP. Viard,3 R. Carlier,4 B. Lefebvre,5 P. Yeni,6 O. Bouchaud,7 J. Capeau,8,9,10 L. Meyer,1 and C. Vigouroux,8,9,10 for the ANRS COPANA
Cohort Study Group*
1 Equipe "VIH et IST", Centre de Recherche en Epidémiologie et Santé des
Populations (CESP), INSERM U1018; Univ Paris-Sud 11, Faculté de Médecine; Service d’Epidémiologie et de Santé Publique, Hôpital Bicêtre, AP-HP, Le Kremlin Bicêtre, France
2 Service de Médecine Interne, Hôpital Bicêtre, AP-HP, Le Kremlin Bicêtre, France 3 Centre de Diagnostic et de Thérapeutique, Hôpital Hôtel Dieu, AP-HP, Paris,
France
4 Service de Radiologie et Imagerie Médicale, Hôpital Raymond Poincaré, AP-HP,
Garches, France
5 Service des Maladies Infectieuses, Hôpital Saint Antoine, AP-HP, Paris, France 6 Service des Maladies Infectieuses, Hôpital Bichat, AP-HP, Paris, France
7 Service des Maladies Infectieuses, Hôpital Avicenne, AP-HP, Bobigny, France 8 INSERM, CDR Saint-Antoine, U938, Paris, France
9 UPMC Univ Paris06, UMR_S938, Paris, France
10 Service de Biochimie et Hormonologie, Hôpital Tenon, AP-HP, Paris, France
* See appendix
Corresponding author:
Corinne Vigouroux, INSERM U938, Equipe Capeau, Faculté de médecine Pierre et Marie Curie, Site St Antoine, 27 rue Chaligny, 75012 Paris, France
Abstract
Background: The relationships between immunovirological status, inflammatory
markers, insulin resistance and fat distribution have not been studied in recently diagnosed (<1 year) antiretroviral-naïve HIV-1-infected patients.
Methods: We studied 214 antiretroviral-naïve patients at enrolment in the
metabolic sub-study of the ANRS COPANA cohort. We measured clinical, immunovirological and inflammatory parameters, glucose/insulin during oral glucose tolerance test (OGTT), adipokines, subcutaneous and visceral fat surfaces (SAT and VAT, assessed by computed tomography) and the body fat distribution based on dual-energy X-ray absorptiometry (DEXA).
Results: Median age was 36 years; 28% of the patients were female and 35% of
sub-Saharan origin; 20% had low CD4 counts (!200/mm3). Patients with low CD4 counts were older and more frequently of sub-Saharan Africa origin, had lower BMI but not different SAT/VAT ratio and fat distribution than other patients. They also had lower total, LDL- and HDL-cholesterolemia, higher triglyceridemia and post-OGTT glycemia, higher markers of insulin resistance (insulin during post-OGTT and HOMA-IR) and of inflammation (hsCRP, IL-6, TNF", sTNFR1 and sTNFR2). After adjustment for age, sex, geographic origin, BMI and waist circumference, increased insulin resistance was not related to any inflammatory marker. In multivariate analysis, low CD4 count was an independent risk factor for altered insulin sensitivity (
#-
coefficient for HOMA-IR: +0.90; p=0.001; CD4>500/mm3 as the reference), inaddition to older age (
#:
+0.26 for a 10-year increase; p=0.01) and higher BMI (#:
+0.07 for a 1-kg/m2 increase; p=0.003).Conclusions: In ART-naive patients, severe immune deficiency but not
Introduction
Highly active antiretroviral therapy (ART) has markedly improved the prognosis of HIV infection. In industrialized countries, where HIV infection is generally well-controlled and routinely managed as a chronic disease, morbidity and mortality are increasingly unrelated to AIDS [1] and cardiovascular and metabolic complications represent emerging challenges in the management of HIV-infected patients [2].
Several studies have shown that ART is independently associated with metabolic and cardiovascular diseases [3-8]. However, chronic HIV infection itself also contributes to cardiovascular risk [9-11], with both immune deficiency and immune activation probably playing important roles [12, 13]. In addition, several reports suggested that low CD4 count during HIV infection could be independently associated with diabetes [3, 5, 14, 15]. Brown et al. have recently revealed that systemic low-grade inflammation under ART, but not before treatment initiation, was a risk factor for incident diabetes [16]. Interestingly, in this study, low CD4 count before ART was also associated with incident diabetes under treatment. As insulin resistance is probably the first event leading to the development of diabetes in HIV-infected patients under ART [8, 17], we found of high pathophysiological interest to search for the risk factors for altered insulin sensitivity in HIV-infected patients before ART initiation. A few studies have addressed this point [18, 19], but have not assessed the possible relationships between inflammatory markers before ART and the risk of insulin resistance or diabetes.
In this work, we used data collected from antiretroviral-naive patients, enrolled in the metabolic sub-study of the multicentre ANRS COPANA cohort study, to search for relationships between immunovirological, anthropometric, imaging, metabolic and inflammatory parameters. Our results show that the immune deficiency associated with HIV infection could be an early contributing factor to altered insulin sensitivity, independently of inflammatory markers and in the absence of body fat redistribution.
Patients and methods Patients
The main objective of the ongoing ANRS COPANA cohort is to prospectively evaluate the impact of HIV infection and ART on morbidity and mortality in recently diagnosed (<1 year) HIV-1-infected ART-naïve adults, in France. The Paris-Cochin Ethics Committee approved the study protocol and all the participants gave their written informed consent.
Demographic, clinical and biological data were collected at enrolment and every year thereafter. In 21 of the 38 participating centres, all eligible patients were also invited to enter a metabolic sub-study comprising a 75g oral glucose tolerance test (OGTT), performed after a fasting period of at least 8h, with blood sampling at T0 and T120 min, centralized assays of inflammatory markers, insulin and adipokines, computed tomography (CT) at the level of the L4 vertebra and dual-energy X-ray absorptiometry (DEXA).
Among the 800 patients enrolled in the COPANA cohort, 214 joined the metabolic sub-study and were considered for the present analyses.
Methods
Blood pressure and physical characteristics (height, weight, waist and hip circumferences) were measured at enrolment. The country of birth, sexual preference, and the personal history of AIDS-defining illnesses, cardiovascular disease and diabetes were recorded. T0 (fasting) and T120 min post-charge samples were collected during OGTT. Fasting total, HDL- and LDL-cholesterol, triglycerides and glucose were measured with standard procedures. CD4 and CD8 lymphocyte counts and plasma HIV-1 RNA viral load were routinely measured, and the patients were tested for hepatitis B virus surface antigen and for antibodies to hepatitis C virus in each participating centre.
Cryopreserved serum was used for centralized measurements at Tenon Hospital Biochemistry Department. Insulin was measured with a method avoiding cross-reactivity with proinsulin (ARCHITECT system, Abbott, USA) at T0 and T120 min of
the OGTT. Homeostasis model assessment of insulin resistance (HOMA-IR) and insulin secretion (HOMA-B, reflecting pancreatic !-cell function) values were calculated as follows: [HOMA-IR = (T0 insulin (mU/L) x T0 glucose (mmol/L) / 22.5] and [HOMA-B = (20 x T0 insulin) / (T0 glucose - 3.5)] [20]. Diabetic status was recorded on the basis of self-reported diabetes confirmed by the physician, regular use of anti-diabetic medication, fasting glucose " 7 mmol/L and/or T120 glucose " 11.1 mmol/L. Impaired glucose tolerance was defined, in the absence of diabetes, by T120 glucose above 7.8 mmol/L [21]. The most recent definition of the metabolic syndrome was used [22]. High-sensitivity C-reactive protein (hsCRP) was determined by nephelometry on an IMMAGE analyser (Beckman-Coulter, Villepinte, France). Serum total adiponectin, leptin, interleukin-6 (IL-6), monocyte chemoattractant protein-1 (MCP-1), tumor necrosis factor alpha (TNF") and its soluble receptors sTNFR 1 and 2 were measured with multiplexed bead-based immunoassays (Linco Research Inc., St Charles, MO, USA and BioSource International Inc., Camarillo, CA, USA), with respective detection limits of 145.6, 85.4, 1.6, 0.14, 0.14, 15 and 15 pg/mL, on a Bio-Plex 200 system (Bio-Rad laboratories Inc., Hercules, CA, USA) using Bio-Plex Manager TM 3.0 software. Subcutaneous and visceral adipose tissue surface areas (SAT and VAT) were calculated for 139 patients, in the same radiological centre, from 1-cm reconstructed slices of abdominal L4 CT scans, using an Extended Brilliance workstation and QCTA software (EBW, QCTA, Philips Medical Systems, Eindhoven, The Nederlands). DEXA was performed in 102 patients using Lunar Prodigy (GE Medical Systems, Madison, WI) or Hologic (Hologic, Inc., Bedford, MA) densitometers, the same device being always used for a given patient, and percentages of total, trunk and limb fat were recorded.
Statistical analyses
SAS software version 9.1 (SAS Institute, Cary, North Carolina) was used for all analyses. To investigate the impact of immune deficiency on metabolic parameters, the patients were categorized into four groups according to their CD4 counts at
enrolment: !200 (“low CD4”); 201-350; 351-500 and >500/mm3. Continuous variables are reported as medians and 25th to 75th percentiles (inter quartile range, IQR), and categorical variables as percentages. Non parametric Kruskal-Wallis tests were used to compare continuous variables and the chi-squared or Fisher’s test was used for categorical variables. All comparisons of anthropometric measurements were adjusted for sex by using multiple logistic or linear regression models (Tables 1 and 2); p values were those estimated from the Wald test values. Pearson correlation and partial correlation coefficients were used to estimate the correlations between continuous variables, with and without adjustment for age, sex, body mass index (BMI), waist circumference, SAT, VAT and geographic origin. Alternative models using percentage of total fat instead of BMI, or trunk and limb fat instead of waist circumference, were also tested. Several multivariate linear regression models were also used to examine the relations between each insulin resistance marker (HOMA-IR, T0 and T120 insulin) as the dependent variable and age, sex, BMI, geographic origin, and CD4 count or HIV RNA level (CD4 count and HIV RNA levels could not be entered simultaneously in the model, as too few patients had both low CD4 count and low viral load); the p values are those estimated from the Wald test values by the SAS GLM.
Results
Baseline characteristics (Table 1)
214 patients were studied less than one year after HIV diagnosis (median 4.7 months) and before any ART. Median age at inclusion was 36 years [IQR: 31-42]; 28% were women (n=60); 75 patients (35%) originated from sub-Saharan Africa and 102 (48%) from European countries. Most patients (97%) had been infected by the sexual route, and 51% defined themselves as heterosexual. Twenty-five patients (12%) presented with a previous AIDS-defining event (tuberculosis in 9 cases) at the time of HIV diagnosis. The median CD4 count was 398/mm3 [248-551], and 20% of the patients (n=42) had low CD4 (!200/mm3). The median HIV-1 RNA level was 4.4 log10 copies/mL [3.8-4.9]. The prevalence of HBV and HCV
infection was low (4.6% and 3.8%, respectively). One patient, no longer a current user, reported a history of opiate use.
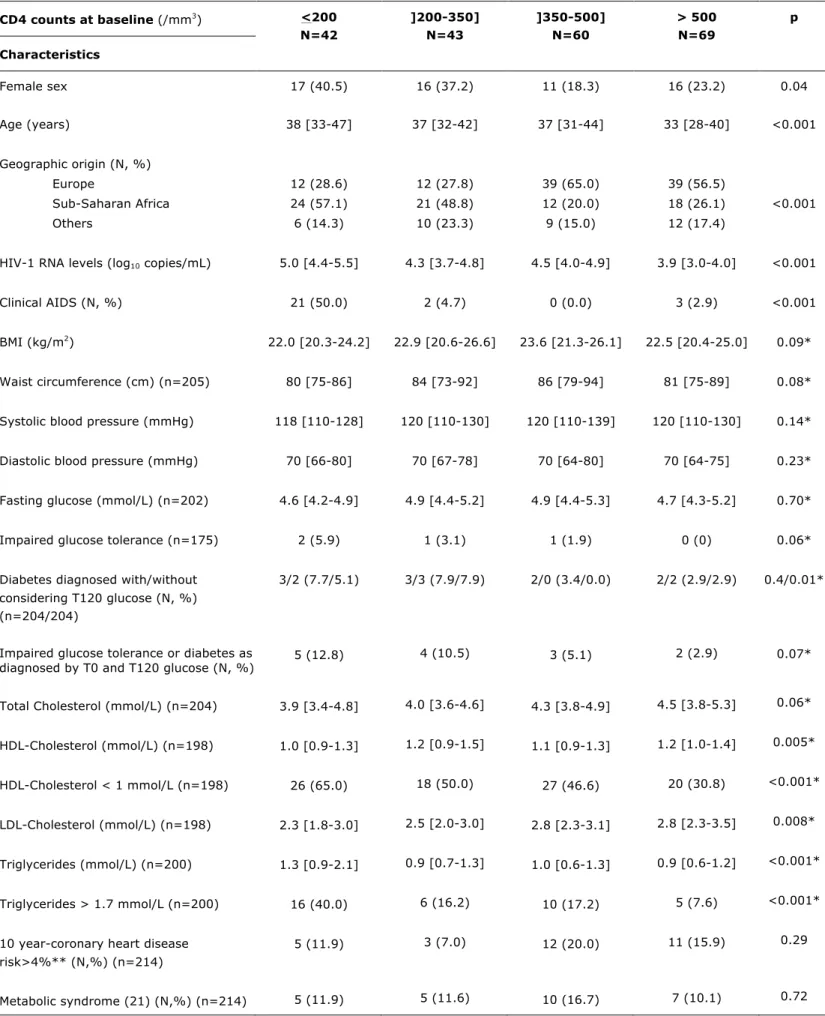
Table 1 shows the patients’ characteristics according to their baseline CD4 counts. As expected, HIV RNA levels were significantly higher and previous AIDS-defining events more frequent in patients with low CD4 (!200/mm3). Lower CD4 count was
associated with older age, female sex and sub-Saharan Africa origin (p<0.001, =0.05 and =0.001, respectively), tended to be associated with lower BMI and waist circumference (p=0.07 and 0.08, respectively), but not with HCV co-infection. When considering patients with CD4 !200/mm3, their BMI was significantly lower than that of other patients (22.0 versus 22.9 kg/m2, p adjusted for sex = 0.02). As expected, the fasting glucose level and the prevalence of glucose tolerance abnormalities (i.e. impaired glucose tolerance or diabetes) were significantly related to age, BMI and waist circumference (all p values <0.001). In addition, when considering both T0 and T120-post OGTT glucose, the prevalence of impaired glucose tolerance or diabetes tended to be increased, although not significantly, in patients with lower CD4 counts (p adjusted for sex = 0.07).
Lower cholesterol and higher triglyceride levels associated with lower CD4 counts and higher viral load
Total, HDL- and LDL-cholesterol levels correlated positively with CD4 counts (r=+0.21, +0.14 and +0.24; p=0.002, =0.05 and <0.001) and negatively with the HIV RNA level (r=-0.21, -0.32, and -0.19; p=0.003, <0.001, and =0.007, respectively), these associations being maintained after adjustment for BMI. The reverse situation was observed for triglycerides levels that were negatively related to the CD4 count and positively to the viral load (r=-0.23 and +0.18, p=0.001 and =0.01). In addition, triglyceride levels were related to markers of insulin resistance, fasting insulin, and HOMA-IR (r=+0.32 and +0.30, respectively; p<0.0001). Otherwise triglycerides levels were related to inflammatory markers (hsCRP, MCP-1, TNF", sTNFR1 and IL-6; respectively r=+0.17, +0.23, +0.23, +0.18 and +0.17; p=0.02, 0.003, 0.002, 0.02 and 0.03). Levels of triglycerides and total, LDL- and
HDL-cholesterol were not related to the geographic origin. The correlation between triglyceride and CD4 counts remained significant after adjustment for fasting insulin, hsCRP, MCP-1, TNF", sTNFR1 or IL-6. Therefore, cholesterol values were decreased in situation of immune deficiency while increased triglycerides were independently associated with markers of immune deficiency and of insulin resistance.
Insulin resistance markers were negatively related to the CD4 count
We observed no significant difference in fasting or T120 post-OGTT glycemia across the CD4 count subgroups (Table 2). However, when patients with CD4 counts !200/mm3 were compared to other patients, their T120 post-charge glycemia was significantly increased (median 5.3 versus 5.0 mmol/L, p adjusted for sex = 0.04). In addition, although patients with CD4 !200/mm3 were leaner than other patients, they had significantly higher insulin resistance markers: median values of T0 insulin, 6.6 vs 5.0 mU/L (p=0.03), of T120 insulin, 33.3 vs 15.0 mU/L (p<0.001) and of HOMA-IR, 1.4 vs 1.0 (p=0.02). HOMA-B, a marker of insulin secretion, was also significantly higher in patients with low CD4 counts.
Serum levels of leptin and adiponectin did not differ according to the CD4 count. As expected, leptin levels correlated positively with BMI, TAT (total adipose tissue, i.e. SAT plus VAT), percentage of total fat, and fasting insulin (r=+0.49, +0.27, +0.70 and +0.17; p<0.001, =0.003, <0.001, =0.03, respectively). In addition, adiponectin correlated negatively with fasting insulin (r=-0.19; p=0.02) and VAT (r=-0.20; p=0.05) and positively with HDL-cholesterol (r=+0.18; p=0.03).
Body fat distribution was assessed by measurements of SAT and VAT (on L4-CT scan), and percentage of total, tru nk and limb fat (from DEXA). Although patients with CD4 !200/mm3 as compared to those with >200/mm3 had lower BMI, their body fat segmental distribution assessed by the ratios SAT/VAT, percentage of limb or trunk/total fat, was not different (data not shown).
In addition, patients of sub-Saharan Africa origin had or tended to have higher levels of insulin resistance markers T0 or T120 insulin, and HOMA-IR than the other
patients (beta coefficients: +2.1, +8.37 and +0.42 ; p=0.01, 0.02 and 0.06, respectively). However, geographic origin was not associated with impaired glucose tolerance and/or diabetes.
After adjustment for age, sex, BMI, waist circumference and geographic origin, the insulin resistance markers (T0 and T120 insulin and HOMA-IR) remained negatively correlated with CD4 counts. Using alternative models with adjustments for percentage of total fat instead of BMI (or for percentage of trunk and limb fat, or SAT and VAT, instead of waist circumference) led to similar conclusions.
We also considered HIV RNA levels instead of CD4 counts: after similar adjustments, HIV RNA levels correlated with T0 insulin (r=+0.23; p=0.009) but not significantly with HOMA-IR or T120 insulin (p=0.06 and 0.17, respectively). Finally, HCV and HBV infection were not related to insulin resistance markers.
Inflammatory markers were increased in patients with low CD4 counts but were not related to altered insulin sensitivity
IL-6, TNF", sTNFR1, sTNFR2 (Table 3) and hsCRP levels (p=0.03) were significantly higher in patients with low CD4 counts than in patients with higher counts. Each of these inflammatory markers was correlated with the others (r: 0.18 to 0.39, p<0.0001 to 0.04), except IL-6 which did not correlate with sTNFR2.
We thus wondered if the association between increased insulin resistance and low CD4 counts might be related to HIV-induced inflammation or active infection. We found no significant correlation between markers of inflammation and markers of insulin resistance. When the analysis was restricted to patients with hsCRP levels below 10 mg/L or to patients without clinical AIDS, T0 and T120 insulin and HOMA-IR remained negatively correlated with CD4 counts, and still not with the tested inflammatory markers.
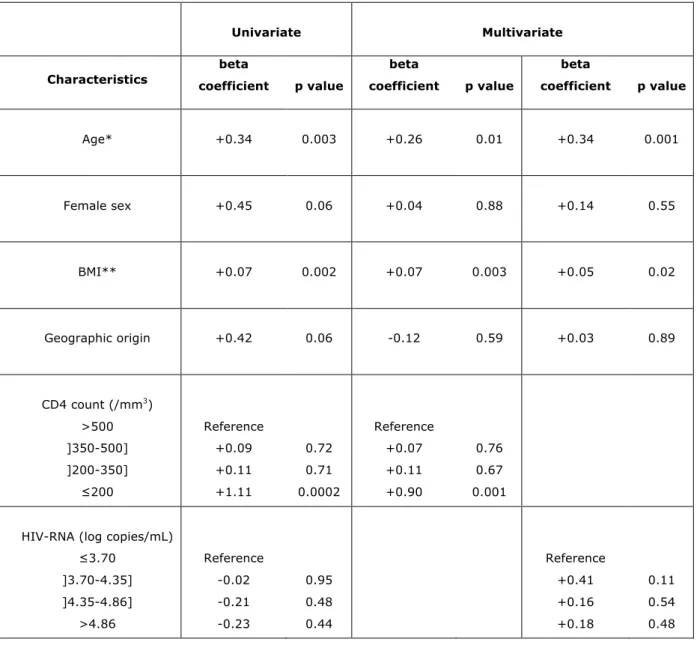
In the final multiple linear regression model, higher age, higher BMI and low CD4 counts were independently associated with increased insulin resistance, as represented by HOMA-IR (Table 4). The same relationships were observed when
considering other markers of insulin resistance such as T0 or T120 insulin, or when the analysis was restricted to patients without AIDS. Further adjustment for hsCRP, leptin and adiponectin, and triglycerides did not modify these results.
In addition, in multiple regression analysis, when patients with #100 CD4/mm3 (n=18) were differentiated from patients with 101-200 CD4/mm3 (n=24), we found that HOMA-IR was increased by +1.41 (p=0.0003) in patients with #100 CD4/mm3
and by +0.82 (p=0.03) in patients with 101 to 200 CD4, compared with patients with more than 500 CD4/mm3. Although the pair-wise analysis did not evidence a significant difference between patients with #100 CD4/mm3 and patients with 101-200 CD4/mm3, this result confirmed that patients with low or very low CD4 count are at increased risk of insulin resistance.
In order to compare the effect-sizes of the three independent predictors of insulin resistance observed in this study, i.e. increased age, increased BMI, and low CD4 count, we categorized age and BMI into four classes (#31, ]31-37], ]37-41] and >41 years old, and #19, ]19-25], ]25-30] and >30 kg/m2, respectively), with #31 years old and ]19-25] kg/m2 as references. Patients aged ]31-37], ]37-41] and >41 years had an increased HOMA-IR by +0.19, +0.11 and +0.81, respectively, whereas patients with BMI of [25-30[ and >30 kg/m2 had an increased HOMA-IR by
+0.48 and +0.76, respectively. Therefore, the effect-size of CD4 count below 200 CD4/mm3 was higher (+1.11, Table 4) than that of the two other independent predictors of insulin resistance.
Discussion
The ANRS COPANA cohort of 800 patients living in France, with a recent diagnosis of HIV-1 infection and no antiretroviral exposure, is designed to examine relationships between HIV infection and subsequent metabolic disorders. In the 214 patients enrolled in the metabolic sub-study, we evaluated insulin resistance and inflammatory markers, adipokines, and body fat amount and distribution. Our most striking finding is the correlation between immune deficiency and decreased insulin sensitivity in ART-naïve patients, independently of the amount and distribution of
body fat, and of systemic inflammation markers.
Many studies have shown that insulin resistance is increased in ART-treated HIV-infected patients and plays an important role in the pathogenesis of diabetes (reviewed in [8, 17]). Risk factors for altered insulin sensitivity are those found in the general population (increased BMI, visceral fat or age), but also factors linked to ART, lipodystrophy, or HIV/HCV co-infection. Low current or nadir CD4 count has also been associated with an increased risk of insulin resistance [23] or diabetes [3, 5, 14, 15] in ART-treated patients, suggesting that HIV infection itself could modulate insulin sensitivity. However, confounding factors, including use of more diabetogenic ART in more severely affected patients, or disordered T-cells cytokine expression due to immune activation or reconstitution leading to increased inflammatory markers could not be excluded [3, 23]. Indeed, a subclinical inflammatory state has been shown to increase the risk of type 2 diabetes in the general population [24]. Therefore, searching for relationships between HIV-related factors, including inflammatory markers, and insulin sensitivity in ART-naïve patients is of important pathophysiological interest.
Only two papers, both analysing data from the metabolic sub-study of the Community Program for Clinical Research on AIDS in the United States, have described the effects of HIV disease, before ART, on insulin sensitivity and glucose homeostasis [18, 19], one of them specifically studying the role of HCV co-infection [19]. An association between low CD4 counts and altered insulin sensitivity in ART-naïve patients was found, but relationships with inflammatory markers and body fat amount and distribution have not been evaluated [18]. HOMA-IR was higher in this study than in our report (mean 2.2 ± 2.2 versus 1.5 ± 1.5) which could be explained by different characteristics of the patients, including a more severe state of immune deficiency, a higher prevalence of HCV infection [19] and of previous opiate use and a slightly higher BMI.
In addition, we show here that the association between immune deficiency and altered insulin sensitivity was not related to a change in the amount or distribution of body fat, or to the studied inflammatory markers (hsCRP, IL-6, MCP-1, TNF",
sTNFR1 and sTNFR2). Indeed, although increased BMI is a well-known risk factor for insulin resistance, patients with CD4!200/mm3 were leaner than the other patients. In addition, their body fat was not differently distributed, and their SAT/TAT and SAT/VAT ratios were similar to those observed elsewhere in HIV-uninfected individuals [25, 26]. Moreover, after adjustment for age, sex, BMI, waist circumference and geographic origin, all of which can modulate insulin sensitivity, we still found a correlation between insulin resistance markers (T0 and T120 insulin, and HOMA-IR) and low CD4 counts, whereas HIV RNA load only correlated with T0 insulin. We also assessed inflammatory markers and serum adipokines, the latter being known to modulate insulin sensitivity both in the general population and in HIV-infected lipodystrophic patients [27, 28]. As expected, leptin correlated positively and adiponectin negatively with fasting insulinemia in our patients, who were not lipodystrophic, while immune deficiency was associated with systemic inflammation. However, we found no relationship between markers of insulin resistance and of inflammation in this cohort, even when the analyses were restricted to patients with only low-grade inflammation or without clinical AIDS. This result is important, since the occurrence of opportunistic or intermittent infections, in the context of immune deficiency, could induce metabolic changes. However, interestingly, in the early 1990s, before the multitherapy era, ten patients with AIDS did not present severe insulin resistance [29]. Opiate use and HCV infection have been associated with insulin resistance and/or diabetes in HIV-infected patients [30], but these risk factors were uncommon in this cohort, and not overrepresented in the group of patients with low CD4 counts. Multivariate linear regression analysis showed that increased insulin resistance was independently related to increased age and BMI, as expected, but also to a low CD4 count, which effect-size was higher than that of age >41 years or BMI >30 kg/m2. Adjustment for hsCRP, leptin, adiponectin and triglycerides did not modify these results.
In these patients, with a median age of 36 years and a median BMI of 22.8 kg/m2, the prevalence of diabetes was 3.4% (without considering T120 glucose), a
frequency similar to that previously reported in HIV-infected antiretroviral-naïve patients when using the same definition [18, 19, 31]. We found that HOMA-B, a marker of insulin secretion, was significantly elevated in patients with low CD4 counts. This may explain why fasting glycemia was normal, with increased insulin secretion compensating for increased insulin resistance. However, the post-charge T120 glycemia was increased, and when considering both fasting and post-charge glycemia, the prevalence of impaired glucose tolerance or diabetes tended to be increased in patients with low CD4 counts. These results, which suggest that insulin resistance associated with immune deficiency could lead to glucose tolerance abnormalities, have to be confirmed in larger groups.
In the D.A.D study, patients of African origin had a 1.85 relative risk of developing diabetes during ART relative to Caucasians, probably owing partly to their higher BMI [6]. In contrast, El Sadr et al [18] reported that African Americans were more insulin sensitive than other HIV-infected ART-naïve patients possibly due to their lower BMI. In our study, we found an association or a trend for an association between sub-Saharan origin and altered insulin sensitivity, but not with impaired glucose tolerance and/or diabetes. However, after adjustement for geographic origin, low CD4 counts remained associated with altered insulin sensitivity.
Our results have to be analyzed in the light of those recently reported by Brown et al. [16], showing that both low CD4 counts before ART and systemic low-grade inflammation after ART initiation, but not before ART, are risk factors for incident diabetes in ART-treated patients. Insulin resistance markers were not assessed in their study, but our data, together with their results, strongly suggest that low CD4 count before ART initiation could be the first specific risk factor for altered insulin sensitivity and altered glucose tolerance linked to HIV infection. Then, chronic low-grade inflammation after ART initiation could become another risk factor for insulin resistance and/or insulin secretion defects, leading to an increased risk of diabetes. Several studies, including those of large cohorts, have shown that low current or nadir CD4 count is an independent risk factor for atherosclerosis and cardiovascular
disease events [4, 9, 32], with inflammatory responses to HIV infection being thought to play a prominent role. Early altered insulin sensitivity, linked to immune deficiency before ART, could contribute to increased cardiovascular risk.
Our results also suggest that several metabolic markers deteriorate as immune deficiency progresses. In particular, total, HDL- and LDL-cholesterol levels were lower and triglyceride levels higher in patients with low CD4 counts or high HIV RNA levels. Such changes in circulating lipids have already been linked to HIV infection [33] and replication [18]. Before the advent of effective antiretroviral therapy, wasting and cachexia associated with HIV infection were thought to play an important role in these abnormalities [34]. El Sadr et al. previously reported a correlation between BMI and serum lipid concentrations in antiretroviral-naïve patients [18]. In our study, including patients with less advanced immune deficiency and recent HIV diagnosis, only total and LDL-cholesterol correlated with BMI, and remained significantly associated with the CD4 count and HIV RNA load after adjustment for BMI. Therefore, immune deficiency and/or HIV replication are independently associated with altered serum lipid levels. Triglyceride levels also correlated with markers of insulin resistance and inflammation in our patients, but their relation with CD4 count persisted after adjustment for these markers. Inflammation has already been shown to increase the secretion of very-low-density lipoprotein-triglycerides [35], and a correlation between serum interferon-alpha and triglycerides levels has been described in HIV-infected subjects, before the use of highly active ART [36]. In addition, HIV infection has been linked to increased hepatic de novo lipogenesis [37, 38]. Our results suggest that immune deficiency tend to lower cholesterol and increase triglyceride levels, independently of the inflammatory markers tested.
Our study has some limitations. The number of patients with CD4 below 200/mm3 was relatively small, and the mean level of insulin resistance was mild: larger confirmatory studies are needed to estimate more precisely the relations between
immune deficiency, inflammatory and insulin resistance markers. However, we have studied several metabolic markers, assessed body fat distribution in more than one hundred patients, investigated with CT-scan and DEXA, and have measured a panel of six inflammatory markers. In addition, at the pathophysiological level, we have not demonstrated that immune deficiency has a direct role in promoting insulin resistance. Low CD4 level could be a marker for other abnormalities. Other potential factors, in particular immune activation and/or intestinal bacterial translocation, or vitamin D deficiency, which could be linked to insulin resistance, have not been studied here. Importantly, a low level of vitamin D has been recently reported to be associated with prevalent diabetes in a cohort of HIV-infected patients, most of them being ART-treated [39]. It would be interesting to study this factor in ART-naïve patients.
In conclusion, this study shows that recently diagnosed HIV-infected antiretroviral-naïve patients with low CD4 counts are susceptible to develop insulin resistance. Further studies are required to study the possible mechanisms linking low CD4 counts to increased insulin resistance and also to determine whether insulin resistance, or mechanisms leading to insulin resistance, might aggravate HIV-related immune deficiency.
Acknowledgments
This work was supported by grants from Agence Nationale de Recherches sur le Sida et les hépatites virales (ANRS). The authors thank the patients for their participation, Barbara Antuna-Puente, Bernadette Besson-Lescure and Nadège Brunel for help with multiplexed bead-based immunoassays, Gabriela Mendoza and Karim Khaleche for initiation of data monitoring, and David Young for editorial assistance. We also acknowledge all the other members of the scientific committee of the COPANA cohort: Valentin Amon, Véronique Avettand-Fenoël, Nacéra Benammar, Marie-Aline Charles, Sandrine Couffin-Cadiergues, Rosemary Dray-Spira, Camille Legeai, Christine Rouzioux, Rémonie Seng and Rodolphe Thiébaut.
References
1. Lewden C, May T, Rosenthal E et al. Changes in causes of death among adults infected by HIV between 2000 and 2005: The "Mortalité 2000 and 2005" surveys (ANRS EN19 and Mortavic). J Acquir Immune Defic Syndr 2008; 48:590-598.
2. Lundgren JD, Battegay M, Behrens G et al. European AIDS Clinical Society (EACS) guidelines on the prevention and management of metabolic diseases in HIV. HIV Med 2008; 9:72-81.
3. Brown TT, Cole SR, Li X et al. Antiretroviral therapy and the prevalence and incidence of diabetes mellitus in the multicenter AIDS cohort study. Arch Intern Med 2005; 165:1179-1184.
4. Friis-Moller N, Reiss P, Sabin CA et al. Class of antiretroviral drugs and the risk of myocardial infarction. N Engl J Med 2007; 356:1723-1735.
5. Ledergerber B, Furrer H, Rickenbach M et al. Factors associated with the incidence of type 2 diabetes mellitus in HIV-infected participants in the Swiss HIV Cohort Study. Clin Infect Dis 2007; 45:111-119.
6. De Wit S, Sabin CA, Weber R et al. Incidence and risk factors for new-onset diabetes in HIV-infected patients: the Data Collection on Adverse Events of Anti-HIV Drugs (D:A:D) study. Diabetes Care 2008; 31:1224-1229.
7. Sabin CA, d'Arminio Monforte A, Friis-Moller N et al. Changes over time in risk factors for cardiovascular disease and use of lipid-lowering drugs in HIV-infected individuals and impact on myocardial infarction. Clin Infect Dis 2008;
46:1101-1110.
8. Samaras K. Prevalence and pathogenesis of diabetes mellitus in HIV-1 infection treated with combined antiretroviral therapy. J Acquir Immune Defic Syndr 2009; 50:499-505.
9. El-Sadr WM, Lundgren JD, Neaton JD et al. CD4+ count-guided interruption of antiretroviral treatment. N Engl J Med 2006; 355:2283-2296.
10. Calmy A, Gayet-Ageron A, Montecucco F et al. HIV increases markers of cardiovascular risk: results from a randomized, treatment interruption trial. Aids 2009; 23:929-939.
11. Grunfeld C, Delaney JA, Wanke C et al. Preclinical atherosclerosis due to HIV infection: carotid intima-medial thickness measurements from the FRAM study. Aids 2009; 23:1841-1849.
12. Appay V, Sauce D. Immune activation and inflammation in HIV-1 infection: causes and consequences. J Pathol 2008; 214:231-241.
13. Hsue PY, Hunt PW, Schnell A et al. Role of viral replication, antiretroviral therapy, and immunodeficiency in HIV-associated atherosclerosis. Aids 2009;
23:1059-1067.
14. Gianotti N, Visco F, Galli L et al. Detecting impaired glucose tolerance or type 2 diabetes mellitus by means of an oral glucose tolerance test in HIV-infected patients. HIV Med 2010.
15. Rotger M, Gsponer T, Martinez R et al. Impact of single nucleotide polymorphisms and of clinical risk factors on new-onset diabetes mellitus in HIV-infected individuals. Clin Infect Dis 2010; 51:1090-1098.
16. Brown TT, Tassiopoulos K, Bosch RJ, Shikuma C, McComsey GA. Association between systemic inflammation and incident diabetes in HIV-infected patients after initiation of antiretroviral therapy. Diabetes Care 2010; 33:2244-2249.
17. Florescu D, Kotler DP. Insulin resistance, glucose intolerance and diabetes mellitus in HIV-infected patients. Antivir Ther 2007; 12:149-162.
and insulin levels: results from a large antiretroviral-naive cohort. HIV Med 2005;
6:114-121.
19. Visnegarwala F, Chen L, Raghavan S, Tedaldi E. Prevalence of diabetes mellitus and dyslipidemia among antiretroviral naive patients co-infected with hepatitis C virus (HCV) and HIV-1 compared to patients without co-infection. J Infect 2005; 50:331-337.
20. Matthews DR, Hosker JP, Rudenski AS et al. Homeostasis model assessment: insulin resistance and beta-cell function from fasting plasma glucose and insulin concentrations in man. Diabetologia 1985; 28:412-419.
21. Genuth S, Alberti KG, Bennett P et al. Follow-up report on the diagnosis of diabetes mellitus. Diabetes Care 2003; 26:3160-3167.
22. Alberti KG, Eckel RH, Grundy SM et al. Harmonizing the metabolic syndrome: a joint interim statement of the International Diabetes Federation Task Force on Epidemiology and Prevention; National Heart, Lung, and Blood Institute; American Heart Association; World Heart Federation; International Atherosclerosis Society; and International Association for the Study of Obesity. Circulation 2009;
120:1640-1645.
23. Brown TT, Li X, Cole SR et al. Cumulative exposure to nucleoside analogue reverse transcriptase inhibitors is associated with insulin resistance markers in the Multicenter AIDS Cohort Study. Aids 2005; 19:1375-1383.
24. Spranger J, Kroke A, Mohlig M et al. Inflammatory cytokines and the risk to develop type 2 diabetes: results of the prospective population-based European Prospective Investigation into Cancer and Nutrition (EPIC)-Potsdam Study. Diabetes 2003; 52:812-817.
25. Dixon AK. Abdominal fat assessed by computed tomography: sex difference in distribution. Clin Radiol 1983; 34:189-191.
26. Seidell JC, Oosterlee A, Thijssen MA et al. Assessment of intra-abdominal and subcutaneous abdominal fat: relation between anthropometry and computed tomography. Am J Clin Nutr 1987; 45:7-13.
27. Vigouroux C, Maachi M, Nguyen TH et al. Serum adipocytokines are related to lipodystrophy and metabolic disorders in HIV-infected men under antiretroviral therapy. Aids 2003; 17:1503-1511.
28. Rabe K, Lehrke M, Parhofer KG, Broedl UC. Adipokines and insulin resistance. Mol Med 2008; 14:741-751.
29. Hommes MJ, Romijn JA, Endert E, Eeftinck Schattenkerk JK, Sauerwein HP. Insulin sensitivity and insulin clearance in human immunodeficiency virus-infected men. Metabolism 1991; 40:651-656.
30. Howard AA, Hoover DR, Anastos K et al. The effects of opiate use and hepatitis C virus infection on risk of diabetes mellitus in the Women's Interagency HIV Study. J Acquir Immune Defic Syndr 2010; 54:152-159.
31. Brar I, Shuter J, Thomas A, Daniels E, Absalon J. A comparison of factors associated with prevalent diabetes mellitus among HIV-Infected antiretroviral-naive individuals versus individuals in the National Health and Nutritional Examination Survey cohort. J Acquir Immune Defic Syndr 2007; 45:66-71.
32. Lichtenstein KA, Armon C, Buchacz K et al. Low CD4+ T cell count is a risk factor for cardiovascular disease events in the HIV outpatient study. Clinical infectious diseases : an official publication of the Infectious Diseases Society of America 2010; 51:435-447.
33. Riddler SA, Smit E, Cole SR et al. Impact of HIV infection and HAART on serum lipids in men. Jama 2003; 289:2978-2982.
34. Grunfeld C, Feingold KR. Metabolic disturbances and wasting in the acquired immunodeficiency syndrome. N Engl J Med 1992; 327:329-337.
35. Khovidhunkit W, Kim MS, Memon RA et al. Effects of infection and inflammation on lipid and lipoprotein metabolism: mechanisms and consequences to the host. J Lipid Res 2004; 45:1169-1196.
36. Grunfeld C, Pang M, Doerrler W et al. Lipids, lipoproteins, triglyceride clearance, and cytokines in human immunodeficiency virus infection and the acquired immunodeficiency syndrome. J Clin Endocrinol Metab 1992; 74:1045-1052.
37. Hellerstein MK, Grunfeld C, Wu K et al. Increased de novo hepatic lipogenesis in human immunodeficiency virus infection. J Clin Endocrinol Metab 1993; 76:559-565.
38. Woods MN, Wanke CA, Ling PR et al. Metabolic syndrome and serum fatty acid patterns in serum phospholipids in hypertriglyceridemic persons with human immunodeficiency virus. Am J Clin Nutr 2009; 89:1180-1187.
39. Szep Z, Guaraldi G, Shah SS et al. Vitamin D deficiency is associated with type 2 diabetes mellitus in HIV infection. Aids 2011; 25:525-529.
Table 1: Baseline characteristics of the HIV-infected patients included in the metabolic sub-study of the ANRS COPANA cohort according to their CD4 counts. CD4 counts at baseline (/mm3) <200 N=42 ]200-350] N=43 ]350-500] N=60 > 500 N=69 p Characteristics Female sex Age (years) Geographic origin (N, %) Europe Sub-Saharan Africa Others
HIV-1 RNA levels (log10 copies/mL)
Clinical AIDS (N, %)
BMI (kg/m2)
Waist circumference (cm) (n=205)
Systolic blood pressure (mmHg)
Diastolic blood pressure (mmHg)
Fasting glucose (mmol/L) (n=202)
Impaired glucose tolerance (n=175)
Diabetes diagnosed with/without considering T120 glucose (N, %) (n=204/204)
Impaired glucose tolerance or diabetes as diagnosed by T0 and T120 glucose (N, %) Total Cholesterol (mmol/L) (n=204)
HDL-Cholesterol (mmol/L) (n=198)
HDL-Cholesterol < 1 mmol/L (n=198)
LDL-Cholesterol (mmol/L) (n=198)
Triglycerides (mmol/L) (n=200)
Triglycerides > 1.7 mmol/L (n=200)
10 year-coronary heart disease risk>4%** (N,%) (n=214) Metabolic syndrome (21) (N,%) (n=214)
17 (40.5) 38 [33-47] 12 (28.6) 24 (57.1) 6 (14.3) 5.0 [4.4-5.5] 21 (50.0) 22.0 [20.3-24.2] 80 [75-86] 118 [110-128] 70 [66-80] 4.6 [4.2-4.9] 2 (5.9) 3/2 (7.7/5.1) 5 (12.8) 3.9 [3.4-4.8] 1.0 [0.9-1.3] 26 (65.0) 2.3 [1.8-3.0] 1.3 [0.9-2.1] 16 (40.0) 5 (11.9) 5 (11.9) 16 (37.2) 37 [32-42] 12 (27.8) 21 (48.8) 10 (23.3) 4.3 [3.7-4.8] 2 (4.7) 22.9 [20.6-26.6] 84 [73-92] 120 [110-130] 70 [67-78] 4.9 [4.4-5.2] 1 (3.1) 3/3 (7.9/7.9) 4 (10.5) 4.0 [3.6-4.6] 1.2 [0.9-1.5] 18 (50.0) 2.5 [2.0-3.0] 0.9 [0.7-1.3] 6 (16.2) 3 (7.0) 5 (11.6) 11 (18.3) 37 [31-44] 39 (65.0) 12 (20.0) 9 (15.0) 4.5 [4.0-4.9] 0 (0.0) 23.6 [21.3-26.1] 86 [79-94] 120 [110-139] 70 [64-80] 4.9 [4.4-5.3] 1 (1.9) 2/0 (3.4/0.0) 3 (5.1) 4.3 [3.8-4.9] 1.1 [0.9-1.3] 27 (46.6) 2.8 [2.3-3.1] 1.0 [0.6-1.3] 10 (17.2) 12 (20.0) 10 (16.7) 16 (23.2) 33 [28-40] 39 (56.5) 18 (26.1) 12 (17.4) 3.9 [3.0-4.0] 3 (2.9) 22.5 [20.4-25.0] 81 [75-89] 120 [110-130] 70 [64-75] 4.7 [4.3-5.2] 0 (0) 2/2 (2.9/2.9) 2 (2.9) 4.5 [3.8-5.3] 1.2 [1.0-1.4] 20 (30.8) 2.8 [2.3-3.5] 0.9 [0.6-1.2] 5 (7.6) 11 (15.9) 7 (10.1) 0.04 <0.001 <0.001 <0.001 <0.001 0.09* 0.08* 0.14* 0.23* 0.70* 0.06* 0.4/0.01* 0.07* 0.06* 0.005* <0.001* 0.008* <0.001* <0.001* 0.29 0.72
Table 2: Glycemia, insulin resistance markers, body fat distribution and adipokine levels according to the baseline CD4 counts in the HIV-infected patients included in the metabolic sub-study of the ANRS COPANA cohort.
CD4 counts at baseline (/mm3 ) <200 N=42 ]200-350] N=43 ]350-500] N=60 > 500 N=69 p Markers T0 Glucose (mmol/L) T120 Glucose (mmol/L) T0 Insulin (mU/L) T120 Insulin (mU/L) HOMA-IR (n=202) SAT (cm2 ) (n=139) VAT (cm2 ) (n=139) SAT/VAT (n=139) % total body fat (n=102) % trunk fat (n=102) % limb fat (n=102) HOMA-B (n=200) Leptin (ug/L) Adiponectin (mg/L) 4.6 [4.2-4.9] 5.3 [4.2-6.8] 6.6 [4.8-11.0] 33.3 [18.7-53.6] 1.4 [1.1-2.6] 111.0 [44.2-160.8] 63.2 [38.0-87.5] 1.57 [1.06-2.17] 16.0 [9.5-33.7] 18.1 [8.8-35.7] 13.1 [8.3-31.9] 115.2 [76.0-173.1] 2.7 [1.2-10.9] 14.5 [11.3-16.8] 4.9 [4.4-5.2] 5.0 [4.6-5.7] 5.8 [4.1-8.0] 17.5 [7.8-25.2] 1.3 [0.8-1.7] 136.1 [98.7-213.3] 70.5 [48.5-103.3] 1.68 [1.26-3.35] 24.9 [15.3-37.1] 24.1 [12.2-36.3] 19.0 [12.6-38.8] 95.1 [45.4-133.3] 4.6 [1.5-14.1] 15.4 [9.0-17.9] 4.9 [4.4-5.3] 5.1 [4.2-5.3] 4.8 [3.7-8.5] 16.6 [6.7-37.6] 1.1 [0.8-1.7] 158.8 [74.4-200.5] 84.2 [46.2-130.3] 1.52 [1.16-2.18] 20.9 [14.4-28.5] 22.4 [11.6-30.9] 18.9 [13.2-25.1] 84.4 [52.9-117.5] 5.3 [2.2-9.4] 12.7 [9.2-16.4] 4.7 [4.3-5.2] 4.9 [4.2-5.6] 4.8 [3.4-7.0] 13.8 [9.0-24.0] 1.0 [0.7-1.6] 128.9 [84.6-190.9] 60.5 [43.4-99.0] 1.92 [1.33-3.86] 22.3 [10.0-38.4] 24.7 [12.2-38.9] 19.3 [7.9-39.9] 94.3 [59.2-125.0] 3.1 [0.7-12.2] 14.9 [9.0-17.9] 0.70 0.17 0.02 <0.001 0.004 0.29 0.31 0.28 0.61 0.59 0.60 0.02 0.15 0.58
Data are medians and 25th to 75th percentiles [IQR], or frequencies (%). p values are adjusted for sex. SAT: subcutaneous adipose tissue; VAT: visceral adipose tissue, were assessed by L4 CT scans in 139 patients. % of total, trunk and limb fat were assessed by DEXA in 102 patients.
Table 3: Inflammatory markers according to the baseline CD4 counts in the HIV-infected patients enrolled in the metabolic sub-study of the ANRS COPANA cohort. CD4 counts at baseline (/mm3 ) <200 N=42 ]200-350] N=43 ]350-500] N=60 > 500 N=69 p Markers hsCRP (mg/L) MCP-1 (ng/L) TNF! (ng/L) sTNFR1 (ug/L) sTNFR2 (ug/L) IL-6 (ng/L) 2.5 [0.6-8.2] 210.8 [160.9-359.4] 8.2 [6.6-12.7] 2.1 [1.5-2.9] 3.2 [2.2 –4.1] 4.5 [2.1-9.5] 1.2 [0.5-2.4] 183.3 [112.6-308.6] 5.6 [4.0-8.7] 1.7 [1.4-2.1] 2.7 [2.2-3.1] 2.2 [1.2-3.7] 1.1 [0.6-2.1] 262.3 [158.7-347.8] 7.3 [4.8-9.5] 1.7 [1.2-1.9] 2.5 [2.0 –3.2] 2.9 [1.0-4.0] 1.2 [0.6-3.7] 181.3 [126.8-325.0] 5.0 [3.7-7.3] 1.6 [1.2-2.0] 2.6 [1.6 –2.9] 2.1 [0.8-4.6] 0.15 0.14 <0.001 0.03 0.008 0.007
Table 4: Univariate and multivariate linear regression analysis of the role of age, sex, BMI, geographic origin, and the CD4 counts or HIV-1 RNA levels in insulin resistance (HOMA-IR) in the HIV-infected patients included in the metabolic sub-study of the ANRS COPANA cohort. The multivariate analysis included either the CD4 count or the HIV viral load (see Methods).
Univariate Multivariate Characteristics beta coefficient p value beta coefficient p value beta coefficient p value Age* +0.34 0.003 +0.26 0.01 +0.34 0.001 Female sex +0.45 0.06 +0.04 0.88 +0.14 0.55 BMI** +0.07 0.002 +0.07 0.003 +0.05 0.02 Geographic origin +0.42 0.06 -0.12 0.59 +0.03 0.89 CD4 count (/mm3 ) >500 ]350-500] ]200-350] !200 Reference +0.09 +0.11 +1.11 0.72 0.71 0.0002 Reference +0.07 +0.11 +0.90 0.76 0.67 0.001
HIV-RNA (log copies/mL) !3.70 ]3.70-4.35] ]4.35-4.86] >4.86 Reference -0.02 -0.21 -0.23 0.95 0.48 0.44 Reference +0.41 +0.16 +0.18 0.11 0.54 0.48
* per a 10-year increase; ** per a 1-kg/m2 increase.
Females were compared to males, and patients of Sub-Saharan Africa origin to other patients. HIV-RNA levels were categorized according to the 25th, 50th, and 75th percentiles.
Appendix
Members of the ANRS COPANA Cohort Study Group are:
Christine Rouzioux and Véronique Avettand-Fenoël, Service de Virologie, and
Olivier Lortholary, Jean-Paul Viard, Ségolène Boucly, Aline Maignan and Claudine Duvivier, Service des Maladies Infectieuses, AP-HP, Hôpital Necker, F-75015, Paris, France;
Rodolphe Thiébaut, INSERM U897, F-33076, Bordeaux, France;
Laurence Meyer, Faroudy Boufassa, Marie-Aline Charles, Rosemary Dray-Spira, Camille Legeai, Valentin Amon, Nacera Benammar and Remonie Seng, Centre de Recherche en Epidémiologie et Santé des Populations (CESP), INSERM U1018, 94807, Villejuif and F-94270, Le Kremlin-Bicêtre, France;
Gilles Pialoux, Laurence Slama, Philippe Bonnard, Catherine Chakvetadze and Thomas L’Yavanc, Service des Maladies Infectieuses; Jacqueline Capeau, Corinne Vigouroux, Soraya Fellahi and Jean-Philippe Bastard, Service de Biochimie et Hormonologie, AP-HP, Hôpital Tenon, F-75020, Paris, France;
Eric Oksenhendler, Laurence Gérard, Jean-François Bourge and Véronique Bajzik, Service d’Immunopathologie Clinique; Daniel Séréni, Caroline Lascoux-Combe, Claire Pintado, Olivier Taulera, Le Van Dien and Jeannine Delgado, Service de Médecine Interne, AP-HP, Hôpital Saint-Louis, F-75010, Paris, France;
Jean-Michel Molina, Thierry Saint-Marc, Samuel Ferret and Juliette Pavie, Service des Maladies Infectieuses, AP-HP, Hôpital Saint-Louis and Université Diderot Paris 7, F-75010, Paris, France;
Jean-François Bergmann, Agathe Rami and Maguy Parrinello, Service de Médecine A, AP-HP, Hôpital Lariboisière, F-75010, Paris, France;
Pierre-Marie Girard, Bénédicte Lefebvre, Chérif Boudraa, Bilguissa Diallo and Catherine Lupin, Service des Maladies Infectieuses, AP-HP, Hôpital Saint-Antoine, F-75012, Paris, France;
Serge Herson, Anne Simon and Nadia Edeb, Service de Médecine Interne, AP-HP, Groupe Hospitalier Pitié-Salpêtrière, F-75013, Paris, France;
Dominique Salmon-Céron, Loïc Guillevin, Tassadit Tahi and Marie Pierre Pietri, Service de Médecine Interne 2, AP-HP, Hôpital Cochin, F-75014, Paris, France;
Laurence Weiss, Delphine Tisne-Dessus and Christelle Jalbert, Service d’Immunologie Clinique, AP-HP, Hôpital Européen Georges Pompidou, F-75015, Paris, France;
Patrick Yeni, Sophie Matheron, Golriz Pahlavan, Bao Phung, Nadia El-Alami Talbi, Zahia Ramani, Giovanna Catalano and Cindy Godard, Service des Maladies Infectieuses, AP-HP, Hôpital Bichat, F-75018, Paris, France;
François Boué, Véronique Chambrin, Dominique Bornarel, Hélène Schoen, Service de Médecine, AP-HP, Hôpital Antoine-Béclère, F-92141, Clamart, France;
Robert Carlier, Service de Radiologie et Imagerie Médicale, AP-HP, Hôpital Raymond-Poincaré, F-92380, Garches, France;
Bruno Fantin, Agnès Uludag and Caroline Poder, Service de Médecine Interne, AP-HP, Hôpital Beaujon, F-92110, Paris, France;
Robin Dhote, Michelle Bentata and Patricia Honoré, Unité Sida, Olivier Bouchaud and Xuan Tuyet, Service des Maladies Infectieuses et Tropicales, AP-HP, Hôpital Avicenne, F-93009, Bobigny, France;
Jean-François Delfraissy, Cécile Goujard Fabrice Chaix and Marie-Thérèse Rannou, Service de Médecine Interne, AP-HP, Hôpital de Bicêtre, F-94275, Le Kremlin-Bicêtre, France;
Yves Levy, Alain Sobel and Cécile Dumont, Service d’Immunologie Clinique, AP-HP, Hôpital Henri Mondor, F-94010, Créteil, France;
André Cabié, Sylvie Abel, Sandrine Pierre-François and Véronique Beaujolais, Hôpital Pierre Zobda-Quitman, F-97261, Fort-de-France, Martinique, France;
Isabelle Poizot-Martin, Olivia Zaegel-Faucher and Caroline Debreux, CISIH, Hôpital Sainte Marguerite ; Jacques Moreau, Saadia Mokhtari and Evelyne Van Der Gheynst, Service des Maladies Infectieuses, Hôpital Nord, F-13000, Marseille, France;
Hôpital Saint-Jacques ; Bruno Hoen, Jean-François Faucher, Service des Maladies Infectieuses, Hôpital Saint-Jacques ; Helder Gil, Service de Médecine Interne, Hôpital Minjoz, F-25000, Besançon, France;
Michel Dupon, Jean-Marie Ragnaud, and Isabelle Raymond, Services des Maladies infectieuses A et B, Hôpital Pellegrin; Philippe Morlat, Isabelle Louis and Mojgan Hessamfar, Hôpital Saint-André, F-33000, Bordeaux, France;
Jacques Reynes, Vincent Baillat, Corinne Merle De Boever and Christine Tramoni, CHRU, F-34295, Montpellier, France;
Antoine Soufflet, Patrick Guadagnin, Frédéric Bastides, Patrick Choutet and Louis Bernard, Service des Maladies Infectieuses, Hôpital Bretonneau, F-37000, Tours, France; François Raffi, Olivier Mounoury, Véronique Reliquet, Delphine Brosseau and Hervé Hue, Hôpital Hôtel Dieu, F-44000, Nantes, France;
Thierry May, Simone Wassoumbou, Mireille Stenzel and Marie-Pierre Bouillon, Service des Maladies infectieuses, Hôpital Brabois, CHU de Nancy, F-54511, Vandoeuvre-les-Nancy, France;
Yazdan Yazdanpanah, Thomas Huleux, Emmanuelle Aïssi and Simona Pavel, Service des Maladies Infectieuses, Hôpital Gustave Dron, F-59000, Tourcoing, France;
David Rey, Christine Cheneau, Patricia Fischer, Marialuisa Partisani, Le Trait d'Union Centre de Soins de l'Infection par le VIH, NHC, Hôpital Civil, F-67000, Strasbourg, France;
Gilles Blaison, Mahsa Mohseni Zadeh, Martin Martinot and Anne Pachart, Hôpital Pasteur, F-68000, Colmar, France;
François Jeanblanc and Jean-Louis Touraine, Service d’Immunologie, Hôpital Edouard Herriot ; Christian Trépo, Patrick Miailhes, Koffi Kouadjo, Valérie Thoirain and Corinne Brochier, Service d’Hépato-gastro-entérologie, Hôpital Hôtel-Dieu, F-69000, Lyon, France;
Philippe Perré, Sophie Leautez, Jean Luc Esnault and Isabelle Suaud, Service de Médecine Interne, Centre Hospitalier Départemental, F-85000, La Roche sur Yon, France.