HAL Id: hal-02621511
https://hal.inrae.fr/hal-02621511
Submitted on 26 May 2020
HAL is a multi-disciplinary open access
archive for the deposit and dissemination of sci-entific research documents, whether they are pub-lished or not. The documents may come from teaching and research institutions in France or abroad, or from public or private research centers.
L’archive ouverte pluridisciplinaire HAL, est destinée au dépôt et à la diffusion de documents scientifiques de niveau recherche, publiés ou non, émanant des établissements d’enseignement et de recherche français ou étrangers, des laboratoires publics ou privés.
LC-MS/MS methods
David Metsu, Thomas Lanot, François Fraissinet, Mélanie Picot, Didier
Concordet, Marion Cabrol, Frédérique Dubois-Galopin, Etienne Chatelut,
Pierre Delobel, Peggy Gandia
To cite this version:
David Metsu, Thomas Lanot, François Fraissinet, Mélanie Picot, Didier Concordet, et al.. Determina-tion of dolutegravir’s unbound fracDetermina-tion in human plasma using validated equilibrium dialysis and LC-MS/MS methods. Clinica Chimica Acta, Elsevier, 2018, 479, pp.56-65. �10.1016/j.cca.2017.12.034�. �hal-02621511�
Version postprint
Determination of dolutegravir's unbound fraction in human
plasma using validated equilibrium dialysis and LC-MS/MS
methods
David Metsu, Thomas Lanot, François Fraissinet, Mélanie Picot,
Didier Concordet, Marion Cabrol, Frédérique Dubois-Galopin,
Etienne Chatelut, Pierre Delobel, Peggy Gandia
PII:
S0009-8981(17)30534-X
DOI:
https://doi.org/10.1016/j.cca.2017.12.034
Reference:
CCA 14994
To appear in:
Clinica Chimica Acta
Received date:
10 October 2017
Revised date:
20 December 2017
Accepted date:
21 December 2017
Please cite this article as: David Metsu, Thomas Lanot, François Fraissinet, Mélanie
Picot, Didier Concordet, Marion Cabrol, Frédérique Dubois-Galopin, Etienne Chatelut,
Pierre Delobel, Peggy Gandia , Determination of dolutegravir's unbound fraction in human
plasma using validated equilibrium dialysis and LC-MS/MS methods. The address for
the corresponding author was captured as affiliation for all authors. Please check if
appropriate. Cca(2017),
https://doi.org/10.1016/j.cca.2017.12.034
This is a PDF file of an unedited manuscript that has been accepted for publication. As
a service to our customers we are providing this early version of the manuscript. The
manuscript will undergo copyediting, typesetting, and review of the resulting proof before
it is published in its final form. Please note that during the production process errors may
be discovered which could affect the content, and all legal disclaimers that apply to the
journal pertain.
Version postprint
ACCEPTED MANUSCRIPT
Clinica Chimica Acta - Original article
Determination of dolutegravir's unbound fraction in human plasma using validated
equilibrium dialysis and LC-MS/MS methods.
David Metsu
a,b; Thomas Lanot
a; François Fraissinet
a; Mélanie Picot
a; Didier Concordet
c;
Marion Cabrol
a; Frédérique Dubois-Galopin
d; Etienne Chatelut
b,e; Pierre Delobel
f,g,; Peggy
Gandia
*a,ca. Department of Pharmacokinetic and Toxicology, Toulouse University Hospital, France
b. INSERM, CRCT, Toulouse University, UPS, Toulouse, France
c. INRA, Toxalim, INP-ENVT, Toulouse University, UPS, Toulouse, France
d. Laboratory of Hematology, Toulouse University Hospital, France
e. Institut Claudius-Regaud, IUCT-Oncopole, Toulouse, France
f. INSERM, UMR1043, Toulouse University, UPS, Toulouse, France
g. Department of Infectious Diseases, University Hospital of Toulouse, France
Corresponding author: Pr Peggy Gandia
Laboratoire de Pharmacocinétique et Toxicologie, Centre Hospitalo-Universitaire Purpan, 330
avenue de Grande-Bretagne, 31059 Toulouse, France
Version postprint
ACCEPTED MANUSCRIPT
Abstract
Assessment of the unbound pharmacologically active fraction (fu; as the ratio of unbound to total concentration) of dolutegravir could improve therapeutic drug monitoring (TDM) in patients that experience virological failure or toxicity, despite receiving adequate total concentrations. This study evaluated (i) dolutegravir's fu through equilibrium dialysis (ED), (ii) the pre-analytical parameters that influence fu, and (iii) fu's inter-individual variability in HIV patients. Validation of the LC-MS/MS method followed FDA guidelines. The results, based on coefficients of variation (results from nominal concentrations <15%), allowed accurate measurement of unbound and total dolutegravir
concentrations. Equilibrium during ED was obtained in 4h. Sparse non-specific binding (9%) was observed, allowing results interpretation without interference. Steps before analysis (e.g., conservation at +4°C, freeze/thaw cycles) did not influence fu, allowing easy integration of fu analysis within laboratory routines. Anticoagulants from samples (citrated versus heparinized; p<0.001) and
hemolysis (p=0.007) influenced fu and could lead to misinterpretation. Developed was then performed to the HIV-patients' plasma (n=54). Results, expressed as median InterQuartileRange[25%;75%] were 0.45% IQR[0.38;0.55] for fu, 9.26μg/L IQR[4.62;15.14] for unbound, and 2035μg/L IQR[878.5;2640] for total concentration. The high inter-individual variability observed in the unbound form from HIV patients was a first step towards integrating dolutegravir TDM.
Keywords: Dolutegravir; Unbound fraction; Equilibrium dialysis
Abbreviations:
TDM: Therapeutic Drug Monitoring; ED: Equilibrium Dialysis; HIV: Human Virus of Immunodeficience; FDA: Food and Drug Administration; LC-MS/MS: liquidchromatography/mass spectrometry; IQR: InterQuartile Range; DTG: Dolutegravir; AAG: alpha-1-acid glycoprotein; HPLC: High Performance Liquid Chromatography; Quality-control (QC); CV= coefficient of variation; SD=standard of deviation; ANOVA: Analysis of Variance
Version postprint
ACCEPTED MANUSCRIPT
1. Introduction
Dolutegravir (DTG) is an HIV integrase strand-transfer inhibitor that is usually associated with abacavir and lamivudine in combined antiretroviral therapy. Clinical trials show that the efficacy of DTG depends on plasmatic concentration [1,2]. Although efficacy thresholds have been proposed [3,4], some virological failures have been observed despite total concentrations considered to be effective and similar to patients without virological failure [3,4,5]. Moreover, many "real-life" studies indicate there can often be neuro-psychic effects [6,7] although, to date, without an association with higher total concentration (area under the curve, maximal or trough concentration) in the overall population that receive DTG.
The unbound concentration is considered to be the pharmacologically active form that can diffuse into tissues and across membrane cells to exert its pharmacological activity (therapeutic or toxic) [8]. To date, this property has been used to explore DTG diffusion and concentration in tissues, especially those identified as anatomical HIV reservoirs for replication, such as the central nervous system or testicular tissue [9,10]. Dolutegravir is highly bound (>99%) to plasma proteins, especially albumin, and to a lesser extent to the alpha-1-acid glycoprotein (AAG) [11]. Then, only a small amount of unbound DTG is available to exert its pharmacological activity. Thus, it can be hypothesized that any variation of the unbound form, which may not be perceived at total concentration, could result in considerable variability in pharmacodynamic effect. Therefore, differences in efficacy (virological failure) or toxicity (neuro-psychic side effects) between patients at similar total concentrations could be explained by the inter-individual variability within unbound concentrations.
Only sparse data are available on the unbound form of DTG. Two studies [9,12] have explored the unbound form of DTG using a quick and convenient method, namely ultrafiltration. Nevertheless, ultrafiltration is known to suffer from many analytical interference factors, leading to wide variability in the results [13,14]. On the other hand, equilibrium dialysis (ED) is considered the gold-standard technique to evaluate the unbound form of DTG, particularly because of the low number of
Version postprint
ACCEPTED MANUSCRIPT
as sample preservation and freeze--thaw cycles, may influence the results independently of the device used to evaluate unbound forms [13,14]. Thus, the aim of our study was to evaluate the unbound form of DTG, especially under pre-analytical conditions, using a method with the lowest analytical
interference and evaluating protein binding at equilibrium. Consequently, our study was based on developing an analytical assay that measured unbound (through equilibrium dialysis and measured by LC-MS/MS) and total plasma concentrations (measured by LC-MS/MS). The validated method was then applied to samples from HIV patients to explore the inter-individual variability of DTG in its unbound form.
2. Materials and methods
2.1 Chemicals and reagents
Acetic acid and ammonium acetate were purchased from Sigma-Aldrich (St. Louis, MO). Dolutegravir (DTG) (LGC Standards) was measured with a deuterated internal standard: dolutegravir-d4 (LGC Standards, Molsheim, France). LC-MS-grade acetonitrile and methanol were obtained from Sigma-Aldrich (St. Louis, MO). Water-gradient of HPLC grade was obtained from an Elga Option 4 water purifier (Scharlau, Barcelona, Spain). Sörensen buffer solution was prepared with sodium phosphate dibasic purchased from Merck (Darmstadt, Germany) and potassium phosphate monobasic was purchased from VWR international (Fontenay sous Bois, France), sodium hydroxide 32 % from Merck KGaA (Darmstadt, Germany), and ultrapure water form Merck Millipore (Fontenay-sous-Bois, France) to adjust the pH to 7.4. Drug-free plasma from healthy donorswas supplied by the French Blood Bank (“Etablissement Français du Sang”, EFS, Toulouse, France).
2.2 Instruments and conditions
The MS/MS system in the laboratory consisted of a Shimadzu LC system with a Shimadzu LC-20ADXR binary pump, a Shimadzu SIL-20AXR auto-sampler, a Shimadzu CBM-20A controller, and a
Shimadzu CTO-20AC column oven, coupled with an ABSciex API-4500 (Applied Biosystems/MDS Sciex, Foster City, CA) triple quadripole tandem mass-spectrometer.
Version postprint
ACCEPTED MANUSCRIPT
2.3 Chromatographic conditions
The column was a Kinetex Biphenyl (50 × 2.1 mm, 5 μm) from Phenomenex™ (Aschaffenburg, Germany), maintained at 40°C. The two mobile phases were 2 mM ammonium acetate and 0.2% acetic acid in water (mobile phase A), and 2 mM ammonium acetate and 0.2% acetic acid in methanol (mobile phase B). Chromatographic separation was achieved using an isocratic program at a flow rate of 800 μL/min with 30% of mobile phase A and 70% of mobile phase B. The total run time was 2 min. The needle was washed twice with 3 mL of acetonitrile/isopropanol (50: 50, v/v) between injections.
2.4 Tandem mass-spectrometry analysis
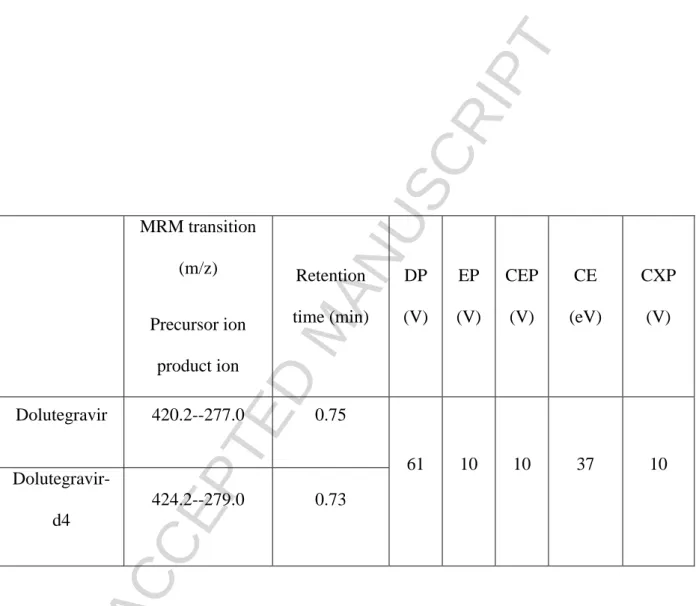
The mass spectrometer was set to electrospray ionization in positive-ion mode for DTG and DTG-d4. The TurboIonspray interface settings and collision gas pressure were optimized (ion spray voltage: 5500 V, temperature: 500°C, collision gas: 8.0 psi, curtain gas: 15.0 psi). Nitrogen was used both as a nebulizing (40 psi) and a drying gas (40 psi). Tandem mass-spectrometry was performed in multiple-reaction mode (MRM) mode with nitrogen as the collision gas. All MRM transitions are listed in Table 1, including de-clustering potential (DP), entrance potential (EP), cell-entrance potential (CEP), collision energy (CE), and cell-exit potential (CXP). Analyst 1.6.2 and Cliquid 3.0 software were used to control the equipment, collect data, and for the analyses (Applied Biosystems/MDS Sciex, Foster City, CA).
2.5 Preparation of standard solutions, internal standards, and quality controls
The following stock solutions were prepared at a concentration of 1000 mg/L: DTG, DTG -d4. All primary stock solutions were prepared in methanol and stored at −20°C. Working solutions were diluted in methanol for total DTG and water for unbound DTG.
A six-point calibration curve was prepared for each analyte by diluting known volumes of the working solution in plasma for total DTG and in Sörensen buffer for unbound DTG. Calibrators concentrations were 0, 50, 125, 500, 2000, 4000, and 10000 ng/mL for DTG, and 0.5, 1, 5, 10, 50, and 100 ng/mL for unbound DTG. Range calibration curves were established according to available data in the literature
Version postprint
ACCEPTED MANUSCRIPT
for both total5 and unbound concentrations [9,10] in HIV patients. Through the proposed ranges, we
aimed to avoid any dilution or measurement under the lowest limit of quantification (LLOQ) to fully interpret the unbound-form result.
Quality-control (QC) samples were prepared in the same way, using an independently prepared stock solution at a final concentration of 150 ng/mL (low QC [LQC]), 1500 ng/mL (medium QC [MQC]), and 7500 ng/mL (high QC [HQC]) for total DTG, and 1.5 ng/mL (LQC), 15 ng/mL (MQC), and 75 ng/mL (HQC) for unbound DTG. For both unbound and total concentrations, low level QC
corresponded to three times the value of the lower limit of quantification. Medium QC level lay in the middle range of calibration, whereas high QC level corresponded to the third quarter of the higher limit of quantification, in accordance to FDA recommendations [15].
Calibration curves and quality controls were prepared just before use during assay validation.
2.6 Sample processing
For total DTG determination in plasma, in Eppendorf tubes, 50 µL of plasma were extracted with 200 µL of precipitation reagent containing 100 ng/mL of DTG-d4 in methanol. Samples were immediately vigorously shaken for 30 s and centrifuged at 10000 g for 10 min. Fifty microliters of the supernatant were diluted with 200 µL of distilled water and then 150 µL were transferred into a 200-µL sample vial (Phenomenex, Aschaffenburg, Germany). Five microliters were injected in the LC-MS/MS system.
For unbound DTG determination, in Eppendorf tubes, 50 µL of dialysate was extracted with 200 µL of precipitant reagent containing 1 ng/mL of DTG-d4 in a solution of 40% of mobile phase A and 60% of mobile phase B. Fifty microliters were injected in the LC-MS/MS system.
2.7 Method validation
In our study, method validation for unbound and total DTG concentrations were performed according
to the recommendations of both the International Organization for Standardization (ISO) 15189 standard for medical laboratories and the Food and Drug Administration (FDA) [15].
Version postprint
ACCEPTED MANUSCRIPT
The validation method was divided into three successive parts
(i) The first part describes the different stages of accuracy and precision, selectivity, matrix effects and recovery, carry-over, dilution, and isotopic contribution for both the unbound and total concentrations. (ii) The second part describes the total concentration stability at different storage conditions and the impact of plasma anticoagulants on the results.
(iii) The third part describes the unbound form and the procedure used for equilibrium dialysis, stability of the unbound DTG in Sörensen's buffer and of the DTG-protein binding, and finally the effects of plasma anticoagulant and hemolysis on the unbound fraction.
2.7.1 Accuracy and precision
Accuracy and precision were evaluated on intra- and inter-days using calibration at each level. For intra-day validation, five samples from each level quality control were analyzed on the same day. For inter-day validation, two samples from each quality control (three levels: LQC, MQC, HQC) were determined on 5 separate days. Accuracy was defined as the percentage deviation from the nominal level, and precision as the coefficient of variation (calculated by the following equation:
CV=(SD/m)*100; where, CV= coefficient of variation, SD=standard of deviation, m= mean), which should not exceed 15% [15].
For the calibration curve, there were three acceptance criteria: (i) a correlation coefficient between the measurements and the theoretical concentration >0.99, (ii) the deviation from the calculated
concentration with the range within +/- 15% of the theoretical concentration, except for the LLOQ, where a deviation of +/- 20% was accepted, and (iii) a follow-up of the slope reproducibility of the method validations: its relative standard deviation should not exceed +/- 15%.
Our laboratory included total concentration DTG analysis according to external and international quality control (Asqualab®).
Version postprint
ACCEPTED MANUSCRIPT
Selectivity was assessed using blank plasma samples from six different sources of plasma for total DTG and with dialysate or Sörensen's buffer for unbound DTG. An absence of interfering components was accepted when the response (area) was <20% of the lower limit of quantification for the analyte.
2.7.3 Matrix effects and recovery
Matrix effects and extraction recovery were evaluated following Matuszewski et al.'s [16] methodology.
To evaluate the matrix effect and extraction recovery for total DTG, blank plasma samples from different donors were extracted, as described above. Extracts were spiked with the working solution of total DTG, with spiking levels corresponding to QC levels after extraction (assuming an extraction recovery of 100%). The matrix effect for each level was assessed by calculating the ratio of peak area between these spiked blank extracts and the corresponding solutions of DTG and DTG-d4, in mobile phase. Extraction recovery was assessed by calculating the ratio of area peak between the extracted QCs (LQC, MQC, and HQC) and the corresponding spiked blank extracts. Each sample was made in triplicate and the main criteria for validating extraction recovery was precision: calculated CV should not exceed 20%.
To evaluate the matrix effect for unbound DTG, Sörensen's buffer was diluted then directly spiked with the working solution of unbound DTG with spiking levels corresponding to QC levels after dilution. The matrix effect for each level was assessed by calculating the ratio of peak area between these spiked blanks and the corresponding solutions of DTG and DTG-d4, in mobile phase.
2.7.4 Carry-over effects
Carry-over effects were assessed by testing three blanks successively following the highest calibration standard for both total and unbound DTG. Carry-over in the blank sample should not exceed 20% of the LLQ concentration [17].
Version postprint
ACCEPTED MANUSCRIPT
Accuracy of diluted samples was investigated to ensure that the samples could be diluted with a blank matrix without affecting the final concentration. Spiked human-plasma samples were prepared at concentrations of 15000 ng/mL for total DTG and 200 ng/mL for unbound DTG, respectively. These solutions were further diluted ten and five-fold with blank plasma in six replicates, and then analyzed. The six replicates should demonstrate precisions of ≤15% and accuracies between +/- 15% [17].
2.7.6 Isotopic contribution
Hypothetical isotopic contributions between analyte and its deuterated internal standard were assessed to ensure spiked samples with DTG-d4 do not impact on DTG concentrations and vice versa.
Contribution of DTG to DTG-d4 response was evaluated by comparing the DTG-d4 signals of a blank spiked with DTG at the upper limit of quantification versus a blank spiked with DTG-d4 at working concentrations. Contribution of DTG-d4 on DTG response was evaluated by comparing the DTG signals of a blank spiked with DTG-d4 at a working concentration versus a blank spiked with DTG at the LLOQ. In both cases, the former signal should not exceed 20% of the latter [17].
2.7.7 Stability of DTG for total concentration
The stability of DTG in plasma under different storage and processing conditions was investigated. The stability of analytes in the injection solvent was estimated by injecting replicate preparations of processed samples at up to 24 h (in an auto-sampler at room temperature) after the initial injection, in order to simulate an over-night instrumental failure. The peak-areas of the analytes and internal standards obtained from the initial cycle were used as a reference to determine relative stability of the analytes at subsequent points.
Stability of analytes in plasma after 3 and 6 h, at room temperature (bench top), was determined at two concentrations (LQC and HQC) in three replicates. Stability at +4°C was assessed in plasma for the total concentration stored at +4°C for 3 days (at 24, 48, and 72 h). Stability of analytes in the plasma following three repeated freeze--thaw cycles (stored at −20°C) were assessed using QC samples spiked with analytes in the same conditions as described above. Stability of binding protein was also studied at 4°C and after one or two repeat unbound freeze--thaw cycles. Stability at -20 ° C was
Version postprint
ACCEPTED MANUSCRIPT
investigated for long-term stability. Duplicates of each QC level were thawed after 10 months of freezing and compared to the target.
The mean target concentration at each level was aimed to be within ±15% of the nominal concentration.
2.7.8 Anticoagulant effect
Citrated plasma samples (BD, Oxford, UK) were used to validate total concentrations method whereas lithium heparin (BD, Oxford, UK) plasma samples were used in the HIV-patient study. Citrated and heparinized plasma samples were obtained from healthy donors (Etablissement Français du Sang). Three citrated and heparinized plasma samples were spiked at 1 mg/L of DTG total concentration, whereas three other plasma from each anticoagulant were spiked at 4 mg/L in order to obtain concentrations close to those observed at trough and maximum concentrations in HIV patients [5]. Spiked samples were then extracted as described for the DTG total-concentration samples. The chromatographic area of DTG, DTG-d4, and concentrations of DTG were compared between the anticoagulants to assess any anticoagulant effects.
2.7.9 Determination of unbound DTG in plasma
2.7.9.1 Dolutegravir stability in Sörensen buffer
The stability of DTG in S
ö
rensen's buffer under different storage and processing conditions was investigated.The stability of analytes in the injection solvent was estimated by injecting replicate preparations of processed samples for up to 24 h (in an auto-sampler at room temperature) after the initial injection in order to simulate an over-night instrumental failure. The peak-areas of the analytes and internal standards obtained from the initial cycle were used as references to determine relative stability of the analytes at subsequent points.
Version postprint
ACCEPTED MANUSCRIPT
Stability of analytes in S
ö
rensen's buffer after 3 and 6 h, at room temperature (bench top), was determined at two concentrations (LQC and HQC) in three replicates. Stability at +4°C was assessed in plasma for unbound concentrations stored at +4°C (at 24 and 168 h). Stability of analytes in the buffer following three repeated freeze--thaw cycles (stored at −20°C) were assessed using QC samples spiked with analytes under the same conditions as described above. The mean target concentration at each level was aimed to be within ±15% of the nominal concentration [15].2.7.9.2 Plasma samples
In order to evaluate the time needed to reach binding equilibrium during dialysis-binding stability and the influence of the anticoagulant and hemolysis on DTG-protein binding, plasma from healthy donors were spiked with DTG. Dolutegravir was added to the plasma in solution that included <5% methanol, to avoid altering protein binding.
2.7.9.3 Equilibrium dialysis
Equilibrium dialysis (ED) was performed in cells made from Teflon using a Dianorm apparatus (Diachema AG, Zurich, Switzerland) in 1-mL capacity cells, and equilibrium was reached through Visking Dialysis Tubing membranes (molecular mass cut-off : 12000-14000 Da, Medicell Membranes Ltd, London, UK). A 1-mL aliquot of plasma samples was dialyzed against 1 -mL Sörensen's
phosphate buffer solution at pH 7.4 in a temperature-controlled heater at a nominal temperature of 37°C in a thermostatic enclosure that was rotated at 12 rpm for 4 h. After dialysis was complete, the resulting plasma and buffer dialysates were promptly recovered from the Teflon cells and analyzed by LC–MS/MS. Fifty microliters of dialysate were diluted with 450 µL of mobile phase (40% of A and 60% of B) containing DTG-d4 at 1 ng/mL. Fifty microliters was injected into the LC-MS/MS system. After dialysis, the remaining plasma was extracted as described above.
Version postprint
ACCEPTED MANUSCRIPT
The unbound fraction was calculated using the follow equation: fu = Cu/Ct, Cu as buffer DTG concentration, which was considered as unbound, Ct as total concentration in plasma after ED, fu corresponded to the unbound fraction.
2.7.9.5 Time to equilibrium
The time necessary to achieve equilibrium of DTG-binding to plasma proteins was determined with five samples during 3, 4, and 5 h, at 12 rpm and in a thermostatically controlled oven at 37°C. The samples were then spiked to obtain total DTG concentrations of 1 mg/L, corresponding to the usual trough concentration [5].
2.7.9.6 Non-specific binding
To evaluate the non-specific binding study, plasma samples were spiked to achieve 1 mg/L total concentration of DTG. Non-specific binding was calculated with five samples using the following formula: [(initial quantity)/(plasma quantity + dialysate quantity)]. The target of non-specific binding was defined as being <10% [18].
2.7.9.7 Binding stability
Protein-binding stability was studied at +4°C for 24, 48, 96, and 120 h, and after two and three freeze--thaw cycles in spiked plasma at 1 mg/L, stored at -20°C.
2.7.9.8 Influence of hemolysis
In order to explore the effect of hemolysis on the unbound fraction as a pre-analytical interference, whole blood from healthy donor without DTG was diluted by 50% in distilled water to generate hemolysis through hypo-osmolar bursting. The target value of hemoglobin was 0.5 g/dL [19] and was checked by spectrophotometry (XN3000, Sysmex®). The sample was then diluted to obtain
hemoglobin values of 0.25 and 0.1 mg/L. The samples were then spiked to obtain total DTG concentrations of 1 and 4 mg/L, corresponding to the usual trough and maximum concentration, respectively, observed in HIV patients [5]. Donor plasma samples, spiked at the same trough and
Version postprint
ACCEPTED MANUSCRIPT
maximal concentrations, without hemolysis, were also prepared in parallel to compare the results obtained with a control without hemolysis. Total and unbound concentrations, using the ED procedure, were measured and fu was calculated.
2.7.9.9 Influence of anticoagulant
Citrated plasma samples (BD, Oxford, UK) were used to validate our method and the binding studies, whereas plasma samples with lithium heparin (BD, Oxford, UK) were used in the HIV-patients' study. The influence of two anticoagulants on the DTG unbound fraction was also investigated. Six paired samples of citrated and heparinized plasma, each pair from the same patient, were spiked to obtain total DTG concentrations of 1 and 4 mg / L, corresponding to the usual trough and maximum concentrations, respectively, in HIV patients [5]. Three pairs were spiked at 1 mg/L and three others pairs were spiked at 4 mg/L of total DTG. Unlike for total DTG concentration, each pair of citrated and heparinized plasma sample was from the same patient to avoid any inter-individual variability of fu from the plasma donors. Total and unbound concentrations, using the ED procedure, were measured and fu calculated.
2.8 Samples from patient
Total and unbound DTG were quantified in plasma samples from 54 patients. Samples were stored at -20°C before analysis, after first centrifuging at 2000g, at +-20°C for 15 min, immediately after arrival at the laboratory. The plasma was separated from the sample and stored at -20°C until analysis. On the day of analysis, the thawed plasma samples were first heated at 37°C within a Bain Marie heater prior to processing (total concentration measurement or equilibrium dialysis).
Dolutegravir therapeutic drug monitoring and data collection were part of routine patient care, without any additional procedures. Therefore, no institutional review board or ethics-committee approval was required, in accordance with the French regulations on biomedical research [20,21].
Version postprint
ACCEPTED MANUSCRIPT
Analysis of variance (ANOVA) was performed with R software (3.3.2) [22]. The significance level
was set at p <0.05. If the ANOVA was statistically significant, Dunnett's test was performed to determinate any potential interactions. Results of paired Student's t-tests are shown as their means and standard deviations. The alpha value was set at 5%. Results from the HIV-patients' samples are expressed as their medians and interquartile ranges IQR[25%;75%]. As recommended by FDA guidelines for analytical procedures, stability results were analyzed using the coefficient of variation (calculated as: CV=(SD/m)*100; where, CV= coefficient of variation, SD=standard of deviation, m= mean).
3. Results
3.1 Chromatography and extraction
Multiple-reaction mode (MRM) transitions and mass-spectrometer parameters were optimized using direct infusion of DTG and DTG-d4 in a standard solution. Positive-ionization mode was used. The MRM transition for DTG (m/z 420.2--277.0) was selected due to its intensity and lack of
chromatographic interference during selectivity tests. The selected MRM transition for DTG-d4 corresponded to the same fragmentation mechanism as the DTG transition to ensure optimal
standardization. Optimal separation of the analytes was achieved using ammonium buffer in water and methanol as the mobile phase. These chromatographic conditions have been also used for other antiretroviral drugs. Separation and detection of DTG and an internal standard were accomplished within 2 min. The retention time of the analyte was 0.76 min for DTG and 0.74 min for DTG-d4, respectively (Figure 1).
3.2 Method validation
This section on Method Validation follows the same pattern used in the Material and Methods, i.e.: the first part is on unbound and total concentrations, the second part addresses total concentrations, and the third part focuses on exploration of unbound DTG and DTG-binding.
Version postprint
ACCEPTED MANUSCRIPT
3.2.1 Calibration curves
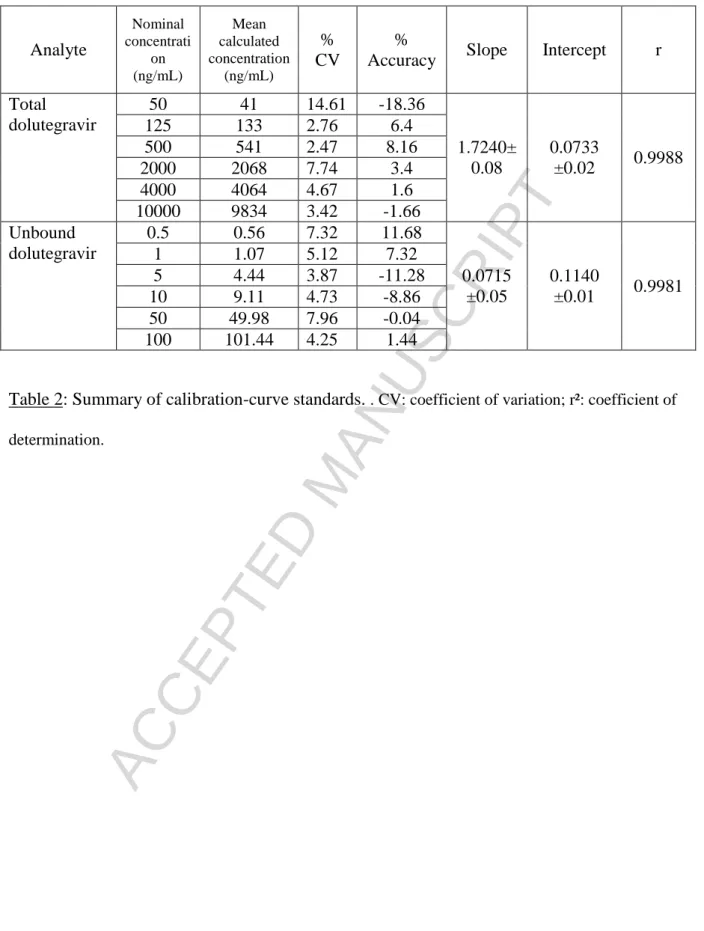
The calibration curves were satisfactorily fitted by linear regression (1/x weighting) for total and unbound DTG over the concentration ranges of 50--10,000 ng/mL for total concentration DTG, and 0.5--100 ng/mL for the unbound DTG. For both total and unbound DTG, the methods showed large linearities (50--10,000 ng/mL and 0.5--100 ng/mL, for total and unbound concentrations,
respectively). The quality of the calibration curves was evaluated by the correlation coefficient, the deviation of calculated concentrations from nominal values, and the reproducibility of the slope and intercept. The observed mean calculated concentrations, with their precisions and accuracies, are listed in Table 2.
During the experiment, the area of the internal standard (IS) did not decrease with the increase in the concentration of the calibrated curve.
3.2.2 Accuracy and precision
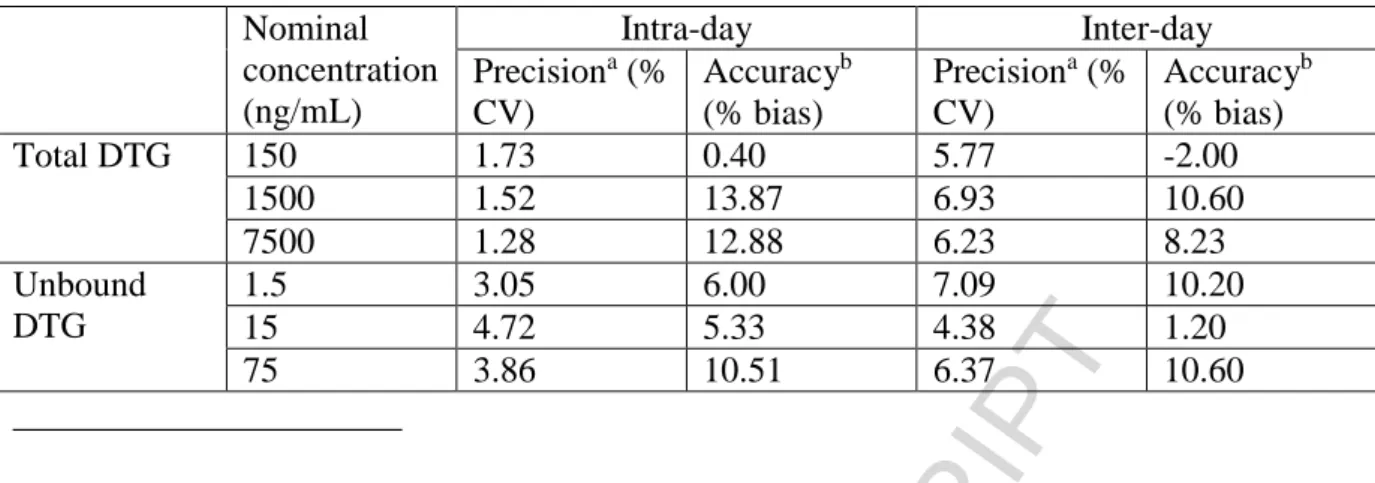
The data for intra- and inter-day precision and accuracy of all the analytes from the quality control samples are shown in Table 3 for total and unbound DTG. Intra- and inter-day precisions were <3.05% and 4.72%, whereas intra- and inter-day accuracies ranged from 5.33--10.51% and 1.20--10.60%, respectively.
We also used an external quality-control system to further evaluate accuracy and to follow the performances of the method through time. Accuracy of the samples from the year 2016 was 3.85%.
3.2.3 Limit to quantitation
The lower limit of quantitation (LLOQ) was defined as the lowest standard concentration of the calibration curve whose precision and accuracy were evaluated during intra-day and inter-day assays. Moreover, the LLOQ signal was ten times greater than the signal from the blank, indicating adequate sensibility.
Version postprint
ACCEPTED MANUSCRIPT
In accordance with laboratory practice, the limit of detection was not studied and was, by default, considered equal to the LLOQ. This was considered satisfactory as concentrations below the lowest point of the calibration curve were regarded as clinically irrelevant.
3.2.4 Selectivity
As shown in Figure 1, no interference from endogenous substances was observed at any of the retention times for DTG (total or unbound) in the tested blanks.
3.2.5 Matrix effects and recovery
For total DTG, the mean extraction recoveries from all the analytes with sample precipitation were 98 ± 3% for total DTG, 95 ± 3% for DTG-d4, and the matrix effects were 96 ± 5% for DTG and 101 ± 5 % for DTG-d4. No critical matrix effects were observed; overall CVs were not greater than 15%. For unbound-DTG, the mean extraction recoveries from all the analytes with sample precipitation were 108 ± 8% for DTG, 91 ± 4% for DTG-d4, and the matrix effects were 58 ± 8% for DTG and 49 ± 4% for DTG-d4; overall CVs were not greater than 15%.
3.2.6 Carry-over
No carry-over effect was observed because no peak was observed on the blank plasma after analyzing the highest concentration of the calibration standards.
3.2.7 Dilution integrity
For total and unbound DTG, dilution integrity was performed to extend the upper concentration limit by testing two dilutions (at 1/5 and 1/10): this had acceptable precision and accuracy (<10%; Table 4).
3.2.8 Isotopic contribution
Examination of the single, blank, plasma samples containing DTG-d4, but no DTG, revealed no significant interferences from DTG (<20% of the LLOQ peak area). Conversely, analysis of the
Version postprint
ACCEPTED MANUSCRIPT
highest standard in the calibration curve without DTG-d4 showed that DTG did not significantly interfere with the DTG-d4 signal.
3.2.9 Stability of the total concentration
Stability of total DTG was checked in plasma samples (LQC and HQC) stored at an ambient temperature, at 4°C, after three freeze--thaw cycles, and after long-term conservation at -20°C (10 months). The results are shown in Table 5. Stability accuracies (CV%) after 10 months at -20°C for the total concentrations were 2.50% (5.79%) and 7.55% (6.98%).
3.2.10 Anticoagulant effect for the total concentration
No difference between heparinized or citrated plasma was observed for DTG and DTG-d4 areas (p=0.72 and p=0.22 Student's t- paired test for DTG, and DTG-d4 area, respectively), or DTG concentration calculated by the DTG and DTG-d4 area ratios (p=0.23, paired Student's t-test).
3.2.11 Determination of the unbound fraction
3.2.11.1 Dolutegravir's stability in Sörensen buffer
Dolutegravir's stability in Sörensen buffer at +4°C for 168 h showed accuracies of 4.66% and -2.18%, with precisions of +3.22% and +1.73%, for LQC and HQC, respectively.
Stability of total and unbound DTG was checked for in the plasma samples (LGC and HQC) stored at ambient temperature, at 4°C, and after three freeze--thaw cycles. The results are shown in Table 5. For LQC and HQC, accuracy for 3 and 6 hours at ambient temperature was within ±15%.
3.2.11.2 Time needed for equilibrium
We determined the time needed to achieve equilibrium in five samples (Table S1). There were significant differences between all the groups (p=0.0036, ANOVA), but not between the equilibrium delay of 4 h and 5 h (p=0.98, Dunnett's test). Thus, a period of 4 hours of equilibrium was chosen, as occurs for other antiretrovirals drugs co-administered with DTG.
Version postprint
ACCEPTED MANUSCRIPT
3.2.11.3 Non-specific binding
Non-specific binding was evaluated in five samples spiked with DTG at 1 mg/L. Mean non-specific binding was 9%. The ratio was <10%. Non-specific binding in a dialysis system (dialysis membrane, plastic recipients) was negligible.
3.2.11.4 Binding stability
Binding stability was studied at 4°C for 24, 48, 96, and 120 h, and after two and three freeze--thaw cycles. The unbound fractions did not differ between the groups (p=0.648, ANOVA; Table S2). Binding of DTG remained stable over time and after freeze--thaw cycles.
3.2.11.5 Influence of anticoagulant
The unbound fraction was higher on samples that contained citrate anticoagulant compared to heparinized samples. The difference was statistically significant at higher concentrations (mean ± SD fu were 1.22± 0.09 and 0.77 ± 0.08, respectively, p<0.001, paired Student's t-test for citrated and heparinized samples at initial total concentrations of 4 mg/L), and there was a trend towards significance at low concentrations of DTG (mean ± SD fu were 0.92 ± 0.26 and 0.71 ± 0.2, respectively, p=0.135, paired Student's t-test for citrated and heparinized sample at an initial total concentration of 1 mg/L) (Table S3).
3.2.11.6 Influence of hemolysis
The unbound fraction increased with hemoglobin concentration increasing, especially at
concentrations of 4 mg/L of DTG (p=0.007, ANOVA). Dolutegravir's fu was also statistically higher (p=0.024, ANOVA) at low concentration (1 mg/L), but only at high concentrations of hemoglobin (p=0.03, Dunnett's test) (Table S4, Figure S1). At high concentrations and for high levels of DTG , hemolysis increased the unbound fraction. Hemolysis at 0.5 g/dL systematically and significantly increased the unbound fraction for both low and high concentration of DTG (1 and 4 mg/L).
Version postprint
ACCEPTED MANUSCRIPT
Results from HIV patients enabled us to explore the inter-individual variability of the total and unbound form of DTG: this had a median IQR [25, 75%] and coefficient of variation (CV) of 0.45% IQR [0.38, 0.55]; CV=61.77% for unbound fraction, 9.26 μg/L IQR [4.62, 15.14]; CV=70.03% for unbound concentration and 2035 μg/L IQR [878.5; 2640]; CV=66.72% for total concentration. Distribution of sampling times have been reported on supplemental data (FigureS2).
Discussion
Two techniques were developed in our study to evaluate the unbound form of DTG and to explore the pre-analytical parameters that could alter interpretation of the results. These techniques were then used to evaluate the unbound form of DTG in HIV patients.
The chromatographic technique allowed us to measure concentrations of DTG, both in a plasma matrix and in phosphate buffer. The accuracy, precision, carry-over, dilution, stability, and isotopic contribution complied with the FDA's recommended guidelines. This method provided accurate and precise measurement of total and unbound concentrations of DTG.
The following transitions (DTG m/z 420.2-277.0) were the most intense during infusion and in the mobile phase conditions. The results were consistent with transitions reported in previous [23-25]. These mobile-phase conditions were already being used in our laboratory to measure other
antiretrovirals in human plasma. Even if three other studies have used C18 [24-26] or another phenyl hexyl [23] stationary phase, we have chosen a stationary biphenyl phase because of its ability to develop π--π interactions with aromatic structures. This allows it to retain both hydrophilic and hydrophobic compounds, like other antiretrovirals, as measured in our laboratory.
Our mobile-phase conditions were both similar [24] and quite different [23,25,26] than other described methods. We preferred methanol to acetonitrile as the organic solvent, as the latter impedes the π--π interactions between the biphenyl stationary phase and the analytes, which results in decreased aromatic retention.
Version postprint
ACCEPTED MANUSCRIPT
Extraction recoveries were equivalent to those observed with the protein-precipitation method [23,26]. Two others methods of DTG quantification in plasma have low extraction recoveries but these
methods used liquid--liquid extraction [24] or on-line solid-phase extraction [23]. Regarding the unbound concentration method, as the dialysate contains phosphate buffer, which is a non-volatile salt and provides ion suppression [16], a matrix effect for unbound-DTG was observed. However, this matrix effect had no impact on DTG quantification as (i) we used a deuterated internal standard that became ionized in the same way, and (ii) our calibration curve was linear and reproducible. This result stresses the significance of using a stable isotope-labeled internal standard to avoid an undesired matrix effect.
No desynchronization between DTG and DTG-d4 areas was observed for unbound or total
concentrations while increasing the DTG calibration concentration, excluding the possible competition between DTG and DTG-d4 during the ionization step, as observed by Aouri et al[27] with rilpivirine, another antiretroviral. The internal-standard area did not increase with DTG concentration increased in our study, but this has not been reported in studies on DTG measurement using LC-MS/MS [23-26]. In our study, low variability in the calibration slope allowed us to run plasma samples without systematic calibration, as samples series being framed by quality control.
Precision of the three levels of quality control were similar, both within and between days, for both unbound and total concentrations, and were close to those reported in other studies [23-26], showing the ruggedness of this method over the calibration range.
The results on stability have not been described in other studies [25,26] , or have not been fully detailed to follow FDA guidelines [23,24]. No decomposition of DTG was expected as the results of stability were lower than 15%. Thus, it can be concluded that DTG is not degraded at room
temperature, at +4°C, at -20°C, or after three freeze--thaw cycles, and that plasma samples containing DTG can be stored under these conditions.
Results from the dilution experiment demonstrated the ability to accurately quantify DTG in both unbound and total concentrations, regardless of whether the concentrations were diluted. However, few of the plasma samples from HIV patients needed dilution as most of the data were within the calibration ranges for both unbound and total concentrations.
Version postprint
ACCEPTED MANUSCRIPT
The major DTG metabolism pathway includes UGT1A1, to produce a glucuronide metabolite, which represents 18.9% of total DTG in human plasma [28], and thus has a low probability of analytical interference. This was confirmed in a study by Grégoire et al [23], who reported no interference by glucuronide on DTG measurements, with or without using glucuronidase.
The chromatographic method developed in our study is suitable for routine hospital use for DTG therapeutic-drug monitoring. Indeed, plasmatic or dialysate, as well as chromatographic tests, are quicker than the LC method using an UV detector [29,30]. Moreover, the use of a deuterated internal standard allowed us to avoid any possible matrix effects, such as those observed with phosphate buffer and the unbound concentration. Finally, the low Cu value for DTG requires the use of an MS detector to achieve the required sensitivity level, which is difficult to achieve using a UV detector [29,30]. The first step to validate the unbound fraction through ED is to establish the time needed to reach binding equilibrium. Using our method, it was obtained after 4 hours of dialysis. To date, no study has described the ED procedure to evaluate the unbound fraction of integrase strand transfer inhibitors. Nevertheless, for the protease inhibitors lopinavir and nelfinavir [31,32], assessment of the unbound fraction by ED showed that the time needed to reach binding equilibrium was close to that observed with DTG in our study. Two studies [25,33]have explored the unbound fraction of DTG in HIV-seronegative subjects using high-throughput equilibrium dialysis. Even though this procedure is dissimilar to ours, the time to reach equilibrium was adjusted at 5 h, which was a similar timespan to ours. In our study, the short time needed to reach equilibrium allowed us to avoid a dilution effect that could be caused during longer term ED [13]. Non-specific binding during dialysis (dialysis membrane, plastic recipients) is thus negligible [18].
The composition of the ED device, in particular the Teflon cells, allowed us to avoid major non-specific binding. The lack of non-non-specific binding was one of the factors that made ED the reference method to evaluate the unbound form of a drug.
Dolutegravir remained stable in the various pre-analytical short and longer term thermal conditions, even at low concentrations (i.e., LCQ of the unbound form). In our study, evaluation of stability of DTG binding was also performed: binding remained unchanged for five days at +4°C and after three
Version postprint
ACCEPTED MANUSCRIPT
freeze--thaw cycles. This makes it easier to include the analysis for both total and unbound DTG concentrations in routine hospital laboratory practice.
From this stability study, we deduce that DTG binding to plasmatic protein was not sensitive to changes in pH, even though it has been suggested that pH may increase after freezing and thawing [34]. Because some molecules may be sensitive to pH fluctuations, even on a small scale [35], it was necessary to assess this pre-analytical parameter during bioanalysis validation, in particularly the binding stability at different storage temperatures. Moreover pH fluctuations were not an issue during ED analysis, as the S
ö
rensen buffer stabilized the physiological pH of both the plasma and buffer chambers [13].To date, there are no data on the stability of DTG-protein binding. The only two studies [25,33]that have described this assay, did not detail binding stability. There are no data for other integrase strand transfer inhibitors. The unbound form was also studied for raltegravir [36], but the authors did not detail the stability of storage binding.
The anticoagulant used in plasma samples is rarely if ever described in studies on the unbound form of DTG [25,33]. However, an effect between citrated and heparinized plasma was observed in our study. Indeed, for high DTG concentration (4 mg/L), citrated plasma increased the fu results compared to heparinized plasma. We also found a trend with low DTG concentration (1 mg/L), with higher fu values from citrated plasma. Because citrate is not known to bind to albumin, it could be hypothesized that citrate interferes with DTG-protein binding, decreasing the affinity constant of DTG for plasmatic protein or competing with plasma proteins for DTG binding. To date, no study has yet explored the influence of anticoagulants on protein binding in DTG or any other drug. As the effect of sampled anticoagulant was consistent in the unbound form of DTG, it seems essential to include this parameter when exploring the unbound fraction. Detail on anticoagulant sampling should be described in further articles describing unbound form exploration for any drug.
Hemolysis can occur during sampling, for example when the tourniquet is too tight or when the sample is poorly preserved prior to centrifugation [37-39]. This parameter is known to interfere with the biochemical analyses, either by inhibiting an enzymatic reaction or by interfering with the
Version postprint
ACCEPTED MANUSCRIPT
no variability in total concentrations was observed at the same concentration level (1 or 4 mg/L). Thus, it could be deduced that hemolysis influenced DTG-plasmatic protein binding.
Schuhmacher et al. [41,42) conducted a study on highly lipidic bound drugs and their repartition between plasmatic water, plasmatic proteins, and erythrocytes. These researchers recommended avoiding hemolysis when exploring unbound form exploration to avoid erroneous results. They hypothesized that drug binding was redistributed on the released hemoglobin and intra-erythrocyte components exposed by hemolysis, thus resulting in an increase in the bound drug and a decrease in the unbound form. In contrast, we observed an increase in the unbound concentration, and thus an increase in the unbound fraction. Nevertheless, the impact of the release of intra-erythrocyte compounds on protein binding could be questioned as, besides hemoglobin, erythrocytes contain several structural proteins, enzymes, lipids, and carbohydrates [43] which could interfere with DTG protein binding.Indeed, several studies have described a decrease in drug-binding secondary to an increase in some physiologically active molecules, such as uremia compounds or fatty acids [44,45]. Moreover, Snyder et al [46] reported that hemolysis could inhibit antibody/substrate binding in some clinical biochemistry assays, as drug--protein binding.
Thus, two kinds of binding inhibition could occur during hemolysis: (i) competitive inhibition between the release of intra-erythrocyte compounds and DTG on the plasmatic protein-binding site, or (ii) non-competitive inhibition where intra-erythrocyte compounds decrease the binding affinity between DTG and plasmatic proteins.Spectrophotometric analysis of hemolysis could be too restrictive to easily analyze the unbound form of DTG. As hemolysis can be detected in 0.2 g/dL of hemoglobin, the samples have to be rejected if pink coloration is observed. Nevertheless, assessing hemolysis needs to be included during bioanalytical validation of unbound form.
Equilibrium dialysis has some disadvantages compared to other methods, such as ultrafiltration. Firstly, this method is time consuming, both in assay preparation and time of dialysis, which here was still short. Secondly, it is necessary to use a large amount of plasma (1 mL in our study). In contrast, ultrafiltration is a convenient and quick method that requires only a small amount of plasma (250 or 500 µL). Thus, it is preferable to use ultrafiltration if the unbound form is going to be explored during routine therapeutic drug monitoring. However, the existence of interference from ultrafiltration
Version postprint
ACCEPTED MANUSCRIPT
devices requires a first step of bioanalysis validation, based on equilibrium dialysis, which is the gold-standard method for drug-binding studies, especially when exploring the pre-analytical conditions that may interfere with unbound fractions.
Huge inter-individual variability has been described for both total and unbound DTG concentrations in samples from HIV patients' plasma. The high inter-individual variability of the unbound concentration is one of the first steps seen when including DTG in therapeutic drug monitoring [47]. Indeed, it could explain the toxicity or efficacy discrepancies when compared to total concentrations, as observed with protease inhibitors during pregnancy [48].
The unbound concentration of DTG varies with dosing interval (maximum to minimal concentrations). Therefore, it is hazardous to compare unbound concentrations between studies. However, the fu does not vary with dosing interval[9] and could be used to compare results between studies. Imaz et al [10] evaluated DTG fu using a technique similar to ED, known as high-throughput dialysis equilibrium, and found similar results to ours (our fu was 0.46%, Imaz et al.'s was 0.42%). Unfortunately, we were not able to compare our results with other studies that used ED-like procedures [25,33]as these (i) evaluated DTG fu on healthy subjects and (ii) the HIV-seronegative subjects present different DTG pharmacokinetic profile compared to HIV patients [49].
Conclusion
Developed method allowed accurate measurement of unbound and total dolutegravir concentrations. Nor non-specific binding or conservation steps did influence fu results. On the contrary,
anticoagulants from samples and hemolysis influenced fu results and could lead to a misinterpretation. The high inter-individual variability observed in the unbound form from HIV patients was a first step towards integrating dolutegravir TDM.
Version postprint
ACCEPTED MANUSCRIPT
Conflict of interest
M.D. received from Bristol-Myers Squibb, Janssen-Cilag, Gilead Sciences, and ViiV Healthcare travel grants and fees for public speaking. The other authors have no financial interests to declare.
Funding
This research did not receive any specific grant from funding agencies in the public, commercial, or not-for-profit sectors
References
[1] S. Min, L. Sloan, E. DeJesus, T.Hawkins, L.McCurdy, I. Song, R. Stroder, S. Chen, M. Underwood, T. Fujiwara, S. Piscitelli, J. Lalezari. Antiviral activity, safety, and
pharmacokinetics/pharmacodynamics of dolutegravir as 10-day monotherapy in HIV-1-infected adults. AIDS. 25 (2011) 1737-1745.
[2] I. Song, K. Adkison, M. Lovern, J. Chiu, J. Huang, C. Vavro, M. Ait-Khaled, B. Wynne, S. Min. Pharmacokinetic-Pharmacodynamic Modeling & Simulation of the Virologic Response of Dolutegravir in HIV-Infected Patients with Integrase Inhibitor Resistant Virus 16th International Workshop on Clinical Pharmacology of HIV and Hepatitis Therapy 2015; Washington, DC. Abstract #14
[3] C. Katlama, C. Soulié, F. Caby, A. Denis, C. Blanc, L. Schneider, M.A. Valantin, R. Tubiana, M. Kirstetter, E. Valdenassi, T. Nguyen, G. Peytavin, V. Calvez, A.G. Marcelin. Dolutegravir as monotherapy in HIV-1-infected individuals with suppressed HIV viraemia. J. Antimicrob. Chemother. 71 (2016) 2646-2650.
[4] I.H. Song, S. Chen, S. Piscitelli, S. Min Pharmacokinetics (PK) and PK-pharmacodynamic (PD) relationship of dolutegravir (DTG) in int grase inhibitor (INI)-naïve subjects, abstr A-1573. 53rd ICAAC, 10 to 13 September 2013, Denver, CO.
[5] J. Zhang, S. Hayes, B.M. Sadler, I. Minto, J. Brandt, S. Piscitelli, S. Min, I.H. Song. Population pharmacokinetics of dolutegravir in HIV-infected treatment-naive patients. Br. J. Clin. Pharmacol. 80, 502-514 (2015).
Version postprint
ACCEPTED MANUSCRIPT
[6] M.G. de Boer, G.E. van den Berk, N. van Holten, J.E. Oryszcyn, W. Dorama, D.A. Moha, K. Brinkman. Intolerance of dolutegravir-containing combination antiretroviral therapy regimens in real-life clinical practice. AIDS. 30, 2831-2834 (2016).
[7] A. Menard, C. Montagnac, C. Solas, L. Meddeb, C. Dhiver, C. Tomei, I. Ravaux, H. Tissot-Dupont, S. Mokhtari, P. Colson, A. Stein. Neuropsychiatric adverse effects on dolutegravir: an emerging concern in Europe. AIDS. 31 (2017) 1201-1203.
[8] M. Rowland, T.N. Tozer. Clinical Pharmacokinetics: Concepts and Applications, Williams & Wilkins, Baltimore, 1995.
[9] S.L. Letendre, A.M. Mills, K.T. Tashima, D.A. Thomas, S.S. Min, S. Chen, I.H. Song, S.C. Piscitelli; extended ING116070 study team. ING116070: a study of the pharmacokinetics and antiviral activity of dolutegravir in cerebrospinal fluid in HIV-1-infected, antiretroviral therapy-naive subjects. Clin. Infect. Dis. 59 (2014) 1032-1037.
[10] A. Imaz, J. Martinez-Picado, J. Niubó, A.D. Kashuba, E. Ferrer, D. Ouchi, C. Sykes, N. Rozas, L. Acerete, J. Curto, A. Vila, D. Podzamczer. HIV-1-RNA Decay and Dolutegravir Concentrations in Semen of Patients Starting a First Antiretroviral Regimen. J. Infect. Dis. 214 (2016) 1512-1519. [11] M.L. Cottrell, T. Hadzic, A.D. Kashuba. Clinical pharmacokinetic, pharmacodynamic and
drug-interaction profile of the integrase inhibitor dolutegravir. Clin. Pharmacokinet. 52 (2013) 981-994. [12] J.B. Pain, M.P. Lê, M. Caseris, C. Amiel, L. Lassel, C. Charpentier, A. Desnoyer, C. Farnoux, G.
Pialoux, D. Descamps, G. Peytavin. Pharmacokinetics of dolutegravir in a premature neonate after HIV treatment intensification during pregnancy. Antimicrob. Agents Chemother. 59 (2015) 3660-3662.
[13] Nilsson L.B. The bioanalytical challenge of determining unbound concentration and protein binding for drugs. Bioanalysis. 5 (2013) 3033-3050.
[14] S.M. Illamola, D. Hirt, J.M. Tréluyer, S. Urien, S. Benaboud. Challenges regarding analysis of unbound fraction of highly bound protein antiretroviral drugs in several biological matrices: lack of harmonisation and guidelines. Drug Discov. Today. 20 (2015) 466-474.
Version postprint
ACCEPTED MANUSCRIPT
[15] FDA. Homepage, guidance for industry: bioanalytical method validation. http://www.fda.gov/downloads/Drugs/GuidanceComplianceRegulatory Information/Guidances/UCM070107.pdf, 2017 (accessed 19.08.17).
[16] B.K. Matuszewski, M.L. Constanzer, C.M. Chavez-Eng. Strategies for the Assessment of Matrix Effect in Quantitative Bioanalytical Methods Based on HPLC−MS/MS. Analytical Chemistry. 75 (2003) 3019-3030.
[17] SWGTOX Standard Practices for Method Validation in Forensic Toxicology Laboratories, available at: http://www.swgtox.org/documents/Validation3.pdf, 2017 (accessed 19.08.17). [18] C. Arellano, P. Gandia, T. Lafont, R. Jongejan, E. Chatelut. Determination of unbound fraction of
imatinib and N-desmethyl imatinib, validation of an UPLC-MS/MS assay and ultrafiltration method. J. Chromatogr. B Analyt. Technol. Biomed. Life Sci. 907 (2012) 94-100.
[19] G. Lippi, D. Giavarina, M. Gelati, G.L . Salvagno. Reference range of hemolysis index in serum and lithium-heparin plasma measured with two analytical platforms in a population of unselected outpatients. Clin. Chim. Acta. 429 (2014) 143-146.
[20] French Code of Public Health—Article L1121-1. [21] French Code of Public Health—Article L1121-2.
[22] R Development Core Team (2008). R: A language and environment for statistical computing. R Foundation for Statistical Computing, Vienna, Austria. ISBN 3-900051-07-0, URL:
http://www.R-project.org. , 2017 (accessed 19.08.17).
[23] M. Grégoire, G. Deslandes, C. Renaud, R. Bouquié, C. Allavena, F. Raffi, P. Jolliet, E. Dailly. A liquid chromatography-tandem mass spectrometry assay for quantification of rilpivirine and dolutegravir in human plasma. J. Chromatogr. B. Analyt. Technol. Biomed. Life Sci. 971 (2014) 1-9.
[24] S.D. Penchala, S. Fawcett, L. Else, D. Egan, A. Amara, E. Elliot, E. Challenger, D. Back, M. Boffito, S. Khoo. The development and application of a novel LC-MS/MS method for the measurement of Dolutegravir, Elvitegravir and Cobicistat in human plasma. J. Chromatogr. B Analyt. Technol. Biomed. Life Sci. 1027 (2016) 174-180.
Version postprint
ACCEPTED MANUSCRIPT
[25] I.H. Song, J. Borland, P.M. Savina, S. Chen, P. Patel, T. Wajima, A.F. Peppercorn, S.C. Piscitelli. Pharmacokinetics of Single-Dose Dolutegravir in HIV-Seronegative Subjects With Moderate Hepatic Impairment Compared to Healthy Matched Controls. Clin. Pharmacol. Drug Dev. 2 (2013) 342-348.
[26] C. Bennetto-Hood, G. Tabolt, P. Savina, E.P. Acosta. A sensitive HPLC-MS/MS method for the determination of dolutegravir in human plasma. J. Chromatogr. B Analyt. Technol. Biomed. Life Sci. 945-946 (2014) 225-232.
[27] M. Aouri, A. Calmy, B. Hirschel, A. Telenti, T. Buclin, M. Cavassini, A. Rauch, L.A. Decosterd. A validated assay by liquid chromatography-tandem mass spectrometry for the simultaneous quantification of elvitegravir and rilpivirine in HIV positive patients. J. Mass Spectrom. 48 (2013) 616-625.
[28] S. Castellino, L. Moss, D. Wagner, J. Borland, I. Song, S. Chen, Y. Lou, S.S. Min, I. Goljer, A. Culp, S.C. Piscitelli, P.M. Savina. Metabolism, excretion, and mass balance of the HIV-1
integrase inhibitor dolutegravir in humans. Antimicrob. Agents Chemother. 57 (2013) 3536-3546. [29] V. Cozzi, N. Charbe, S. Baldelli, S. Castoldi, C. Atzori, D. Cattaneo, E. Clementi. Development
and Validation of a Chromatographic Ultraviolet Method for the Simultaneous Quantification of Dolutegravir and Rilpivirine in Human Plasma. Ther. Drug Monit. 38 (2016) 407-413.
[30] X. Wang, S.D. Penchala, A. Amara, L. Else, M. McClure, M. Boffito. A Validated Method for Quantification of Dolutegravir Using Ultra Performance Liquid Chromatography Coupled With UV Detection. Ther. Drug Monit. 38 (2016) 327-331.
[31] M. Boffito, P.G. Hoggard, W.E. Lindup, S. Bonora, A. Sinicco, S.H. Khoo, G. Di Perri, D.J. Back. Lopinavir protein binding in vivo through the 12-hour dosing interval. Ther. Drug Monit. 26 (2004) 35-39.
[32] C. Herforth, J.A. Stone, A.L. Jayewardene, T.F. Blaschke, F. Fang, T. Motoya, F.T. Aweeka. Determination of nelfinavir free drug concentrations in plasma by equilibrium dialysis and liquid chromatography/tandem mass spectrometry: important factors for method optimization. Eur. J. Pharm. Sci. 15 (2002) 185-195.
Version postprint
ACCEPTED MANUSCRIPT
[33] S. Weller, J. Borland, S. Chen, M. Johnson, P. Savina, B. Wynne, T. Wajima, A.F. Peppercorn, S.C. Piscitelli. Pharmacokinetics of dolutegravir in HIV-seronegative subjects with severe renal impairment. Eur. J. Clin. Pharmacol. 70 (2014) 29-35.
[34] A. Fura, T.W. Harper, H. Zhang, L. Fung, W.C. Shyu. Shift of pH of biological fluids during storage and processing: effect on bioanalysis. J. Pharm. Biomed. Ana. 32 (2003) 513–522.
[35] C.J. Kilpatrick, S. Wanwimolruk, L.M. Wing. Plasma concentrations of unbound phenytoin in the management of epilepsy. Br. J. Clin. Pharmacol. 17 (1984) 539-546.
[36] C. Barau, V. Furlan, Y. Yazdanpanah, C. Fagard, J.M. Molina, A.M. Taburet, A. Barrail-Tran. Characterization of binding of raltegravir to plasma proteins. Antimicrob. Agents Chemother. 57 (2013) 5147-5150.
[37] S. Saleem, V. Mani, M.A. Chadwick, S. Creanor, R.M. Ayling. A prospective study of causes of haemolysis during venepuncture: tourniquet time should be kept to a minimum. Ann. Clin. Biochem. 46 (2009) 244-246.
[38] M.S. Grant. The effect of blood drawing techniques and equipment on the hemolysis of ED laboratory blood samples. J. Emerg. Nurs. 29 (2003) 116-121.
[39] S.O. Sowemimo-Coker. Red blood cell hemolysis during processing. Transfus. Med. Rev. 16 (2002) 46–60.
[40] O. Sonntag. Haemolysis as an interference factor in clinical chemistry. J. Clin. Chem. Clin. Biochem. 24 (1986) 127-139.
[41] J. Schuhmacher, K. Bühner, A. Witt-Laido. Determination of the free fraction and relative free fraction of drugs strongly bound to plasma proteins. J. Pharm. Sci. 89 (2000) 1008–1021. [42] J. Schuhmacher, C. Kohlsdorfer, K. Bühner, T. Brandenburger, R. Kruk. High-throughput
determination of the free fraction of drugs strongly bound to plasma proteins. J. Pharm. Sci. 93 (2004) 816-830.
[43] E.M. Pasini, H.U. Lutz, Mann M., A.W. Thomas. Red blood cell (RBC) membrane proteomics--Part I: Proteomics and RBC physiology. J. Proteomics. 73 (2010) 403-420.
Version postprint
ACCEPTED MANUSCRIPT
[44] C.J. Bowmer, W.E. Lindup. Decreased drug binding in uraemia: effect of indoxyl sulphate and other endogenous substances on the binding of drugs and dyes to human albumin. Biochem. Pharmacol. 31 (1982) 319-323.
[45] J.A. Anguizola, S.B. Basiaga, D.S. Hage. Effects of Fatty Acids and Glycation on Drug Interactions with Human Serum Albumin. Curr. Metabolomics. 1 (2013) 239-250.
[46] J.A. Snyder, M.W. Rogersb, M.S. Kingb, J.C. Phillipsb, J.F. Chapmana, C.A. Hammett-Stablera. The impact of hemolysis on Ortho-Clinical Diagnostic’s ECi and Roche’s elecsys immunoassay systems. Clin. Chim. Acta. 348 (2004) 181-187.
[47] R.E. Aarnoutse, J.M. Schapiro, C.A. Boucher, Y.A. Hekster, D.M. Burger. Therapeutic drug monitoring: an aid to optimising response to antiretroviral drugs? Drugs. 63 (2003) 741-753. [48] D. Metsu, P.L. Toutain, E. Chatelut, P. Delobel, P. Gandia. Antiretroviral unbound concentration
during pregnancy: piece of interest in the puzzle? J. Antimicrob. Chemother. [Epub ahead of print] (2017).
[49] P.L. McCormack. Dolutegravir: a review of its use in the management of HIV-1 infection in adolescents and adults. Drugs. 74 (2014) 1241-1252.
Version postprint
ACCEPTED MANUSCRIPT
Figures legends:
Figure 1: Representative chromatograms of total and unbound dolutegravir (DTG) in blank
plasma (left/a), extracted lower limit of quantification (center/b), internal standard (right/c).
MRM transition
(m/z)
Precursor ion
product ion
Retention
time (min)
DP
(V)
EP
(V)
CEP
(V)
CE
(eV)
CXP
(V)
Dolutegravir
420.2--277.0
0.75
61
10
10
37
10
Dolutegravir-d4
424.2--279.0
0.73
Table 1: Multiple-reaction mode (MRM) transitions used to detect analytes, DP, EP, CEP,
CE, and CXP for API 4500, and retention times for the biphenyl HPLC column.
DP:
de-clustering potential, EP: entrance potential, CEP: cell-entrance potential, CE: collision energy,
CXP: and cell-exit potential.
Version postprint
ACCEPTED MANUSCRIPT
Analyte
Nominal concentrati on (ng/mL) Mean calculated concentration (ng/mL)%
CV
%
Accuracy
Slope
Intercept
r
Total
dolutegravir
50
41
14.61
-18.36
1.7240±
0.08
0.0733
±0.02
0.9988
125
133
2.76
6.4
500
541
2.47
8.16
2000
2068
7.74
3.4
4000
4064
4.67
1.6
10000
9834
3.42
-1.66
Unbound
dolutegravir
0.5
0.56
7.32
11.68
0.0715
±0.05
0.1140
±0.01
0.9981
1
1.07
5.12
7.32
5
4.44
3.87
-11.28
10
9.11
4.73
-8.86
50
49.98
7.96
-0.04
100
101.44
4.25
1.44
Table 2: Summary of calibration-curve standards.
. CV: coefficient of variation; r²: coefficient of determination.Version postprint
ACCEPTED MANUSCRIPT
Nominal
concentration
(ng/mL)
Intra-day
Inter-day
Precision
a(%
CV)
Accuracy
b(% bias)
Precision
a(%
CV)
Accuracy
b(% bias)
Total DTG
150
1.73
0.40
5.77
-2.00
1500
1.52
13.87
6.93
10.60
7500
1.28
12.88
6.23
8.23
Unbound
DTG
1.5
3.05
6.00
7.09
10.20
15
4.72
5.33
4.38
1.20
75
3.86
10.51
6.37
10.60
Table 3: Precision and accuracy of method used to measure total and unbound dolutegravir. a Expressed as the coefficient of variance for the peak area ratios of the analyte/internal standard. b Calculated as [(mean calculated concentration − nominal concentration)/nominal concentration] × 100.
Version postprint
ACCEPTED MANUSCRIPT
Dilution 1/5
Dilution 1/10
Total DTG
Unbound
DTG
Total DTG
Unbound
DTG
Theoretical concentration
(ng/mL)
20,000
200
20,000
200
Mean
19,367
196.10
19,383
188.20
SD
52.7
3.01
54.6
4.66
Precision (CV)
2.72
1.53
2.81
2.48
Accuracy %
96.83
98.05
96.92
94.1
Version postprint
ACCEPTED MANUSCRIPT
Low QC (150 ng/mL)
High QC (7500 ng/mL)
Analyte
Experiment
% Accuracy
% CV
% Accuracy
% CV
Matrix stability
Total
dolutegravir
Bench-top, 3 h
-8.89
4.23
-4.92
1.18
Bench-top, 6 h
-8.00
4.37
-16.08
4.84
Freeze--thaw
(n=3 cycles)
-6.13
6.46
5.52
5.38
72 h, +4°C
3.03
3.03
1.39
3.14
Extracted stability
Autosampler,
4°C
3.00
2.77
11.24
1.28
Low QC (1,50 pg/mL)
High QC (75 pg/mL)
Analyte
Experiment
% Accuracy
% CV
% Accuracy
% CV
Matrix stability
Unbound
dolutegravir
Bench-top, 3 h
0.00
0.61
-12.62
2.51
Bench-top, 6 h
-0.67
1.15
-14.09
2.74
Freeze--thaw
(n=3 cycles)
6.89
1.30
-13.47
1.26
168 h, +4°C
14.22
2.08
10.18
1.03
Extracted stability
Autosampler,
4°C
0.00
1.63
10.80
2.69
Table 5: Unbound and total dolutegravir stability over time. QC: quality control; CV: coefficient of variation.
Version postprint
ACCEPTED MANUSCRIPT
Figure 1: Representative chromatograms of total and unbound DTG in blank plasma (left/a),
extracted LLOQ (center/b), internal standard (right/c).
Version postprint
ACCEPTED MANUSCRIPT
Version postprint
ACCEPTED MANUSCRIPT
Highlights
Analytical steps of a method evaluating DTG unbound form is detailed
Sampling anticoagulant and hemolysis were misinterpreting factors for unbound DTG HIV patients samples revealed a high inter-individual variability of unbound DTG