HAL Id: inserm-00137697
https://www.hal.inserm.fr/inserm-00137697
Submitted on 4 Sep 2009HAL is a multi-disciplinary open access archive for the deposit and dissemination of sci-entific research documents, whether they are pub-lished or not. The documents may come from teaching and research institutions in France or abroad, or from public or private research centers.
L’archive ouverte pluridisciplinaire HAL, est destinée au dépôt et à la diffusion de documents scientifiques de niveau recherche, publiés ou non, émanant des établissements d’enseignement et de recherche français ou étrangers, des laboratoires publics ou privés.
Differential role of transient receptor potential channels
in Ca2+ entry and proliferation of prostate cancer
epithelial cells.
Stephanie Thebault, Matthieu Flourakis, Karine Vanoverberghe, Franck
Vandermoere, Morad Roudbaraki, V’Yacheslav Lehen’Kyi, Christian
Slomianny, Benjamin Beck, Pascal Mariot, Jean-Louis Bonnal, et al.
To cite this version:
Stephanie Thebault, Matthieu Flourakis, Karine Vanoverberghe, Franck Vandermoere, Morad Roud-baraki, et al.. Differential role of transient receptor potential channels in Ca2+ entry and proliferation of prostate cancer epithelial cells.: Role of TRP Channels in Proliferation. Cancer Research, Amer-ican Association for Cancer Research, 2006, 66 (4), pp.2038-47. �10.1158/0008-5472.CAN-05-0376�. �inserm-00137697�
Differential role of TRP channels in Ca
2+entry and proliferation of prostate
cancer epithelial cells
Stephanie Thebault1, Matthieu Flourakis1*, Karine Vanoverberghe1*, Franck Vandermoere2,
Morad Roudbaraki1, Christian Slomianny1, Benjamin Beck1, Pascal Mariot1, Jean-Louis
Bonnal1, Brigitte Mauroy1, Yaroslav Shuba1,3, Thierry Capiod1, Roman Skryma1 and Natalia Prevarskaya1,4
1Laboratoire de Physiologie Cellulaire, INSERM EMI 0228 and 2Laboratoire de Biologie du
Développement UPRES EA 1033 et UMR 8576 CNRS, Université des Sciences et Technologies de Lille, 59655 Villeneuve d’Ascq, France
Running title: Role of TRP channels in proliferation
3Permanent address:
Bogomoletz Institute of Physiology, NASU, Bogomoletz Street, 4, 01024 Kiev, Ukraine * : These authors equally contributed to this work.
4Corresponding author:
Laboratoire de Physiologie Cellulaire, INSERM EMI 0228 Bâtiment SN3, Université des Sciences et Technologies de Lille 59655 Villeneuve d’Ascq Cedex France
Tel: (33) 3 20 33 60 18, Fax: (33) 3 20 43 40 66 E-mail: natacha.prevarskaya@univ-lille1.fr
ABSTRACT
One major clinical problem with prostate cancer is the cells’ ability to survive and proliferate upon androgen withdrawal. Since Ca2+ is central to growth control, understanding the
mechanisms of Ca2+ homeostasis involved in prostate cancer cell proliferation is imperative
for new therapeutic strategies. Here, we show that agonist-mediated stimulation of α1-adrenergic receptors (α1-ARs) promotes proliferation of the primary human prostate cancer epithelial (hPCE) cells by inducing store-independent Ca2+ entry and subsequent activation of NFAT (Nuclear Factor of Activated T cells) transcription factor. Such an agonist-induced Ca2+ entry (ACE) relied mostly on TRPC6 (Transient Receptor Potential Canonical) channels, whose silencing by antisense hybrid depletion decreased both hPCE cell proliferation and ACE. In contrast, ACE and related growth arrest associated with purinergic receptors (P2Y-R) stimulation involved neither TRPC6 nor NFAT. Our findings demonstrate that α1-AR signaling requires the coupled activation of TRPC6 channels and NFAT to promote proliferation of hPCE cells and thereby suggest TRPC6 as a novel potential therapeutic target.
Key words: prostate cancer/α1-AR (alpha1-adrenergic receptor)/Ca2+ entry/TRPC6/cell
INTRODUCTION
After androgen escape, the prostate tumor cell proliferation becomes independent of normal growth control mechanisms. As Ca2+ homeostasis is imperative in growth regulation, it is
important to understand how various growth factors, neurotransmitters and hormones, known to control physiological and pathological cell proliferation, participate in the maintenance of intracellular Ca2+ homeostasis. Although the nature of these agonists has yet to be well-established during prostate cancer progression, they invariably induce a Ca2+ entry called “agonist-induced Ca2+ entry” (ACE) (4, 6, 27, 30).
Despite α1-adrenoceptor (α1-AR) antagonists being already widely used for the clinical treatment of benign prostate hyperplasia (BPH) (5), the exact role of α1-AR-coupled signaling pathway in prostate cancer growth control remains unclear. Clinical studies have shown that α1-AR antagonists induce apoptosis in human prostate cancer epithelial and smooth muscle cells without affecting the cellular proliferation (20), in a way that seems to be independent of their effects on α1-AR (3, 19). In our previous study, using an androgen-dependent LNCaP (Lymph Node Carcinoma of the Prostate) cell line (17) as experimental model, we have demonstrated that α1-AR stimulation activates non-specific cationic channels leading to ACE (38).
Interestingly, we have also previously shown that in contrast to the stimulatory role of α1-ARs on prostate cancer cell growth, metabotropic purinergic receptors (P2Y-R) are involved in the growth arrest of DU-145 human prostate cancer cells (44). Such divergent effects of two receptors on cell proliferation are surprising, since both α1-AR and P2Y-R are known to be coupled to the common phospholipase C (PLC) catalyzed inositol phospholipids breakdown signaling pathway, via which α1-agonists and extracellular ATP are capable of inducing apparently similar increases in intracellular free Ca2+ ([Ca2+]i) (22, 25). The opposite
end effects on cell proliferation can only be explained if the ACE controlled by each receptor utilizes different but still undetermined Ca2+-permeable membrane channels ultimately destined to target various intracellular effectors. Currently, the members of the extensively studied transient TRP-channel family, especially TRPC subfamily (7), are considered as the most promising candidates as underlying various types of ACE, including ACE involved in proliferative cell activity (13, 14, 18, 26). However, the involvement of TRPs in mediating ACE, as well as the mechanisms of translation of generated Ca2+ signal into proliferative
activity of prostate cancer cells, is far from being understood.
The expression of genes involved in cell proliferation and cell death is regulated by nuclear transcriptional factors. NFAT (Nuclear Factor of Activated T cells) proteins represent a family of Ca2+-dependent transcription factors (8) whose activity is regulated by Ca2+/calmodulin-dependent protein phosphatase, calcineurin (8). Another ubiquitously expressed transcription factor is represented by the NF-kB (nuclear factor kappa B) family (21) which is known to be dependent on Ca2+ homeostasis, especially on the filling status of Ca2+ endoplasmic reticulum (ER) stores (7).
In the present study, we asked firstly whether the divergent effects on prostate cancer epithelial cell proliferation of ACE triggered by distinct membrane receptors via common signaling cascade, could be explained by different coupling efficiencies of Ca2+ entry pathways involved in either NFAT or NF-kB activation. Secondly, we wished to ascertain, if the latter were so, what type of membrane channels underlie these pathways. To this end, we used primary cultures of human prostate cancer epithelial (hPCE) cells established from resection specimens, which is much more relevant from practical perspectives than using cell lines. This allowed us to show for the first time that α1-AR stimulation enhances hPCE cells proliferation via a store-independent Ca2+ entry resulting in NFAT activation. We also show that α1-AR-stimulated Ca2+ entry mostly relies on TRPC6, which is a TRP-channel family
member, and that TRPC6 antisense knockout exerts effects similar to those of pharmacological α1-AR inhibition, i.e. suppression of ACE and consequent termination of hPCE cells proliferation. Furthermore, chronic hPCE cell treatment with α1-agonists enhances TRPC6 protein expression. In contrast, ACE associated with P2Y-R stimulation by extracellular ATP and related growth arrest involves neither TRPC6 channels activation nor NFAT translocation. Our findings demonstrate that the α1-AR-dependent Ca2+ signaling
which promotes hPCE cell proliferation specifically requires the activation of TRPC6 channels coupled to NFAT and thereby suggest TRPC6 as a novel potential therapeutic target for controlling prostate cancer cell proliferation.
MATERIALS AND METHODS
Primary culture. Human prostate specimens were mechanically dissociated and then
were cultivated in KSF medium (GIBCO-BRL), supplemented with 50 µg/ml bovine pituitary extract and 50 ng/ml EGF to specifically select epithelial cells. Each samples were analyzed by immunofluorescence staining to verify the epithelial markers expression (cytokeratin 14 and 18, (40), data not shown). The culture medium also contained 50000 IU/L penicillin and 50 mg/L streptomycin. Cells were routinely grown in 50 ml flasks (Nunc, Poly-labo) and kept at 37°C in a humidified incubator in an air/CO2 (95/5%) atmosphere. For electrophysiology
and calcium imagery experiments, the cells were subcultured in Petri dishes (Nunc) and used after 3 to 6 days. Each primary culture was only maintained for two weeks to prevent the lost of their differentiated phenotype.
We used specimens from 4 localized prostate cancers of Gleason score 8-10, prostate-specific antigen (PSA) level of ≥ 4.0 ng/ml and clinical tumor stage T2, from patients having undergone a radical prostatectomy. The cases were specifically selected on the criteria that the tumors were non-metastatic, and had no history of chemo- and/or anti-androgen therapy. Because of this, we believe that prostate cancer epithelial cells derived from the specimens used most likely represented androgen-dependent population. The presence of normal epithelial cells was highly unlikely, since cancerous nature of the specimens was independently confirmed by histological and anatomo-pathological analysis. All experimentations on patients tissues were performed according to the medical ethics under the agreement number “CP 01/33” delivered by the “Comité Consultatif de Protection des Personnes dans la Recherche Biomédicale de Lille” (CCPPRB).
Calcium imaging. [Ca2+]i was measured using fura-2 (the detailed procedure has been
KCl-6, CaCl2-2, MgCl2-2, HEPES-10, and glucose-12. For Ca2+-free HBSS, CaCl2 was
removed and EGTA (0.5 mmol/L) added.
Electrophysiology and solutions. Whole-cell patch-clamp techniques were used for
current recording, as detailed elsewhere (34, 43). The extracellular solution contained (in mmol/L): NMG - 150, CsCl – 20 or CaCl2 - 10, TEA(Cl) - 20, pH - 7.3 (adjusted with HCl).
The intracellular solution contained (in mM): NMG - 125, HCl - 10, MgCl2 - 1, CaCl2 – 2.6
(calculated [Ca2+]
free=100 nmol/L), HEPES - 10, EGTA - 8, and NaCl - 20 at pH-7.2 (adjusted
with glutamic acid).
RT-PCR analysis. Total RNA from the hPCE cells was isolated as previously detailed
(38). For the PCR reaction, specific sense and antisense primers were designed, based on GenBank hTRP sequences, using Genejockey II (Biosoft, Cambridge, UK) as listed in Table 1. In order to further identify the PCR- amplified products, each PCR band was extracted from the agarose gel and then subjected either to the restriction analysis using the specifique enzymes for each amplified fragment (for PCR products presented in Fig. 3) or subcloned in TA-cloning vector (Invitrogen) followed by the sequencing analysis (for PCR products presented, data not shown).
The sequences of selected oligonucleotides used as RT-PCR primers or as sense and antisenses are presented in Table I.
Transient transfection. For antisense assays, the sense (control) and antisense
oligonucleotides (Eurogentec) targeted against each TRPC (TRPC1, TRPC3, TRPC4 and TRPC6) were designed at the initiating ATG codon level (see Table I for sequences). The hPCE cells treated for up to 72h with either 0.5 µmol/L phosphorothioate antisense oligodeoxynucleotides (ODNs) and 2.5 µM cytofectin (GS 3815 to DOPE at a 2:1 molar ration, unsized) (Eurogentec) or sense ODNs by adding them directly to the culture medium. The ODNs transfection procedures were as detailed previously (42).
Cis-reporting systems (pNFAT-Luc plasmid, pNF-kBLuc plasmid and pCIS/CK negative control plasmid) were provided by Stratagene (Pathdetect® in Vivo Signal Transduction Pathway cis-Reporting Systems, United States). hPCE cells were maintained in DMEM-HG. Cells were plated in 6-well plates overnight, then transfected with the cis-reporting system selected using Geneporter-2 (Ozyme) in 2 ml serum-free DMEM-HG. After 8h, 2 ml serum-free media were added, containing either 10 µmol/L phenylephrin or 100 µmol/L ATP (Sigma).
Western-blot. TRPC6 and calnexin protein expression was assayed by Western-blot
with anti-TRPC6- (ACC-017, Alomone) and anti-calnexin- (SPA-860, Stressgen) specific antibodies, as described previously (43). Quantification of the bands intensity was performed by densitometry on Quantity-One software (Bio-Rad, Hercules, CA). For each experiments the signal intensity obtained for TRPC6 was normalized to calnexin value, as loading control.
Immunofluorescence staining. The cells were permeabilized in acetone at -20°C for 15
min. They were then placed on slides and blocked with 1.2% gelatin in PBS (PBSG) for 30 min, to avoid nonspecific binding, after which they were incubated overnight at 4° C, in 100% humidity, together with the primary antibodies for the cyclin-dependent kinase 4 (CDK4, NCL-CDK4-35 from Novocastra) and cyclin-dependent kinase inhibitor p27 (p27, sc-1641 from SantaCruz Technology) After several washes in PBSG, the slides were incubated at 37° C for one hour with FITC-labeled secondary antibodies (from Chemicon), washed in PBS and mounted in Mowiol. The sections were observed under a Zeiss Axiophot microscope equipped with epifluorescence (excitation: 450-490 nm, emission: 520 nm for FITC).
Luciferase assay. The cultures were harvested for luciferase activities 48 h after transfection. After cell lysis, the level of extracted luciferase from these cells was determined by bioluminescence measurement (Biocounter M1500 luminometer, Lumac, Netherlands) using the Luciferase Assay kit (Kit Galacto-LightTM, Tropix).
Proliferation assays. The CellTiter 96 AQueous Non-Radioactive Cell Proliferation
Assay (Promega Corporation) was used to determine the number of viable cells in proliferation. The assay has been described previously (38).
Data analysis. Each experiment was repeated several times and the results were
expressed as mean ± S.E.M. where appropriate. The data were analyzed and graphs were plotted using Origin 5.0 software (Microcal, Northampton, MA).
RESULTS
In the present research, we were interested in the details of Ca2+ signaling mechanisms coupled to α1 adrenoceptors (α1-AR) and P2Y-purinergic receptors (P2Y-R) in prostate cancer epithelial cells and their involvement in cell growth regulation.
α1-AR- and P2Y-R-coupled Ca2+ signaling involves different types of Ca2+ entry pathways in hPCE cells. Both α1-adrenergic and P2Y-purinergic receptors are known to stimulate PLC-catalyzed inositol phospholipids breakdown, resulting in the derivation of two secondary messengers important for Ca2+ signaling. These are inositol trisphosphate (IP
3) and
diacylglycerol (DAG). IP3 releases Ca2+ from intracellular stores, and the concomitant store
depletion activates Ca2+ influx via store-operated Ca2+ channels (SOCs), whereas DAG is capable of inducing Ca2+ entry by directly gating some cationic Ca2+-permeable membrane channels. Interplay among various sources of Ca2+ largely determines the profile of intracellular Ca2+ concentration.
Thus, as the first step in our study we sought to examine the specifics of [Ca2+]i signals
elicited by the stimulation of each receptor in hPCE cells. This was done on the basis of fluorimetric [Ca2+]i measurements on hPCE cells loaded with Ca2+ indicator fura-2AM in
response to the bath applications of an α1-specific agonist, phenylephrine (PHE), or a purinergic receptor agonist, ATP.
Fig. 1A shows that PHE (10 µmol/L) elicited regular slow intracellular Ca2+ oscillations.
The quantification of the amplitude and temporal parameters of these oscillations (n=67 cells) provided the Ca2+ wave peak value of 512±43 nM, the average wave duration of 2.18±0.13
min and the average period of wave generation of 4.2±1.06 min. PHE-evoked [Ca2+] i
oscillations were strictly dependent on extracellular Ca2+ ([Ca2+]out) completely vanishing
upon its withdrawal (Fig. 1A), thereby suggesting the absolute requirement of Ca2+ influx across the plasma membrane for their support. Moreover, first time PHE application in Ca2+
-free solution did not cause the mobilization of intracellularly stored Ca2+ usually manifested by transient [Ca2+]i elevation (Fig. 1B, n=98), hence indicating the poor accessibility of IP3
-dependent stores for α1-AR-triggered signaling and pointing to DAG as a major messenger in this signaling pathway.
Consistent with this notion and in a full agreement with our previous studies (37, 38), the application of 1-oleoyl-2-acetyl-sn-glycerol (OAG, 100 µmol/L) – a membrane-permeable DAG analog – exactly mimicked PHE action in terms of inducing [Ca2+]out-dependent [Ca2+]i
oscillations (Fig. 1C). OAG-induced oscillations even had the same amplitude (546±39 nM, n=79), duration (1.81±0.22 min) and period (3.1±0.9 min) as the PHE-induced ones, suggesting common mechanisms downstream from DAG and basically ruling out any essential involvement in the IP3-dependent processes.
In contrast to the observations with PHE and OAG, ATP (100 µmol/L) evoked a large transient [Ca2+]i increase (763±25 nM, n=93) followed by a sustained plateau on a
considerably lower level (Fig. 1D). This plateau was sensitive to extracellular Ca2+ removal consistent with its Ca2+ influx nature (Fig. 1D). When ATP was initially administered in the Ca2+-free solution, it caused only a transient [Ca2+]i elevation of 580±28 nM (n=64) without a
plateau, as one would expect for pure intracellular Ca2+ mobilization (Fig. 1E). The
reintroduction of Ca2+ in the continuing presence of ATP produced a rapid [Ca2+] i rise
followed by a slow decline (Fig. 1E), probably reflecting the Ca2+-dependent inactivation
mechanism of underlying membrane Ca2+ influx channels. Thus, experiments with ATP
provide clear evidence for the contribution of both Ca2+ release and Ca2+ entry in overall
[Ca2+]i, and suggest that P2Y-R-controlled Ca2+ signaling mostly recruits IP3- and
store-dependent processes in hPCE cells.
Altogether, the results on [Ca2+]i measurements strongly suggest that Ca2+ entry
membrane channels, whereas P2Y-R-mediated signaling engages plasma membrane SOCs, which are activated upon IP3-dependent Ca2+ store depletion.
Differential store-dependency of phenylephrine- and ATP-stimulated ACE. To obtain
more direct evidence of the differing store-dependency and origin of Ca2+ entry pathways
involved in α1-AR- and P2Y-R-mediated signaling we used several approaches. In the first one we tested for PHE and ATP effects on the background of the ER Ca2+ store depletion produced by thapsigargin (TG) – a known store-depleting agent acting via inhibition of SERCA-pump Ca2+ uptake. In the second, we examined the impact of IP3 receptor inhibition
by heparin on the ability of PHE and ATP to activate membrane currents. Finally, in the third, we screened a number of blockers of various types of native cationic channels and TRP members on their ability to inhibit PHE- and ATP-induced [Ca2+]i responses.
In the experiments with TG we applied it first in Ca2+-free solution to liberate
intracellularly stored Ca2+ and then we re-added Ca2+ to initiate store-operated Ca2+ entry
(SOCE). As Fig. 2A shows, if PHE was applied during TG-induced SOCE, it was still able to activate characteristic Ca2+ oscillations on top of SOCE (n=61). In contrast, the same type of
ATP application failed to produce any change in [Ca2+]
i on top of TG-induced SOCE (Fig.
2B, n=63).
The inclusion of the IP3-receptor antagonist heparin (0.1 g/L) in the intracellular pipette
solution used in the whole-cell patch-clamp experiments had no effect on the ability of PHE to activate membrane current (Fig. 2C), but totally abrogated ATP-evoked current (Fig. 2D) (n=5-11). PHE and ATP both activated inwardly rectifying membrane currents: I-V relationships for both currents are presented in inset of Fig.2C and 2D. PHE-evoked current reached its full amplitude in about 2.0±0.7 min and its average density was 11±1.5 pA/pF at Vm=-100 mV (n=11) whereas the average density of ATP-induced current, which reached its
We also compared the effects of such widely used inhibitors of store-dependent and store-independent membrane Ca2+ transport as 2-aminoethoxydiphenyl borate (2-APB), La3+, MDL, flufenamate and SK&F 96365 on PHE- and ATP-induced Ca2+ entry. Given that none of the drugs used was able to affect the temporal parameters of PHE-induced [Ca2+]
i
oscillations, their effectiveness was evaluated on the basis of their ability to reduce either the amplitude of oscillations in the event of PHE, or maximal [Ca2+]
i elevation following Ca2+
re-addition (as presented in Fig. 1E) in the event of ATP. As one can see in Fig. 2E (n=95-102), all agents except for 2-APB at low (10 µmol/L) concentration, strongly inhibited the ATP-induced response. They exerted virtually no effect on the PHE-ATP-induced one except for the SK&F 96365, which blocked the response to PHE by about 50%. Such divergent sensitivity is again consistent with the substantial role played by store-dependent processes in ATP actions, but not in those of PHE, since all the agents used are generally known to be more specific to store-operated channels than to other types of cationic channels. Moreover, although 2-APB effects can block both IP3 receptors and SOCs (11), its ability to stimulate ATP response at a
low concentration (10 µmol/L) and to inhibit it at a high concentration (100 µmol/L, see Fig. 2E) agrees closely with the known dual, potentiation-inhibition 2-APB action on SOCs (11).
Thus, our results unequivocally demonstrate that in hPCE cells, ATP-stimulated P2Y-R-coupled Ca2+ signaling involves Ca2+ entry via store-operated membrane channels, whereas PHE-stimulated α1-AR-coupled Ca2+ signaling involves Ca2+ entry via store-independent
DAG-gated Ca2+ permeable cationic channels.
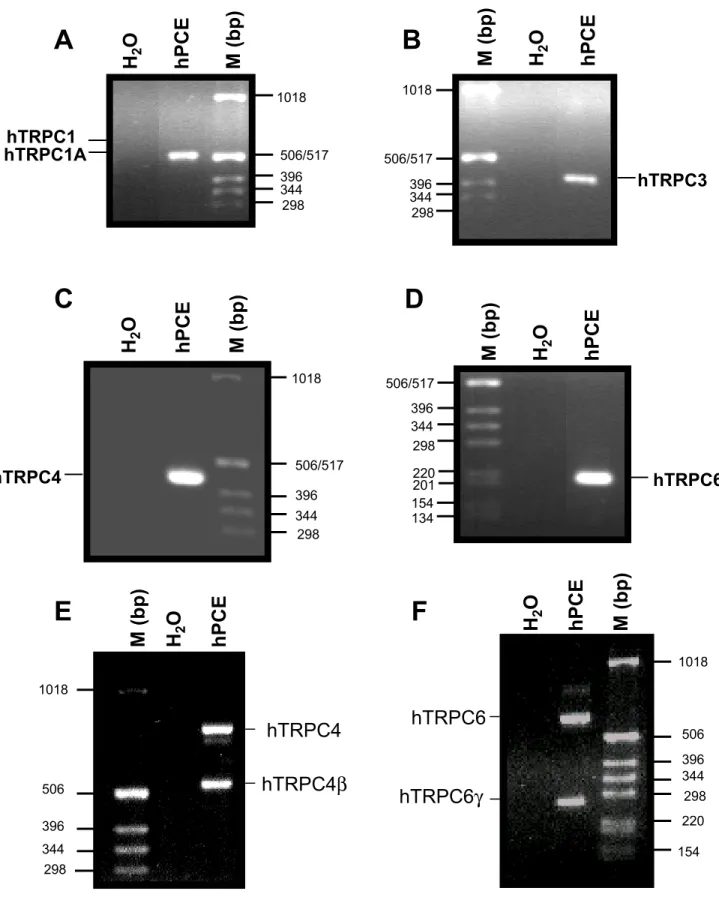
TRPC channel expression in human prostate cancer epithelial cells. In the attempt to
define the molecular identity of the channels underlying PHE- and ATP-induced ACE, using specific primers (Table I) and the RT-PCR technique, we first studied the expression of the mRNA of the human isoforms of the TRPCs (TRPC1, TRPC3, TRPC4 and TRPC6) in hPCE cells. In the first set of experiments, the specific primers were designed to amplify a portion of
the N-terminal sequence surrounding the initiating codon ATG of each TRPC member (Fig. 3A, D). In the second set of experiments, specific primers were designed to identify the TRPC4 and TRPC6 splice variants isoforms (Fig. 3E, F), except for the TRPC1 where the N-terminal primers allow us to identify the splice variants. Fig. 3 shows the expression of the transcripts for the TRPC1A splice variant (Fig. 3A), and the PCR products of the expected sizes for the TRPC3 (Fig. 3B), TRPC4 (Fig. 3C) and TRPC6 (Fig. 3D) in hPCE cells. The study of the splice variants isoforms (Fig. 3E, F) shows that the TRPC4β and TRPC6γ spliced isoforms were expressed in hPCE cells in addition to unspliced forms of TRPC4 and TRPC6.
Effects of targeted TRPC1, TRPC3, TRPC4 and TRPC6 hybrid depletion on ACE.To elucidate the specific contribution of each of the identified TRPC members to α1-AR- and P2Y-R-mediated Ca2+ signaling, we employed antisense hybrid depletion technology to decrease endogenous mRNA level of each of the TRPC1/3/4/6. We thereby reduced their expression, allowing the subsequent evaluation of their effect on PHE-, OAG- and ATP-stimulated Ca2+ influx. In this type of experiments, we treated the cells with antisense oligonucleotides specific to each TRPC member before using them for Ca2+ imaging. Cells treated for the same period of time with respective sense oligonucleotides, which are not supposed to affect endogenous mRNA levels, served as a control. We have previously demonstrated the reduction of specific TRPC1, TRPC3, TRPC4 and TRPC6 mRNA expression in antisense vs. sense treated cells by Western-blotting analysis in prostate cell line (31, 41).
Because of the oscillatory nature of PHE- and OAG-induced [Ca2+]i responses and the
possibility that altered TRPC expression may potentially affect the amplitude as well as the temporal parameters of oscillations, we opted to characterize the resulting effects of antisense treatments by calculating the area under oscillations (i.e. calculating an integral) over the 30 min observation period (SCa) and then subtracting the [Ca2+]i baseline. For the PHE-induced
oscillations in non-treated hPCE cells under standard conditions, the SCa=2700±210 nM*min.
In the event of ATP responses, the effects of TRPC depletion on Ca2+ entry was evaluated based on the changes of maximal [Ca2+]i during the transition from Ca2+-free to Ca2+
-containing solution in the type of experiments presented in Fig. 1E.
Fig. 4A shows that antisense hybrid depletion of TRPC1 (left top, n=48-85) as well as of TRPC4 (left bottom, n=72-105) exerted a pronounced down-regulatory effect on ATP-induced response (i.e., 87% and 84% inhibition, respectively) virtually without affecting PHE- and OAG-induced ones. On the contrary, the antisense knockout of TRPC6 strongly inhibited responses to PHE and OAG (i.e. by 62% and 59%, respectively) leaving the ATP one intact (right bottom, n=59-99). Finally, TRPC3 hybrid depletion affected ATP-, PHE- and OAG-induced responses almost equally, inhibiting them by 50%, 52% and 68%, respectively (right top, n=54-87).
Thus, these data indicate that endogenous TRPC1 and TRPC4 channels are exclusively involved in ATP-stimulated store-dependent type Ca2+ entry, whereas TRPC6 is the primary
DAG-gated channel mediating PHE-stimulated store-independent Ca2+ entry involved in
oscillatory-type Ca2+ signaling in hPCE cells. Endogenous TRPC3 is probably plays an equal
role in both store-dependent and store-independent Ca2+ influx pathways.
Alpha1-AR agonist phenylephrine, but not ATP promotes hPCE cell proliferation via TRPC6 up-regulation. In our previous studies we have shown that PHE promotes the
proliferation of androgen-dependent prostate cancer LNCaP cells via the mechanism involving Ca2+ influx (38, 44), whereas extracellular ATP causes the growth arrest of androgen-independent prostate cancer DU-145, by affecting store-dependent processes (38, 44). Therefore, it was natural to examine how the two agonists influence the proliferation of primary hPCE cells as well.
Consistent with our observations of other prostate cancer cell types, two-day- treatments of primary hPCE cells with PHE (10 µmol/L) enhanced their proliferation by 37.3±2.0%, whereas the same period of ATP (100 µmol/L) treatment inhibited cell proliferation by 61.6±1.6% (Fig. 4B). Specific effect of the agonists on cell’s proliferation was further confirmed by assaying the expression of two cell-cycle regulators, cyclin-dependent kinase 4 (CDK4) and cyclin-dependent kinase inhibitor p27 (35), by immunofluorescent staining with FITS-conjugated anti-CDK4 and anti-p27 antibodies. Inspection of the images presented in Fig. 4C shows that PHE treatment resulted in the upregulation of CDK4 expression and downregulation of p27 expression in contrast to ATP, whose action on the expression of these cell-cycle regulators was exactly opposite. These data permitted us to conclude that the effects of PHE and ATP on cells count were indeed related to cell proliferation and growth arrest, respectively.
To prove the critical involvement of TRPC6 in growth-regulating properties of α1-AR and P2Y-R agonists, we used hPCE cells subjected to TRPC6 hybrid depletion. In the absence of agonists, hPCE cells demonstrate similar proliferation activity irrespective of whether they were treated with TRPC6 sense (TRPC6/s) or antisense (TRPC6/as) oligonucleotides (Fig. 4B). However, in the presence of PHE, the proliferation of TRPC6 sense- and antisense-treated cells becomes dramatically different: if sense treatment did not change the usual proliferation promoting effects of PHE, then antisense treatment not only abolished these effects, but even reversed the trend, consequently resulting in proliferation inhibition. At the same time, TRPC6 sense- or antisense treatments did not influence the usual inhibitory mode of ATP action on hPCE cell proliferation.
Moreover, semi-quantitative Western blot analysis for possible changes in the expression of TRPC6 involved in PHE-induced Ca2+ signaling, which is likely to underlie
growth-regulating effects, have revealed a ∼3-fold up-regulation of TRPC6 expression in response to PHE-treatment (Fig. 4D).
Altogether, these results point to the key role of TRPC6 in PHE growth-regulating functions.
Proliferation promoting effects of α1-AR agonists involve NFAT activation. To
determine which transcription factor(s) mediate opposing effects of α1-AR and P2Y-R agonists on primary hPCE cells growth, we used cells transiently transfected with the pCIS-CK plasmid containing an insert of luciferase reporter gene driven by either synthetic NFAT- or NF-kB-dependent promoter (see Methods).
Fig. 5A shows that the incubation of transfected hPCE cells in the presence of PHE (10 µmol/L) for 48 hours increased NFAT-dependent luciferase expression by approximately 5-fold compared to the cells maintained under control conditions, whereas the presence of ATP in the culture medium during the same period of time was unable to alter NFAT-dependent luciferase expression, which remained identical to control values. At the same time, neither agonist produced a significant change in NF-kB-dependent luciferase expression (Fig. 5B). Moreover, PHE-induced increase in cell proliferation was specifically related to the increased NFAT activity, as blocking calcineurin by cyclosporin A (100 nmol/L) or FK506 (10 µmol/L) thereby impeding nuclear NFAT translocation, prevented the ability of PHE to induce cell proliferation without affecting the ATP-induced growth arrest (Fig. 5C). Thus, α1-AR-mediated stimulation of hPCE cell proliferation mainly occurs via NFAT activation.
DISCUSSION
In the present work, we have focused on elucidating the specifics of Ca2+ signaling involved in the opposing effects on human prostate cancer epithelial cell proliferation of α1-adrenoceptor and P2Y-purinergic receptor agonists, and report on three major findings: 1) α1-AR agonist, PHE, stimulates oscillatory type intracellular Ca2+ signaling sustained by Ca2+ entry via store-independent DAG-gated membrane channels predominantly represented by TRPC6, whereas P2Y-R agonist, ATP, stimulates store-dependent and transient Ca2+ signal involving SOC activation, to which the major contributors are TRPC1 and TRPC4, 2) TRPC6 is a key determinant in proliferation promoting effects of α1-AR agonists via oscillatory type Ca2+ signaling and 3) α1-AR agonist-stimulated oscillatory-type Ca2+ signaling enhances the
coupling efficiency to nuclear Ca2+-dependent transcription factor, NFAT, involved in the activation of proliferation promoting gene expression.
Agonist-dependent growth regulation of human prostate cancer epithelial cells. In the
present study, we confirmed that the major conclusions regarding the growth-regulating properties of α1-AR and P2Y-R signaling systems reached in our previous works on model systems of prostate cancel cell lines (38, 44) apply to the primary hPCE cells as well. Our study is the first of its kind to be conducted on primary cells, and its results allow all data, including those obtained in cell lines, to be taken into consideration from a common perspective. This is of importance in view of the widespread usage of cell lines due to their convenience and accessibility, although for practical applications primary human prostate cancer epithelial cells represent the preferred model for such studies (for details, see Methods section).
Thus, it seems to be proven that α1-AR-coupled signaling is associated with the enhancement of hPCE cell proliferation, whereas P2Y-R signaling brings about a cessation of proliferative activity. We have shown that despite being initiated by the common
PLC-catalyzed inositol phospholipids breakdown, the downstream pathways for the two receptors diverge by preferentially relying on the two different secondary messengers generated by such a breakdown, namely IP3 or DAG. Such a divergence permits the generation of the two
different patterns of intracellular Ca2+ signal in response to agonist-mediated stimulation of
the two receptors, which ultimately result in opposite end effects on cell proliferation.
We show that the pattern of Ca2+ signaling initiated by α1-AR stimulation is
characterized by regular oscillatory activity, which is almost exclusively based on Ca2+ entry pathway directly gated by DAG with no apparent role for IP3-mediated store depletion. The
latter is demonstrated by the inability of PHE to produce measurable Ca2+ release in the absence of extracellular Ca2+. Generally, this is surprising as most models of Ca2+ wave generation involve interplay between Ca2+ entry and IP3-mediated store-dependent processes
(42, 43). It may therefore suggest either very localized and compartmentalized Ca2+ releases
incapable of changing global [Ca2+]
i or the involvement of store-independent Ca2+
uptake/extrusion mechanisms such as, for instance, a mitochondrial one. In contrast, Ca2+
signaling coupled to P2Y-R stimulation is largely determined by IP3-mediated
store-dependent processes including robust Ca2+ release and the activation of store-operated Ca2+
influx (Fig. 6). Currently, it is well-known that IP3 has a short half-life within the cell and that
the diffusion of locally produced IP3 is rate limiting (1, 28, 32). The only determinants of IP3
spatial range of action are its lifetime and diffusion constant in cytoplasm. However, little is known about assessing these variables in single cell: there are rather used computational models but no indicator is available that would allow IP3 to be visualized (45). Similar
difficulties appear to study the intracellular signaling of DAG. The carbon-11 labeled DAG was proposed to evaluate its intracellular signaling but its use needs further investigations (12). Due to these technical limitations, adressing the question of such divergence between α1-AR-coupled and P2Y-R signaling appears unrealistic.
Recent data suggest that oscillatory [Ca2+]i activity may be especially suited to the
specificity of Ca2+ signaling (9), as the possibility of amplitude and frequency signal encoding permits distinct effectors to be targeted. Our data on selective proliferation promoting α1 agonist action via the induction of Ca2+ oscillation in hPCE cells, are consistent with this notion. Moreover, the fact that these oscillations translate into enhanced hPCE cell proliferation, via the activation of the Ca2+-dependent transcription factor, NFAT, generally agrees with previous findings on the importance of Ca2+ signal amplitude and frequency characteristics, in determining the efficiency and specificity of coupling to various transcription factors, including NFAT (9). In contrast, Mignen et al. have reported that repetitive Ca2+ oscillations due to low agonist concentration could not enhance the Ca2+ -dependent activation of NFAT in m3-HEK293, whereas high agonist concentration, that induced a sustained elevation in cytosolic Ca2+ concentration, was able to translocate NFAT
(23). However, the Ca2+ signal pattern was markedly different in their experiments : the Ca2+
concentrations were elevated for only a few seconds (∼10-15 ) during each oscillation (24), whereas the oscillatory period in T-cells (19) and in hPCE cells was approximately 2 minutes.
On the other hand, the suppressive effects of ATP-mediated P2Y-purinergic receptor stimulation on hPCE cell proliferation, via the induction of store-dependent Ca2+ signaling,
are generally consistent with the critical role of the ER Ca2+ store content and store-operated
Ca2+ channels in the regulation of prostate cancer cell apoptosis, as shown in our previous works (33, 43). Indeed, persistent activation of P2Y-purinergic receptors may cause chronic underfilling of ER Ca2+ store and an adaptive decrease in SOCE, which although may not be sufficient to induce apoptosis (33, 43), but sufficient to exert anti-proliferative effects (44).
TRP members involved in agonist-stimulated Ca2+ entry in human prostate cancer epithelial cells. Our results also highlight the importance of Ca2+ entry pathways in the
Indeed, as we show, the α1-AR agonist, PHE, as well as the DAG analog, OAG, activate Ca2+
entry mainly via the TRPC6 channel, whereas store-dependent type Ca2+ entry activated by ATP, predominantly involves TRPC1 and TRPC4 channels.
The literature ascribing various TRPC members to the DAG-gated or SOC type is quite conflicting and controversial, suggesting that each member, depending on cell type, the level of its expression and the presence of other members, may exhibit preferential DAG-dependent, store-dependent or even dual modes of activation (2, 29, 39). Therefore, a thorough assessment of the contribution of each particular TRP in the creation of the specific type of Ca2+ entry pathway is required in every case. In this respect, the information available on prostate cancer cell is very limited. So far, our own data obtained in the prostatic LNCaP cell line only suggests that TRPC1 and the member of the “vanilloid” TRP subfamily, TRPV6, are predominantly involved in SOC formation (42), which agrees closely with the TRPC1 role in ATP-induced store-dependent type Ca2+ entry established above. Moreover, TRPC1 is one of those channels most involved in store-operated Ca2+ entry in general (2). Another TRPC member, TRPC4, which we also identified as essentially contributing to ATP-induced store-dependent type Ca2+ entry in hPCE cells, has been demonstrated both in the SOCE and in other cell models (29).
Although the existence of a direct DAG-gated activation mode for heterologously expressed TRPC6 is well established (10, 16, 39), when it comes to DAG-gated TRPCs are, our study is the first to identify endogenous TRPC6 as a primary determinant in physiologically relevant agonist-induced Ca2+ entry operating on the direct DAG gating mechanism in cells of prostate origin, Moreover, we not only uncover the TRPC6 involvement in the generation of PHE-induced Ca2+ oscillations in hPCE cells by providing Ca2+ entry, but also demonstrate the likely role of this channel in the enhancement of the pro-proliferating effects of α1-AR agonists, since chronic exposure to PHE causes TRPC6
overexpression. It is also quite plausible that promotion of proliferation in response to α1-ARs stimulation may result not only from the higher coupling efficiency of Ca2+ oscillations to NFAT activation, but also from the spatial co-localization of TRPC6 with the machinery of Ca2+-dependent NFAT activation.
In general, the role of TRP members in proliferation activity has been best studied for smooth muscle cells. Interestingly, the results of these studies point to both TRPC1 and TRPC6 as important determinants in the promotion of pulmonary vascular smooth muscle cell proliferation (36, 46). However, the underlying mechanisms seem to involve the enhancement of store-operated Ca2+ influx only, including both TRPCs channels.
Potential clinical implications. Our present study together with the afore-mentioned
recent one (38) reveals new, previously unanticipated clinical effects for α1-AR blockade in the control of prostate epithelial cell proliferation, which can be further exploited for growth suppression in the benign and malignant prostate. Moreover, since we have identified the signaling pathway mediating α1-AR-stimulated proliferation promotion, all the molecular entities involved can potentially represent suitable targets for therapeutic intervention. This is especially true with respect to the TRPC6 channel, which determines the oscillatory pattern of Ca2+ signaling that couples agonist-mediated α1-AR stimulation to Ca2+-dependent activation
of the NFAT transcription factor, as disrupting this pattern would ultimately terminate proliferative gene expression.
ACKNOWLEDGEMENTS
We thank Etienne Dewailly and Philippe Delcourt for technical support. This work was supported by grants from INSERM, Ligue Nationale Contre le Cancer and Association pour la Recherche Contre le Cancer. Y. Shuba was supported by the Ministère de l’Education Nationale (France).
REFERENCES
1. Allbritton NL, Meyer T, and Stryer L. Range of messenger action of calcium ion and inositol 1,4,5-trisphosphate. Science 258: 1812-1815, 1992.
2. Beech DJ, Xu SZ, McHugh D, and Flemming R. TRPC1 store-operated cationic channel subunit. Cell Calcium 33: 433-440, 2003.
3. Benning CM and Kyprianou N. Quinazoline-derived alpha1-adrenoceptor antagonists induce prostate cancer cell apoptosis via an alpha1-adrenoceptor-independent action. Cancer Res 62: 597-602., 2002.
4. Berridge MJ, Bootman MD, and Lipp P. Calcium--a life and death signal. In: Nature, 1998, p. 645-648.
5. Caine M. Alpha-adrenergic blockers for the treatment of benign prostatic hyperplasia. Urol Clin North Am 17: 641-649., 1990.
6. Clapham DE. Calcium signaling. Cell 80: 259-268, 1995.
7. Clapham DE. TRP channels as cellular sensors. Nature 426: 517-524, 2003.
8. Crabtree GR. Calcium, calcineurin, and the control of transcription. J Biol Chem 276: 2313-2316, 2001.
9. Dolmetsch RE, Xu K, and Lewis RS. Calcium oscillations increase the efficiency and specificity of gene expression. Nature 392: 933-936., 1998.
10. Estacion M, Li S, Sinkins WG, Gosling M, Bahra P, Poll C, Westwick J, and Schilling WP. Activation of human TRPC6 channels by receptor stimulation. J Biol Chem 279: 22047-22056, 2004.
11. Fang WG, Pirnia F, Bang YJ, Myers CE, and Trepel JB. P2-purinergic receptor agonists inhibit the growth of androgen-independent prostate carcinoma cells. J Clin Invest 89: 191-196, 1992.
12. Fujii R, Imahori Y, Ido T, Wakita K, Horii H, Yagyu T, Higashi N, Mabuchi H, Ohmori Y, Ueda S, and et al. [Carbon-11 labeled diacylglycerol for signal transduction imaging by positron CT: evaluation of the quality and safety for clinical use]. Kaku Igaku 32: 191-198, 1995.
13. Golovina VA. Cell proliferation is associated with enhanced capacitative Ca(2+) entry in human arterial myocytes. Am J Physiol 277: C343-349, 1999.
14. Golovina VA, Platoshyn O, Bailey CL, Wang J, Limsuwan A, Sweeney M, Rubin LJ, and Yuan JX. Upregulated TRP and enhanced capacitative Ca(2+) entry in human pulmonary artery myocytes during proliferation. Am J Physiol Heart Circ Physiol 280: H746-755., 2001.
15. Grynkiewicz G, Poenie M, and Tsien RY. A new generation of Ca2+ indicators with greatly improved fluorescence properties. J Biol Chem 260: 3440-3450., 1985.
16. Hofmann T, Obukhov AG, Schaefer M, Harteneck C, Gudermann T, and Schultz G. Direct activation of human TRPC6 and TRPC3 channels by diacylglycerol. Nature 397: 259-263., 1999.
17. Horoszewicz JS, Leong SS, Kawinski E, Karr JP, Rosenthal H, Chu TM, Mirand EA, and Murphy GP. LNCaP model of human prostatic carcinoma. Cancer Res 43: 1809-1818, 1983.
18. Inoue R, Okada T, Onoue H, Hara Y, Shimizu S, Naitoh S, Ito Y, and Mori Y. The transient receptor potential protein homologue TRP6 is the essential component of vascular alpha(1)-adrenoceptor-activated Ca(2+)- permeable cation channel. Circ Res 88: 325-332., 2001.
19. Kyprianou N and Benning CM. Suppression of human prostate cancer cell growth by alpha1-adrenoceptor antagonists doxazosin and terazosin via induction of apoptosis. Cancer Res 60: 4550-4555, 2000.
20. Kyprianou N, Chon J, and Benning CM. Effects of Alpha(1)-adrenoceptor (alpha(1)-AR) antagonists on cell proliferation and apoptosis in the prostate: therapeutic implications in prostatic disease [In Process Citation]. Prostate Suppl 9: 42-46, 2000.
21. Li X and Stark GR. NFkappaB-dependent signaling pathways. Exp Hematol 30: 285-296, 2002.
22. Marshall I, Burt RP, and Chapple CR. Signal transduction pathways associated with alpha1-adrenoceptor subtypes in cells and tissues including human prostate. Eur Urol 36: 42-47; discussion 65. UR&action=render&rendertype=fulltext&uid=EUR.eur46a042, 1999. 23. Mignen O, Thompson JL, and Shuttleworth TJ. Calcineurin directs the reciprocal regulation of calcium entry pathways in nonexcitable cells. J Biol Chem 278: 40088-40096, 2003.
24. Mignen O, Thompson JL, and Shuttleworth TJ. Reciprocal regulation of
capacitative and arachidonate-regulated noncapacitative Ca2+ entry pathways. J Biol Chem 276: 35676-35683, 2001.
25. Minneman KP. Alpha 1-adrenergic receptor subtypes, inositol phosphates, and sources of cell Ca2+. Pharmacol Rev 40: 87-119., 1988.
26. Montell C. Physiology, phylogeny, and functions of the TRP superfamily of cation channels. Sci STKE 2001: RE1, 2001.
27. Patterson RL, van Rossum DB, Ford DL, Hurt KJ, Bae SS, Suh PG, Kurosaki T, Snyder SH, and Gill DL. Phospholipase C-gamma is required for agonist-induced Ca2+ entry. Cell 111: 529-541, 2002.
28. Pattni K, Millard TH, and Banting G. Calpain cleavage of the B isoform of Ins(1,4,5)P3 3-kinase separates the catalytic domain from the membrane anchoring domain. Biochem J 375: 643-651, 2003.
29. Plant TD and Schaefer M. TRPC4 and TRPC5: receptor-operated Ca2+-permeable nonselective cation channels. Cell Calcium 33: 441-450, 2003.
30. Putney JW, Jr., Broad LM, Braun FJ, Lievremont JP, and Bird GS. Mechanisms of capacitative calcium entry. J Cell Sci 114: 2223-2229, 2001.
31. S. Thebault AZ, A. Enfissi, C. Slomianny, E. Dewailly, M. Roudbaraki, J.B. Parys and N. Prevarskaya. Receptor-operated Ca2+ entry mediated by TRPC3/TRPC6 proteins in rat prostate smooth muscle (PS1) cell line. J Cell Physiol, 2004.
32. Sims CE and Allbritton NL. Metabolism of inositol 1,4,5-trisphosphate and inositol 1,3,4,5-tetrakisphosphate by the oocytes of Xenopus laevis. J Biol Chem 273: 4052-4058, 1998.
33. Skryma R, Mariot P, Bourhis XL, Coppenolle FV, Shuba Y, Abeele FV, Legrand G, Humez S, Boilly B, and Prevarskaya N. Store depletion and store-operated Ca2+ current in human prostate cancer LNCaP cells: involvement in apoptosis. J Physiol 527 Pt 1: 71-83., 2000.
34. Skryma RN, Prevarskaya NB, Dufy-Barbe L, Odessa MF, Audin J, and Dufy B. Potassium conductance in the androgen-sensitive prostate cancer cell line, LNCaP:
involvement in cell proliferation. Prostate 33: 112-122., 1997.
35. Sotillo R, Renner O, Dubus P, Ruiz-Cabello J, Martin-Caballero J, Barbacid M, Carnero A, and Malumbres M. Cooperation between Cdk4 and p27kip1 in tumor
development: a preclinical model to evaluate cell cycle inhibitors with therapeutic activity. Cancer Res 65: 3846-3852, 2005.
36. Sweeney M, Yu Y, Platoshyn O, Zhang S, McDaniel SS, and Yuan JX. Inhibition of endogenous TRP1 decreases capacitative Ca2+ entry and attenuates pulmonary artery smooth muscle cell proliferation. Am J Physiol Lung Cell Mol Physiol 283: L144-155, 2002.
37. Sydorenko V, Shuba Y, Thebault S, Roudbaraki M, Lepage G, Prevarskaya N, and Skryma R. Receptor-coupled, DAG-gated Ca2+-permeable cationic channels in LNCaP human prostate cancer epithelial cells. J Physiol 548: 823-836, 2003.
38. Thebault S, Roudbaraki M, Sydorenko V, Shuba Y, Lemonnier L, Slomianny C, Dewailly E, Bonnal JL, Mauroy B, Skryma R, and Prevarskaya N. Alpha1-adrenergic receptors activate Ca(2+)-permeable cationic channels in prostate cancer epithelial cells. J Clin Invest 111: 1691-1701, 2003.
39. Trebak M, Bird GS, McKay RR, Birnbaumer L, and Putney JW, Jr. Signaling mechanism for receptor-activated TRPC3 channels. J Biol Chem, 2003.
40. van Leenders GJ, Aalders TW, Hulsbergen-van de Kaa CA, Ruiter DJ, and Schalken JA. Expression of basal cell keratins in human prostate cancer metastases and cell lines. J Pathol 195: 563-570, 2001.
41. Vanden Abeele F, Lemonnier L, Thebault S, Lepage G, Parys J, Shuba Y, Skryma R, and Prevarskaya N. Two types of store-operated Ca2+ channels with different activation modes and molecular origin in LNCaP human prostate cancer epithelial cells. J Biol Chem, 2004.
42. Vanden Abeele F, Roudbaraki M, Shuba Y, Skryma R, and Prevarskaya N. Store-operated Ca2+ Current in Prostate Cancer Epithelial Cells. ROLE OF ENDOGENOUS Ca2+ TRANSPORTER TYPE 1. J Biol Chem 278: 15381-15389, 2003.
43. Vanden Abeele F, Skryma R, Shuba Y, Van Coppenolle F, Slomianny C,
Roudbaraki M, Mauroy B, Wuytack F, and Prevarskaya N. Bcl-2-dependent modulation of Ca(2+) homeostasis and store-operated channels in prostate cancer cells. Cancer Cell 1: 169-179, 2002.
44. Vanoverberghe K, Mariot P, Vanden Abeele F, Delcourt P, Parys JB, and Prevarskaya N. Mechanisms of ATP-induced calcium signaling and growth arrest in human prostate cancer cells. Cell Calcium 34: 75-85, 2003.
45. Wang SS, Alousi AA, and Thompson SH. The lifetime of inositol 1,4,5-trisphosphate in single cells. J Gen Physiol 105: 149-171, 1995.
46. Yu Y, Sweeney M, Zhang S, Platoshyn O, Landsberg J, Rothman A, and Yuan JX. PDGF stimulates pulmonary vascular smooth muscle cell proliferation by upregulating TRPC6 expression. Am J Physiol Cell Physiol 284: C316-330, 2003.
FIGURE LEGENDS
Fig. 1. α1-adreno- and P2Y-purinoreceptor-mediated Ca2+ signaling in primary hPCE cells.
(A and B) The patterns of [Ca2+]
i induced by α1-AR agonist phenylephrine (PHE, 10 µmol/L)
in hPCE cells initially maintained either in 2 mmol/L (A, 2/Ca2+, n=67) or 0 mmol/L (B, 0/Ca2+, n=98) extracellular Ca2+ and their sensitivity to the subsequent [Ca2+]out variations. (C)
The pattern of [Ca2+]i induced by the membrane-permeable DAG analogue OAG (100
µmol/L, n=79) in hPCE cells maintained at 2 mmol/L [Ca2+]out (2/Ca2+) and its sensitivity to
extracellular Ca2+ removal (0/Ca2+). (D and E) The patterns of [Ca2+]i induced by P2Y-R
agonist ATP (100 µM) in hPCE cells initially maintained either in 2 mmol/L (D, 2/Ca2+, n=93) or 0 mmol/L (E, 0/Ca2+, n=64) [Ca2+]
out and their sensitivity to the subsequent [Ca2+]out
variations; means ± s.e.m.. All interventions are marked by horizontal bars in the upper parts of the graphs.
Fig. 2. Differential store-dependency of α1-AR- and P2Y-R-mediated responses in the primary hPCE cells. (A and B) [Ca2+]i changes in response to hPCE cells exposure to
thapsigargin (TG, 1 µmol/L) showing Ca2+ liberation under 0 mmol/L [Ca2+]out (0/Ca2+)
followed by store-operated Ca2+ entry (SOCE) upon addition of 2 mmol/L [Ca2+]out (2/Ca2+)
and the ability of PHE (10 µmol/L, n=61, A), but not ATP (100 µmol/L, n=63, B) to evoke characteristic [Ca2+]i signal on top of TG-induced SOCE; mean±s.e.m., n=61 (A) and 63 (B).
(C and D) Averaged time courses (means±s.e.m., n=5-11) of the inward whole-cell membrane currents activated by PHE (10 µmol/L, C) and ATP (10 µmol/L, D) in hPCE cells under control conditions (open symbols in C and D) and following the cell’s pre-dialysis with IP3
-receptor antagonist heparin (0.1 g/L, filled symbols in C and D) via patch pipette; currents were measured at membrane potential –100 mV and related to the cells’ capacitance to yield current density (pA/pF) before averaging. I/V relationships of PHE and ATP-evoked currents
are presented (inset C and D). (E) Quantification of the effects of common cationic channels inhibitors, 2-APB (10 and 100 µmol/L), La3+ (1 mmol/L), MDL (100 µmol/L), flufenamate (50 µmol/L) and SK&F 96365 (SKF, 10 µmol/L), on the amplitude of PHE-induced [Ca2+]i
oscillations (white columns) and ATP-induced SOCE (black columns) in hPCE cells; mean±s.e.m., n=95-102.
Fig. 3. RT-PCR analysis of the expression of human TRPC1A (A), TRPC3 (B), TRPC4 (C) and TRPC6 (D) transcripts and of human splice variants of TRPC4 (E) and TRPC6 (F) transcripts in hPCE cells. The expression products were obtained using the primers described in Methods section. M – DNA ladder.
Fig. 4. TRPC6 is an important determinant in PHE-induced [Ca2+]
i response and in
proliferation-promoting effects of α1-AR stimulation in hPCE cells. (A) Quantification of [Ca2+]i signals (means±s.e.m., see text for details) induced by ATP (100 µmol/L), PHE (10
µmol/L) and 100 µmol/L OAG in hPCE cells treated for 48 h with sense (white columns) or antisense (black columns) oligonucleotides directed against TRPC1 (left top panel, n=48-85), TRPC3 (right top panel, n=54-87), TRPC4 (left bottom panel, n=72-105) or TRPC6 (right bottom panel, n=59-69). * P<0.01. (B) Changes in the density of vehicle-treated hPCE cells (light gray columns) and hPCE cells treated with either TRPC6-sense (dark gray columns) or TRPC6-antisense (black columns) oligonucleotides following 48 h incubation under control conditions (CTL) and in the presence of phenylephrine (PHE, 10 µmol/L, gray column) or ATP (100 µmol/L, black column); (*) designates significantly different values with P<0.001; J0 corresponds to the initial cell density and J48 to the cell density after 48 hours in culture
under regular conditions; cells treated with the transfection reagent alone (vehicle) served as control for oligonucleotides treatments. (C) Representative epifluorescence images of hPCE
cells labeled with FITS-conjugated anti-CDK4 (right images) and anti-p27 (left images)
antibodies under control (CTL) conditions and following 48 h culturing in the presence of PHE (10 µmol/L) or ATP (100 µmol/L); 10 µm scale bars. (D) Western blot analysis for the expression TRPC6 protein in hPCE cells following 48 h incubation under control conditions (CTL) or in the presence of phenylephrine (PHE, 10 µmol/L). Each experiment was repeated three times.
Fig. 5. α1-AR-mediated proliferation-promoting effects involve NFAT activation in hPCE cells. (A) Quantification of luciferase activity in hPCE cells transiently transfected either with a luciferase reporter gene with a NFAT-dependent promoter (gray columns) or with a reporter vector lacking NFAT response elements in the promoter (white columns) following 48 h incubation under control conditions (CTL) and in the presence of phenylephrine (PHE, 10 µmol/L) or ATP (100 µmol/L); mean±s.e.m. of three independent experiments; * P<0.01. (B) Same as in (A), but for hPCE cells transiently transfected with a luciferase reporter gene with (gray columns) or without (white columns) NF-kB-dependent promoter. (C) Changes in the density of hPCE cells in response to 48-hour-long treatment with phenylephrine (PHE, 10 µmol/L) or ATP (100 µmol/L) under regular (control, CTL) conditions and in the presence of calcineurin inhibitors, cyclosporine A (100 nmol/L, light gray columns) or FK506 (10 µmol/L,dark grey columns); (*) indicates P<0.001 compared with PHE-treated cells under control conditions.
Fig. 6. Schematic depiction of α1-adreno- and P2Y-purinoreceptor-mediated Ca2+ signaling in
the primary hPCE cell proliferation. α1-AR stimulation by agonist (PHE) via G-protein-coupled PLC-catalyzed PIP2 breakdown causes generation of two secondary messengers, IP3
channel (ROC) represented by TRPC6, whereas IP3 due to some limitations of a yet unknown
nature, is unable to produce visible effects. Consequent Ca2+ entry via ROC/TRPC6 causes NFAT activation due to Ca2+/CaM/calcineurin-assisted translocation to the nucleus, where NFAT initiates the expression of the genes necessary for proliferation. In contrast, agonist-mediated P2Y-R stimulation (ATP), although causing the same PLC-catalyzed derivation of IP3 and DAG, further down employs IP3 to release Ca2+ from endoplasmic reticulum (ER) via
IP3-receptor (IP3-R) with the subsequent activation of PM store-operated Ca2+ channels
(SOC), mainly represented by TRPC1 and TRPC4. Associated ER Ca2+ store depletion most probably serves as a primary stress factor for proliferation inhibition.
Table I. The sequences of selected oligonucleotides used as RT-PCR primers or as sense and antisenses.
Figure 1
A
PHE 0 200 400 600[Ca
2+]
i, n
M
2Ca2+ 0Ca2+ 2Ca2+
2 min
C
0 200 400 600 OAG2Ca2+ 0Ca2+ 2Ca2+
2 min
[Ca
2+]
i, n
M
D
800 600 400 200 0[Ca
2+]
i, n
M
ATP 2 min 2Ca2+ 0Ca2+B
0 200 400 600 PHE 2 min 2Ca2+ 0Ca2+[Ca
2+]
i, n
M
E
0 200 400 600 800 ATP 2 min[Ca
2+]
i, n
M
2Ca2+ 0Ca2+Figure 2
0 200 400 600A
[Ca
2+]
i, n
M
TG
Ca
2+ PHE 2 minC
0 1 2 3 4 5 -12 -8 -4 0Cur
rent
d
ensity, p
A
/pF
PHE PHE, heparin Time, minE
2APB 10 µM 2APB 100 µM CTL La3+ MDL SKF flufe nam ate 0 200 400 600 800 ATP PHE[Ca
2+]
i, n
M
0 0 -50 -100 50 100 -40 -80 -120 mV pA 0 1 2 3 -1,6 -1,2 -0,8 -0,4 0,0D
ATP ATP, heparin Time, minpA/pF
0 -50 -100 50 100 (mV) 0 -10 -30 (pA) -20TG
ATPCa
2+B
[Ca
2+]
i, n
M
0 200 400 600 800 2 minFigure 3
hTRPC1A
hTRPC3
298 506/517 396 344 1018 298 396 344 1018 506/517H
2O
hP
C
E
M (bp
)
M (bp
)
H
2O
hP
C
E
hTRPC1
A
B
hTRPC4
298 396 344 1018 506/517H
2O
hP
C
E
M (bp
)
hTRPC6
298 506/517 396 344 220 201 154 134M (bp
)
H
2O
hP
C
E
C
D
F
H
O
2M (bp
)
hP
C
E
hTRPC6
hTRPC6
γ
220 154 298 506 396 344 1018E
H
2O
M (bp
)
hP
C
E
hTRPC4
hTRPC4
β
298 506 396 344 1018A
C
0 300 600 900 * OAG PHE ATP[Ca
2+]
i, n
M
S TRPC1 AS TRPC1 0 300 600 900 * * PHE ATP OAG * S TRPC3 AS TRPC3 0 300 600 900 * OAG PHE ATP[Ca
2+]
i, n
M
S TRPC4 AS TRPC4 0 300 600 900 * * PHE ATP OAG S TRPC6 AS TRPC6Calnexin
(90 kDa)TRPC6
(86 kDa) CTL PHE1
2.9
Figure 4
CDK4 CTL PHE ATP p27D
B
sense TRPC6
antisense TRPC6
vehicle
0 50 100 150Cell
growth
(%
)
PHE ATP*
J0 J480 200 400 600 800 1000 1200 1400 1600
A
*
CTL PHE ATP NFAT-negative ctl NFATLuciférase activity
8.104 7.104 6.104 5.104 4.104 3.104 2.104 104 0B
CTL PHE ATP NFKB NFKB- negative ctlLuciferase
activity
Figure 5
0 ,0 0 ,2 0 ,4 0 ,6 0 ,8 1 ,0 1 ,2 1 ,4C
Cell
growth
(%
)
CTL PHE ATP Cyclosporine CTL FK506 CTL PHE ATP CTL PHE ATP*
*
Figure 6
PCR primers
hTRPC1 Forward : 5'-AGTGGGAACGACTCATCCTTTT-3' 300-322 (NM_003304) 632 (TRPC1) Backward : 5'-CATAGTTGTTACGATGAGCAGC-3' 931-910 (NM_003304) 530 (TRPC1A) hTRPC3 Forward : 5'-CTTCTCTAGGTCCATGGAGGGAA-3' 150-172 (U47050) 417
Backward : 5'-TCAGAGTGAGACGCTTGCTGGC-3' 568-547 (U47050) hTRPC4 Forward1 : 5'-GCAGAGACGAAGAAATAGCATGGCA-3' 205-229 (AF063822) 455
Backward1 : 5'-CTGGAGTGAATTCAGAGAACTGCT-3' 659-636 (AF063822) hTRPC4 Forward2 : 5'-CTCTGGTTGTTCTACTCAACATG-3' 2058-2082 (AF063822) 781 (TRPC4) Backward2 : 5'-CCTGTTGACGAGCAACTTCTTCT-3' 2861-2839 (AF063822) 528 (TRPC4β)
356 (TRPC4δ) 332 (TRPC4γ) hTRPC6 Forward1 : 5'- TTCCCGCCATGAGCCAC -3' 420-436 (AJ006276) 208
Backward1 : 5'-CGGTGAGCCAGTCTGTTGTCAGAT-3' 627-604 (AJ006276) hTRPC6 Forward2 : 5'-GAACTTAGCAATGAACTGGCAGT-3' 1322-1345 (AJ006276) 625 (TRPC6)
Backward2 : 5'-CATATCATGCCTATTACCCAGGA-3' 1947-1925 (AJ006276) 461 (TRPC6β) 277 (TRPC6γ) Actin Forward : 5'-CAGAGCAAGAGAGGCATCCT-3' 248-267 (NM_001101) 210
Backward 5'-GTTGAAGGTCTCAAACATGATC-3'. 457-436 (NM_001101)
Sense and antisenses oligonucleotides
hTRPC1 Antisense : 5’- GCCATCATCGCGGCCCAT-3’ 405-388 (NM_003304) Sense : 5’- ATGGGCCGCGATGATGGC-3’ 388-405 (NM_003304)
hTRPC3 Antisense : 5'- CCATGGACCTAGAGAAGC -3' 166-149 (U47050) Sense : 5'-GCTTCTCTAGGTCCATGG-3' 149-166 (U47050) hTRPC4 Antisense : 5'-GTAATAGAACTGAGCCAT-3' 236-253 (AF063822)
Sense : 5'-ATGGCTCAGTTCTATTAC-3' 253- 236 (AF063822) hTRPC6 Antisense : 5'- TCTGGCTCATGGCGGGAA -3' 437-420 (AJ006276)
Sense : 5'- TTCCCGCCATGAGCCAGA -3' 420-437 (AJ006276)
Targets Oligonucleotides Position in GenBank sequence Expected fragment
sequences (Accession n°) size (bp)
![Figure 1A PHE0200400600[Ca2+]i, nM](https://thumb-eu.123doks.com/thumbv2/123doknet/14613561.545911/32.918.113.818.107.1045/figure-a-phe-ca-i-nm.webp)
![Figure 20200400A600[Ca2+]i, nMTGCa2+PHE2 minC012345-12-8-40Currentdensity, pA/pFPHEPHE,heparinTime, minE 2A PB 1 0 µM 2A PB 1 00 µ MCTL La 3+ M DL SK Fflufenamate0200400600800 ATP PHE[Ca2+]i, nM00-50-10050 100-40-80-120mVpA 0 1 2 3-1,6-1,2-0,8-0,40,0D](https://thumb-eu.123doks.com/thumbv2/123doknet/14613561.545911/33.918.90.822.100.1082/figure-nmtgca-phe-currentdensity-pfphephe-heparintime-mctl-fflufenamate.webp)