HAL Id: tel-00878846
https://tel.archives-ouvertes.fr/tel-00878846
Submitted on 31 Oct 2013HAL is a multi-disciplinary open access
archive for the deposit and dissemination of sci-entific research documents, whether they are pub-lished or not. The documents may come from teaching and research institutions in France or abroad, or from public or private research centers.
L’archive ouverte pluridisciplinaire HAL, est destinée au dépôt et à la diffusion de documents scientifiques de niveau recherche, publiés ou non, émanant des établissements d’enseignement et de recherche français ou étrangers, des laboratoires publics ou privés.
Thomas Gautier
To cite this version:
Thomas Gautier. Experimental simulation of Titan’s aerosols formation. Planétologie et astrophysique de la terre [astro-ph.EP]. Université de Versailles-Saint Quentin en Yvelines; Ruhr-Universität Bochum, 2013. Français. �tel-00878846�
Thèse présentée pour l'obtention du titre de Docteur de l'Université de Versailles St Quentin en Yvelines. Spécialité: Astronomie Astrophysique.
Dissertation zur Erlangung des Grades eines Doktors der Naturwissenschaften in der Fakultät für Physik und Astronomie der Ruhr Universität Bochum
Experimental simulation of
Titan’s aerosols formation
by Thomas Gautier
Soutenue le 20 Septembre 2013, devant un jury composé de:
Pr. Philippe Bousquet Pr. Hervé Cottin Pr. Pascal Rannou Pr. Emmanuel Lellouch Pr. Horst Fichtner Pr. Jörg Winter Dr. Nathalie Carrasco Président Rapporteur Rapporteur Examinateur Examinateur Directeur Directrice
Contents
Résumé ...
Chapter I : Titan - Observations and Experimental Simulations ... 1
I.1 Titan ... 1
I.1.1 Past and present exploration ... 1
I.1.2 Current knowledge on Titan's atmospheric aerosols ... 4
I.2 Titan in a can: Laboratory analogs of Titan’s aerosols ... 9
I.2.1 Gas Phase ... 11
I.2.2 Tholins optical properties in the Infrared range ... 12
I.3 Conclusion ... 15
Chapter II Methods ... 17
II.1 Experimental devices ... 17
II.1.1 The PAMPRE experiment: Synthesis of Titan's aerosols analogues ... 17
II.1.2 Bochum setup ... 23
II.1.3 Photochemical experiment: the APSIS setup ... 26
II.2 Ex-situ Analytical methods ... 29
II.2.1 Cryogenic trapping and Gas-Chromatography coupled to mass spectrometry: gas products identification. ... 29
II.2.2 Infrared analyses of tholins by ATR (performed at LATMOS) ... 30
II.2.3 Tholins infrared spectroscopy using Synchrotron radiation. ... 31
II.2.4 Ellipsometry: Determination of sample thickness. ... 32
II.2.5 High resolution mass spectrometry for tholins chemical analysis ... 32
II.3 Conclusion ... 34
III.2 Volatile products in the PAMPRE experiment: in-situ look to the tholins nursery .. 39
III.2.1 Experimental protocol ... 40
III.2.2 The case of hydrogen: H and H2 ... 43
III.2.3 Organic species production ... 46
III.2.4 Implication for tholins formation processes: the case of ammonia and Methanimine ... 49
III.2.5 Conclusion ... 53
III.3 Improving sensibility: Cold trap experiments ... 54
III.3.1 Experimental setup and protocol ... 54
III.3.2 Results ... 55
III.3.3 Discussion ... 63
III.3.4 Conclusion ... 71
III.4 Volatiles products in Bochum experiment: kinetics, products and quantification ... 73
III.4.1 Experimental parameters ... 73
III.4.2 Providing Carbon for tholins formation: the consumption of methane... 74
III.4.3 Kinetics ... 76
III.4.4 Identification by mass spectrometry ... 78
III.4.5 Identification by infrared spectroscopy ... 82
III.4.6 Absolute quantification of HCN and NH3 ... 86
III.5 Conclusion ... 89
Chapter IV Tholins: What are they made of? How does it influence their properties? ... 91
IV.1 Introduction ... 91
IV.2 Insight into tholins chemical composition ... 92
IV.2.1 Time of Flight mass spectrometry: Global description of the sample ... 92
IV.2.4 Conclusion ... 115
IV.3 Optical infrared properties ... 116
IV.3.1 Introduction ... 116
IV.3.2 A first comparison of tholins produced in PAMPRE and Bochum: Attenuated Total Reflectance spectroscopy. ... 116
IV.3.3 Quantifying the tholins absorption and exploring their far-infrared absorbance properties. ... 120
IV.4 Conclusion ... 133
Chapter V Effect of photochemistry: the APSIS experiment ... 135
V.1 Introduction ... 135
V.2 Analytical techniques and data treatment ... 136
V.2.1 In-situ Mass Spectrometry ... 136
V.2.2 GC-MS ... 138
V.3 Results ... 138
V.3.1 Methane consumption ... 138
V.3.2 Kinetics ... 140
V.3.3 Products identification (GC-MS) ... 142
V.3.4 Pressure influence on mass spectra ... 143
V.3.5 Products identification (MS) ... 146
V.4 Discussion ... 147
V.5 Conclusion ... 149
General conclusion ... 151
List of publications related to this thesis ... 157
Table of figures ... 159
Remerciements
And not, when I came to die, discover that I had not lived... Henry David Thoreau
Tout d’abord je remercie ma famille, en particulier ma grande sœur Alex, pour leur soutien et leur foi en moi.
Je tiens également à remercier tout le personnel du LATMτS que j’ai eu l’occasion de côtoyer pendant ces années, et en particulier tous les membres de mon équipe tant pour leur soutiens dans mon travail que pour l’ambiance conviviale qui l’a entouré (et c’est peu dire !). Un merci spécial pour Cyril Szopa pour ses conseils et les parties de ping-pong. Surtout un énorme merci à ma directrice de thèse σathalie Carrasco, qui m’a offert sa confiance et l’opportunité de faire cette thèse. Merci pour son aide, son soutien et sa joie de vivre communicative.
Merci également à toutes les personnes d’autres laboratoires avec qui j’ai eu la chance de collaborer et sans qui cette thèse n’aurait pas été possible. En particulier, un énorme merci à Vass pour le soutien réciproque pendant nos rédactions…
Parce que une thèse c’est également des rencontres, merci à toute la team des thésards (et pour ne pas oublier les post-docs et stagiaires également) du labo : Constantino, Loic, Kristell, Jennyfer (Super Co-Bulloc !), Maud, Christophe, Gaëlle, Sarah, Emilie, Tanguy, Maëva, Benjamin (et beaucoup d’autres…). Merci pour ces petites pauses dans le boulot qui aident à garder le rythme.
A special thanks for all the people from EP II Bochum, especially would like to thank Pr. Jörg Winter for supervising my thesis and Ilija Stefanovic and Brankica Sikimic that help me not only in the lab but also in everyday life.
pendant ces trois ans, merci entre autre à Seb, Yo, Bibi, Pierrot et Cécé (pour son acceptation :) ) pour les soirées call-of.
Merci enfin aux amis du para (trop nombreux pour être énumérés sans un manquer un, mais le cœur y est), pour tous ces bons moments passés à Maubeuge dans le Ciel ou par terre rue Mouffetard…
Merci à tous, Thomas
If Stars should appear but one night every thousand years, how would men believe and adore, and preserve for many generations the remembrance of the city of gods which had been shown.
Resume
La problématique de cette thèse est à mettre en relation avec l’étude de la composition et des propriétés des aérosols de Titan. Pour ce faire, j’ai produit en laboratoire et analysé des équivalents d’aérosols de Titan, appelés tholins. En effet, même si la mission Cassini-Huygens a permis d’avancer dans notre connaissance des aérosols dans l’atmosphère de Titan, leur formation ainsi que leur composition reste assez peu connue. Une des méthodes possible pour étudier ce sujet est donc de produire et d’analyser en laboratoire des analogues d’aérosols.
Le chapitre I de cette thèse présente l’état de l’art actuel concernant les aérosols de Titan à partir des observations faites par la mission Cassini-Huygens. Cet état de l’art est ensuite mis en relation avec les différentes études déjà faites en laboratoire pour étudier ces aérosols. Le chapitre II est quant à lui dédié à la présentation des méthodes expérimentales utilisées durant cette thèse, que cela soit les réacteurs utilisés pour produire des aérosols, ou bien les méthodes analytiques mises en place pour les analyser.
Les principaux buts de cette thèse sont de caractériser la chimie et les voies de formation possible menant à la formation d’aérosols, ainsi que de déterminer la composition et les propriétés de ces aérosols à l’aide de techniques de pointe en laboratoire. Pour ce faire j’ai utilisé deux approches complémentaires.
Tout d’abord, comme présenté dans le chapitre III, une approche ‘bottom-up’ qui consiste à étudier la composition et la réactivité de la phase gazeuse menant aux aérosols. Cette étude est principalement basée sur des mesures par spectrométrie de masse dans deux réacteurs à plasma différents.
La seconde approche est une approche ‘top-bottom’ et est présentée dans le chapitre IV. Il s’agit d’analyser les tholins, tant pour leurs propriétés d’absorption dans l’infrarouge lointain et moyen, que pour leurs composition chimique. L’étude de ces propriétés peut permettre de remonter à certains mécanismes de formation des tholins.
sur l’impact de la source d’énergie (photons versus électrons) sur la réactivité de la phase gazeuse.
Trois montages expérimentaux ont été utilisés pour cette thèse. Les deux premiers sont le montage PAMPRE et l’expérience de Bochum. Ce sont des réacteurs plasma très similaire dans leur conception et disposant d’instruments complémentaires dans l’analyse de la phase gazeuse. APSIS, le troisième est un réacteur photochimique utilisant le rayonnement synchrotron dans le VUV comme source d’énergie. Une comparaison entre ces trois montages est proposée dans la Table 1.
Table 1: Comparaison des différents montages expérimentaux utilisés pour cette thèse
PAMPRE Réacteur Bochum APSIS
Dépôt d’énergie RF Plasma 30 W RF Plasma 50 W Photons VUV
220-60 nm Mélange de gaz N2-CH4 0≤%CH4≤10 N2-CH4 90-10 N2-CH4 90-10 + He
Pression 0.9 – 1.7 mbar 0.5 mbar ~mbar
+ ~5mbar He Température Température amb. Température amb. Température amb. Echantillons collectés - Tholins en poudre - Couches minces de tholins - Gaz (piégeage cryogénique) - Tholins en poudre - Gaz (piégeage cryogénique)
Diagnostics disponibles - SMQ - IRTF (30 cm) - SOE - SMQ - IRTF multi passage (7m) - SMQ
Dans toutes ces expériences, le principe est similaire. Il s’agit d’apporte de l’énergie (soit sous forme de photons pour APSIS soit sous forme d’électrons pour les montages plasma) à un mélange gazeux d’azote et de méthane, à une pression d’environ un millibar. Le mélange est fait dans des proportions similaires à celles trouvées dans l’atmosphère de Titan (de 1 à 10% de méthane dans l’azote).
L’azote et le méthane vont dans un premier temps être soit dissociés soit ionisés, pour ensuite engendrer une chimie organique complexe aboutissant d’une part à la formation de composés en phase gaz et d’autre part à la production d’aérosols organique solides, les tholins.
Concernant l’étude de la phase gazeuse, l’étude de la phase stationnaire obtenue avec différentes proportions de méthane (de 1 à 10%) dans le mélange initial montre une corrélation entre l’enrichissement de la phase gazeuse (nombre d’espèces détectées et leur quantité) et le pourcentage de méthane.
L’ammoniac et la methanimine sont détectés en phase gaz, en accord avec leur détection dans l’ionosphère de Titan par l’instrument IσMS. La production de ces composés hautement polymérisables pourrait être une première étape dans la formation des tholins. Deux effets opposés dans la formation et croissance des aérosols peuvent être déduis des mesures sur la phase gaz. D’une part, la croissance organique via la co-polymérisation d’imines, et d’autre part un processus inhibiteur dû à la présence d’hydrogène atomique. Cet effet inhibiteur est à mettre en relation avec des observations récentes montrant une fixation de l’hydrogène sur des aérosols de laboratoire, au dépend de la croissance organique de l’aérosol.
importante que la quantité d’hydrocarbures (pour des mélanges à faible pourcentage de méthane). Le principal produit détecté en phase gaz est le cyanure d’hydrogène, également détecté en grandes quantités dans l’atmosphère de Titan. Malheureusement la chimie des nitriles est encore largement inconnue, et ceux-ci sont souvent ignorés dans les modèles de chimie atmosphérique de Titan.
De manière générale, la composition du gaz dans mes expériences (plus d’une trentaine d’espèces détectées) est en accord avec les connaissances actuelles sur la composition de l’atmosphère de Titan. Ceci tend à démontrer l’intérêt des expériences de laboratoire (tout du moins celles capables de dissocier l’azote) comme moyen d’étude complémentaire aux observations pour l’atmosphère de Titan.
En plus de la détection des composés présents, j’ai pu effectuer une quantification relative de certains de ces composés, les mono-nitriles saturés, présentée sur la
Figure 1: Quantification relative des mono-nitriles saturés. Les points de couleurs correspondent aux données expérimentales, les diamants et triangles vides aux observations d’INMS, et les triangles et diamants plein aux sortie de modèle photochimique de l’atmosphère de Titan.
concentration de ces composés qui est (avec HCN normalisé à 100) :
Où x est le nombre d’atomes de carbone dans la molécule. Cette loi empirique est en accord avec les observations de Cassini et les sorties de modèles photochimique de l’atmosphère de Titan et pourra permettre d’estimer la concentration de nitriles lourds en connaissant celle des légers. Le spectromètre infrarouge multi-passage présent sur l’expérience de Bochum m’a également permis de quantifier de manière absolue HCN et NH3 (respectivement à 90 ppm et 15 ppm environ).
La seconde partie de ma thèse est dédiée à l’analyse des tholins. Les analyses chimiques nous donne un nouveau point de vue sur leur exact composition et révèle la grande complexité de ce matériau. Cette complexité a nécessité un traitement statistique des spectres de masse obtenus avec un spectromètre de masse à haute résolution (orbitrap).
En plus de l’analyse des tholins, un autre matériau a été analysé. Il s’agit d’un résidu de polymérisation des gaz neutres. Cette analyse a permis d’obtenir des informations sur les chemins de réactivité menant à la formation des tholins, en mettant en exergue les différences entre matériau produit simplement par la polymérisation des neutres (résidu) et un matériau produit dans un plasma réactif (tholins) par des processus impliquant à la fois des neutres, des ions et possiblement de la chimie hétérogène à la surface de l’aérosol.
Les principales molécules détectées dans les tholins contiennent une plus grande quantité d’azote que celles détectées dans le résidu. L’on peut supposer que la principale différence entre les tholins et le résidu est la chimie ionique ayant lieu lors de la formation des tholins mais pas du résidu. Cela pourrait signifier que la chimie ionique augmente l’inclusion d’azote dans les tholins, en comparaison avec la chimie des neutres qui va produire des molécules avec un ratio N/C plus faible.
Le spectre de masse des tholins montre des structures polymériques, qui sont confirmées par l’indentification de plusieurs familles de polymères dans le matériau. Cela renforce l’idée que les tholins seraient des polymères, probablement pas linéaires, mais plutôt des co-polymères hyperbranchés. Différentes hypothèses de croissance ont été testées pour
décompositions en bases proposés dans cette thèse.
Figure 2: Représentation schématique des différentes reconstructions des spectres de masse. Une bonne concordance correspond à un cercle petit et sombre (voir le corps de la thèse pour de plus amples explications).
Malgré tout, une convergence des familles polymériques montre que, aux hautes masses (m/z >300), le matériau peut être assimilé à un polymère moyen de formule (CH1.5N0.5)n.
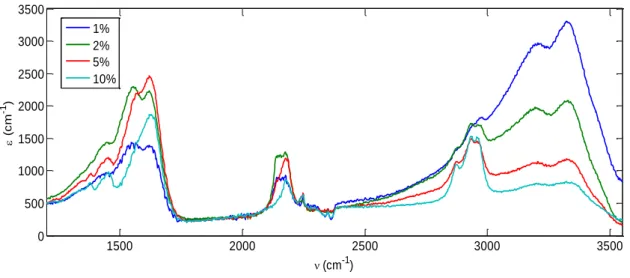
J’ai également analysé les propriétés d’absorption dans l’infrarouge des tholins. Cette étude a permis de fournir pour la première la dépendance en fonction de la longueur d’onde du coefficient linéaire d’absorption des tholins, , du lointain au moyen infrarouge (100-4000 cm -1). J’ai également étudié l’impact du pourcentage de méthane du mélange gazeux où sont
formés les tholins sur leur spectre d’absorbance dans le moyen infrarouge. Cette influence est maximale sur les bandes amines (vers 3330 cm-1 et 3200 cm-1) et est également très marquée sur les bandes attribuées aux carbones aliphatiques vers 2900 cm-1 comme présenté sur la Figure 3.
Figure 3: Comparaison des spectres IR de tholins produits avec différents pourcentage de méthane
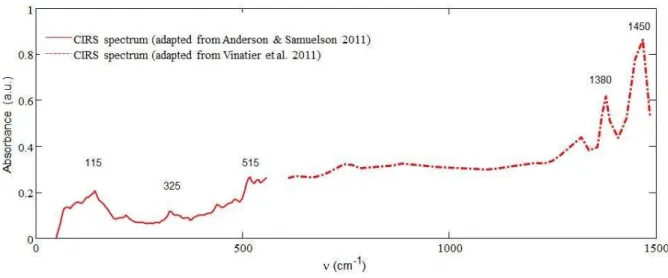
Les spectres des tholins ont ensuite été comparés aux observations faites par les instruments CIRS et VIMS à bord de Cassini. Le massif à 2900 cm-1 montre une concordance entre les tholins et les observations de VIMS, supportant l’idée que les aérosols seraient les principaux contributeurs de la bande d’absorption observée par VIMS dans cette zone. En comparant les données de laboratoire dans le lointain infrarouge avec celles de CIRS, là aussi on obtient une bonne correspondance. Les deux spectres sont en accords sur de nombreuses bandes d’absorption, en particulier à 1450 cm-1
, 1380 cm-1, 515 cm-1 et 325 cm-1, renforçant la détection et l’attribution de ces bandes aux aérosols.
Figure 4: Comparaison des spectres de tholins (noir) et des observations de l'atmosphère de Titan par CIRS entre 50 et 1500 cm-1 1500 2000 2500 3000 3500 0 500 1000 1500 2000 2500 (cm-1) ( c m -1) 5% 10% 0 500 1000 1500 0 0.2 0.4 0.6 0.8 1 (cm-1) A b s o rb a n c e ( a .u .) This work
CIRS spectrum (adapted from Anderson & Samuelson 2011) CIRS spectrum (adapted from Vinatier et al. 2011)
Data from Khare et al. 1984 (adapted from Quirico et al. 2008)
1450
1380
515 690
324 170 255
tholins produits avec le réacteur PAMPRE sont de bons analogues d’aérosols de Titan, et que leur étude permet d’obtenir des indices sur les processus de formation et les propriétés des aérosols de Titan.
La dernière partie de cette thèse concerne des expériences faites avec le réacteur APSIS. Ce réacteur est un nouveau réacteur photochimique, utilisant un rayonnement synchrotron comme source d’énergie. Pour ces expériences, un mélange gazeux d’azote méthane est irradié par un spectre continu (60-350 nm) de photons VUV provenant de la ligne de lumière DISCO sur le synchrotron SOLEIL. Les produits neutres de la photochimie ont été suivis par spectrométrie de masse, montrant des constantes de temps de l’ordre de la quinzaine de minutes et une production d’espèces allant jusqu’à quatre ou cinq atomes lourds (carbone ou azote). Les hydrocarbures en C2 sont de loin les produits majoritaires dans ces expériences, mais des composés azotés tels que HCN, CH3CN et C2N2 sont également détectés. Les résultats obtenus lors de ces expériences sont ensuite comparés aux expériences menées à l’aide de montage plasma tels que PAMPRE et aux mesures in-situ faites par INMS dans l’atmosphère de Titan.
Malgré des taux de production photochimique plus faibles et des conditions environnementales différentes, le réacteur APSIS semble plutôt bien simuler la composition des neutres dans la haute atmosphère de Titan. Cependant, avec comme but de former des particules solides pour pouvoir les étudier de la même manière que les tholins produits par plasma, l’efficacité de production du montage devra être améliorée dans le futur, par exemple en augmentant le temps de résidence des gaz dans le réacteur.
Les principaux résultats de cette thèse sont résumés dans la Table 2.
Table 2: Principaux résultats de cette thèse
Gaz Phase solide
Produits principaux Contiennent de l’azote (principal produit = HCN)
Contiennent de l’azote Diversité des produits Grande
(HCN <1% du carbone
Grande
NH3 ~15 ppm linéaire ( ) => impact de la variation du %CH4 sur le spectre IR des tholins
- Diminution des bandes amines - Augmentation des
bandes carbone aliphatique Comparaison à Cassini Loi de puissance pour la
quantification relative des nitriles : [CxH2x-1N]=[HCN].x-5 Spectres IR en accord : VIMS: 2900 cm-1 (carbone aliphatique) CIRS: 1480 – 1350 cm-1 (carbone aliphatique) 515 and 325 cm-1 (non identifiés)
Limites de la détection Composés détectés les plus lourds :
m/z ~130
Composés détectés les plus légers
m/z ~60
Processus de formation - La chimie ionique augmente l’incorporation d’azote dans les tholins
- La transition gaz-solide à probablement lieu à quelques dizaine d’uma (m/z ~100)
1
Chapter I
Titan - Observations
and Experimental Simulations
I.1 Titan
I.1.1 Past and present exploration
Titan has been first observed in 1655 by Christiaan Huygens and finally named by John Herschel in 1847. It is now known to be the largest satellite of Saturn among 62 detected, and the second biggest of the Solar System after Ganymede. It is also the only satellite of the Solar System that present a dense atmosphere, first suspected in 1908 by Comas i Sola who observed the darkening of Titan's limb.
The possibility of the existence of Titan's atmosphere was then justified by James Jeans who first studied the escape of planetary atmospheres and demonstrated that assuming cold temperature on Titan (below 100 K) volatiles compounds, with exception of Hydrogen and Helium could have been kept by Titan (Jeans 1931).The existence of this atmosphere was definitely proven in 1944 by Gerard Kuiper who detected the presence of methane (CH4) around Titan with ground based spectroscopic measurements in the infrared wavelength range (Kuiper 1944). Ground based infrared spectroscopic observations performed in the 1970's detected four other hydrocarbons. Deuterated methane (CH3-D), acetylene (C2H2), ethylene (C2H4) and ethane (C2H6) were thus added to the list of compounds present in Titan's atmosphere (Gillett 1975).
The next step on knowledge about Titan's atmosphere came from space exploration. Especially, the Voyager 1 and Voyager 2 space probes flew by Titan in the early 1980's and confirmed that brownish color of Titan was due to the presence of aerosols in the atmosphere, as suggested by Sagan based on laboratory experiments (Sagan 1971).
Voyager probes were able to observe Titan in the infrared thanks to the IRIS spectrometer (which performed absorption spectroscopy from 200 to 1400 cm-1) and in the UV with the UVS instrument. Molecular Nitrogen (N2) was determined as the major component of the atmosphere (Strobel and Shemansky 1982) and methane as the second most important compound, with a concentration of a few percent (Hanel et al. 1981). Numerous other
2
molecules have been quantified thanks to these observations, such as C2H2, C2H4, C2H6 and HCN (Maguire et al. 1981). Others were detected as traces such as C4H2, HC3N, C2N2 and CO2 (Kunde et al. 1981; Letourneur and Coustenis 1993). Using limb observations and radio occultation it was also possible to deduce vertical temperature profile and vertical and latitudinal distribution of some compounds (Lellouch et al. 1989; Coustenis et al. 1991). The previous space exploration mission only flew by Titan. The first (and up to now unique) mission to satellite within the Kronian system was the NASA/ESA Cassini-Huygens mission, launched in 1997 and which reached Saturn in 2004. In addition to study the whole system of Saturn, one of the objectives of this mission was to get deeper information about Titan (Coustenis et al. 2010). The objectives for the chemical study of Titan’s atmosphere were:
- Determine the abundance of atmospheric constituents and their vertical and horizontal distribution.
- Detect new gaseous molecules.
- Determine the possible energy sources for the atmospheric chemistry and their relative contribution.
- Study the formation, composition and distribution of the aerosols
- Investigate the upper ionized atmosphere and determine its possible role on the neutral and ionized chemistry, and on the aerosols formation.
To do so, the mission carries twelve instruments, and the Huygens descent probe six. The instruments able to bring partial answers to the objective on the atmospheric chemistry were: Onboard Cassini:
- CAPS (CAssini Plasma Spectrometer): dedicated to the study of charged particles in Saturn magnetosphere. Although it was not its first goal, this instrument has been able to detect heavy negatively charged ions in Titan’s ionosphere (Young et al. 2004; Coates et al. 2007).
- INMS (Ion and Neutral Mass Spectrometer): in-situ monitoring of Titan’s ionosphere. INMS measurements allowed identifying numerous gaseous species (and possibly aerosols precursors) and characterizing the chemistry in Titan’s high atmosphere. (Waite et al. 2005; Vuitton et al. 2007).
3
- CIRS (Composite InfraRed Spectrometer): One of the infrared spectrometer of Cassini, originally built to characterize the thermal IR emission of Titan and thus the altitude and latitude profile of the atmosphere. CIRS can be used to detect and quantify gas compounds in Titan’s low atmosphere (< 400 km). It has also detected some aerosols features in the far-IR (Flasar et al. 2005; Vinatier et al. 2010; Anderson and Samuelson 2011; Vinatier et al. 2012).
- VIMS (Visible and Infrared Mapping Spectrometer): It is the other IR spectrometer, in charge of characterizing the chemical composition of surfaces and atmospheres. VIMS also detected possible aerosol signature in the mid-IR. (Brown et al. 2004; Rannou et al. 2010).
- UVIS (UltraViolet Imaging Spectrograph): It is the only instrument on Cassini that can sample the mid-atmosphere (its altitude range goes from 250 km up to 1200 km), whereas IR spectrometer provide information on the low atmosphere and in-situ MS on the high atmosphere (Esposito et al. 2004).
Onboard Huygens:
- ACP-GCMS (Aerosol Collector and Pyrolyser – Gas Chromatograph and Mass Spectrometer): It collected aerosols and pyrolized them. Pyrolysis products were then introduced either directly in a MS or in a GC-MS. This experiment, probably the most interesting regarding the content of my thesis, did not worked nominally due to some technical problems. Nevertheless, it has been able to identify major aerosols pyrolysis product to be HCN and NH3 (Israel et al. 2005; Coll et al. 2013).
- DISR (Descent Spectral Imager Radiometer): It was dedicated to imaging the surface of Titan. DISR performed spectroscopic measurements of the atmosphere (in both IR and visible), providing numerous information on the low atmosphere of Titan, as on the aerosols morphology (Tomasko and et al. 2005; Tomasko et al. 2008)
- HASI (Huygens Atmosphere Structure Instrument): It provided data on the physical properties of the atmosphere (Pressure, Temperature, Electrical Properties…) (Fulchignoni et al. 2005).
4
I.1.2 Current knowledge on Titan's atmospheric aerosols
Results from the Cassini mission and other observations allow drawing a first scheme of Titan’s aerosols properties and formation processes. A complete overview of the problem can be found in Waite et al. 2010 and Tomasko and West 2010, the main results are reminded here.
I.1.2.a Formation processes
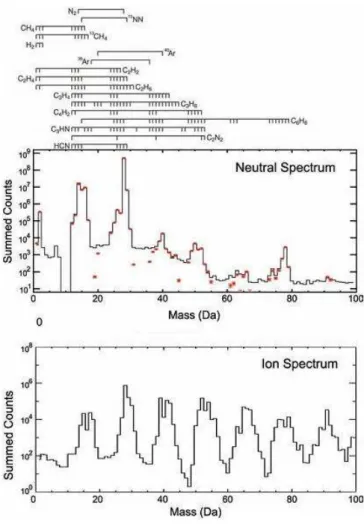
The IσMS instrument which provided the neutral and ion mass spectra of Titan’s high atmosphere around 1 000 km emphasized the presence of numerous different compounds, mainly hydrocarbons and nitriles (Waite et al. 2007; Vuitton et al. 2009) (see Figure 5).
Figure 5: Composite mass spectra for neutrals (top) and ions (bottom) based on Cassini INMS data (black line) acquired during 17 flybys of Titan ~1000 km. Products signaled above the neutral spectrum are the one used for the mass deconvolution (red dots). From Waite et al. 2007.
5
These compounds could be the first step of the intense organic chemistry leading to aerosols production. Other measurements performed with the CAPS instrument showed the presence of heavy negatively charged ions around the same altitude (see Figure 6).
Figure 6: Masse/charge spectrum of negatively charged ions taken at 1015 km during flyby with the CAPS instrument (black line), and model outputs for different altitudes (color lines). From Lavvas et al. 2013
Models outputs from Lavvas et al. 2013 show that the heavy part of the distribution (m/z > 100) increases when altitude decrease, emphasizing a growth of these heavy negatively charged particles, when they sediment in Titan’s high atmosphere. This result has been recently confirmed by measurements of the CAPS instrument that in addition found no evidence of these heavy particles above 1100 km (Wellbrock et al. 2012). These particles are probably aerosols that acquired charged in interaction with free electrons in Titan’s ionosphere (Lavvas et al. 2013 and reference therein).
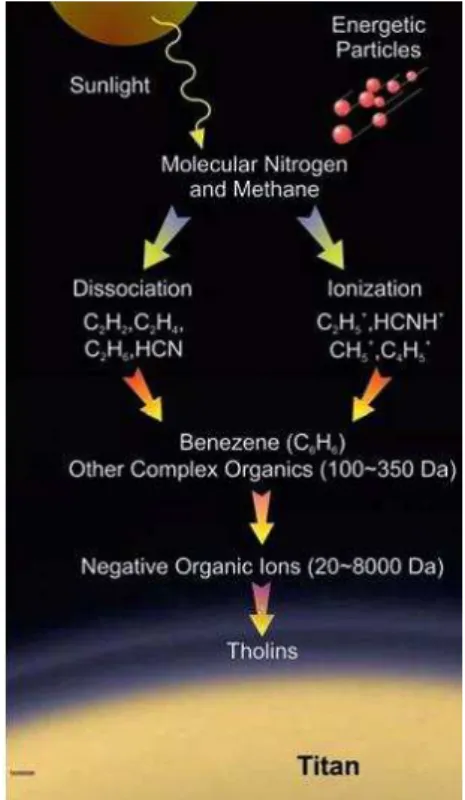
These observations led to a commonly proposed formation pattern presented in Figure 7. The first step of the chemistry leading to aerosols formation is the ionization and dissociation of nitrogen and methane. This activation can be done both by photochemistry with solar photons, or by collisions with electrically charged particles coming from Saturn’s magnetosphere. Actually a study by Robertson et al. 2009 showed that, even if the concentration of species
6
detected by INMS is less during the night, when no photochemistry occurs, the species detected are similar to the one detected during the day. This would mean that both energy sources induce a similar chemistry in the atmosphere.
The second step of aerosols formation may be the formation of light volatiles such as HCN, C2H2 or NH3, actually detected in the atmosphere. These species could then themselves recombine to produce bigger ones such as aromatics molecules which then form bigger poly-aromatics hydrocarbons (PAH) complexes (which could be close to the heavy ions detected by CAPS) and then aerosols.
Nowadays, largely supported by laboratory experiments, it starts to be admitted that the chemistry does not exclusively pass through a hydrocarbon way involving PAH, but also probably includes a large amount of nitrogen and poly-heteroaromatics (PANH) compounds within aerosols (Imanaka et al. 2004; Vuitton et al. 2007; Imanaka and Smith 2010; Sciamma-O'Brien et al. 2010; Yelle et al. 2010; Gautier et al. 2011). This idea is supported by the results of the ACP instrument onboard Huygens which detected two nitrogenous compounds (HCN and NH3) as main product of aerosols pyrolysis (Israel et al. 2005).
7
I.1.2.b Physical and chemical properties of Titan s aerosols
Polarimetric measurements done by the Voyager 2, Pioneer 11 (Tomasko and Smith 1982) and Huygens missions (Tomasko et al. 2008) showed an important backscattering of the linearly polarized light by the aerosols. This was interpreted as the consequence of light scattering by aggregated small particles, with radii of about 50 nm for the monomers. The best constraint on observation also requires using fractals particles instead of simple spherical aerosols (Cabane et al. 1993; Rannou et al. 1995; Rannou et al. 2003). Each aggregate seems to be composed by about ~3,000 monomers.
The main information available on Titan’s aerosols composition comes from their signature in the infrared. The VIMS instrument measurements show a possible absorption band of the aerosols around 3.4 µm (2950 cm-1) presented in Figure 8 (Bellucci et al. 2009; Rannou et al. 2010). This pattern could be due to aliphatic carbon –CH2 and –CH3 bonds within aerosols (see Chapter IV).
Figure 8: Observation of the 3.4 µm feature in Titan's (black) and Saturn's (red) atmospheres. The blued dashed line represent the CH4 band at 3.3 µm modeled for 1.6% of CH4. From Bellucci et al. 09.
The CIRS instrument also provided aerosol signature in the far-Infrared below 1500 cm-1 as shown in Figure 9 (Vinatier et al. 2010; Anderson and Samuelson 2011; Vinatier et al. 2012).
8
Figure 9: Titan's aerosols spectrum (15°S, ~80 km) in the far-IR. From Vinatier et al. 2010, Anderson & Samuelson 2011, Anderson, private communication.
The three bands at 1320, 1380 and 1450 cm-1 confirm the aliphatic carbon (-CH2 and – CH3) bonds in the aerosols. The other features in this spectrum are still unexplained. For more details on the IR spectroscopy of aerosols, refer to chapter IV of this thesis.
The ACP instruments onboard Huygens also provided a few information on the aerosols (Israel et al. 2005). Figure 10 shows the mass spectrum of the gas resulting from a pyrolysis of aerosols during Huygens descent. Red bars represent the signal from the sample and green one the signal during background measurements.
Figure 10: Mass spectrum of the gas resulting from pyrolysis of Titan's aerosols sample at 600°C. From Israel et al. 2005.
9
The main products detected by the ACP experiment are located at m/z 17 and m/z 27. These two peaks are respectively attributed to NH3 and HCN. It has to be noticed that this products have been observed only when heating the sample up to 600°C. This indicates the refractory nature of Titan’s aerosols and excludes the hypothesis that aerosols may be formed of pure hydrocarbons.
I.2 Titan in a can Laboratory analogs of Titan s aerosols
Even though the Cassini-Huygens mission provided numerous information on Titan’s aerosols, the knowledge of their formation processes and of their composition and properties is still fragmented.
To complete the scheme, the most accessible way is to perform laboratory experiments. All the existing laboratory simulation of Titan’s atmosphere use basically the same principle: providing energy to a N2-CH4 (or close) gas mixture to induce first gas chemistry and then the formation of laboratory analogues of Titan’s aerosols, so called tholins. Some of these simulations use photochemical irradiation, where photons provide energy to the mixture, whereas other experiments, such as PAMPRE, provide energy by electronic impact within a plasma. The problematic of comparing both energy source is not the main aim of this chapter, but has been discussed in the literature (Cable et al. 2011, Alcouffe 2010)
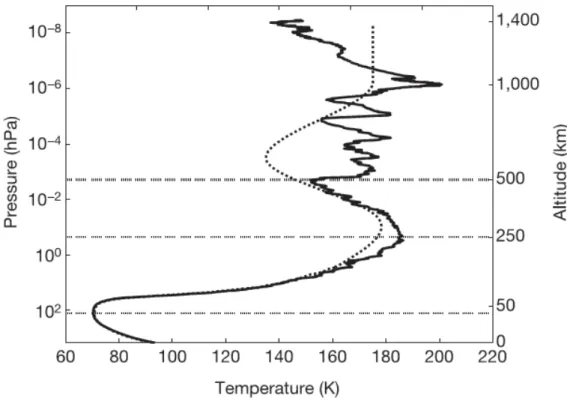
The three main parameters determined by Cassini-Huygens that should be taken into account for setting up an experiment simulating Titan’s aerosols formation are the pressure, the temperature and the gas composition, i.e. the methane mixing ratio in nitrogen. The temperature profile determined by HASI is given in Figure 11. The pressure in the reactors I used during this thesis (see chapter II) was comprised between 0.5 mbar (Bochum reactor) and 8 mbar (APSIS reactor in certain conditions). In Titan atmosphere, this pressure corresponds roughly to the top of the stratosphere, i.e. 200-250 km. It should also be noticed that even if the temperature of 300 K used in my experiment is much higher than Titan’s ground temperature (90 K), the temperature in Titan’s atmosphere is maximum at the top of the stratosphere, with almost 190K at 250 km.
10
Figure 11: Titan's atmosphere temperature profile determined by HASI onboard Huygens. From Fulchignoni et al. 2005
The GC-MS instrument provided the CH4 density profile in the low atmosphere, showing that CH4 concentration is maximum at the ground, with a mole fraction of about 4.9% and decreases rapidly with altitude to reach 1.7% mixing ratio at 30 km before following an asymptotic behavior with a mixing ratio of 1.4% at 140 km (see Figure 12 and Niemann et al. 2005).
11
Measurements performed with CIRS at and INMS confirmed a value of respectively 1.6 ±0.5 % around 15 mbar and 2.2% around 1200 km (Flasar et al. 2005; Waite et al. 2005). These measurements confirmed that CH4 is well mixed in the atmosphere above 30 km until at least the thermosphere.
To understand the formation of tholins, there are two different and complementary approaches. The first is bottom-up studies, where the work is focused on the study of the gas phase leading to tholins (both its composition and reactivity). The second is a top-bottom approach where tholins properties and composition are examined to infer their formation processes. I used these two different approaches for this thesis.
More than eighty references can be found in the literature on experimental simulations of Titan’s atmosphere and tholins analysis. The properties and composition of both the gas phase and the aerosols produced are dependent on the experimental parameters. The main parameters varying from an experiment to another are the energy deposition method, the physical conditions (pressure, temperature), and of course the reactors design. However, two recent reviews papers (Cable et al. 2011; Coll et al. 2013) provided a quite complete overview of the experiments performed to study tholins formation.
I.2.1 Gas Phase
Several studies are dedicated to the gas phase in laboratory experiment, but, with exception of Ruiz Bermejo 2009 and Imanaka and Smith 2010, were performed before the Cassini Era. All these study were thus dedicated to the identification of compounds present in gas phase, for extrapolation on Titan’s atmospheric composition.
Looking at the gas phase products in Titan’s atmospheric experiments depicted in the literature, it appears clearly that these products are mainly hydrocarbons and nitrogen-bearing species (De Vanssay E and Raulin 1995; Coll et al. 1999; Ramírez et al. 2005; Imanaka and Smith 2010). Nitrogen bearing species are mainly nitriles with a few amines and imines. Most molecules detected are light species (less than 10 carbon or nitrogen atoms) with many unsaturated molecules. It has to be underlined that experiments using cold plasma produce an amount of nitrogen-bearing molecules much higher than photochemical irradiation simulations. A probable explanation is that the energy distribution function of the electron within a plasma is slightly wider (especially the tail of the distribution at high energies) than
12
the energy distribution of solar photons. These energetic electrons are the one able to dissociate and ionize N2 (Szopa et al. 2006; Alcouffe et al. 2010).
However, the literature on the gas phase in Titan’s atmospheric experiment is limited to providing an exhaustive list of compounds detected in the experiment, but is not focused on the transition between the gas phase and aerosols. Several questions remain thus on the gas phase and I will focus my work on the following two points:
- First, what are the mechanisms involved in the gas phase chemistry, and what is the reactivity of products detected in the frame of Titan’s atmospheric chemistry?
- Second, what are the species “used” as precursors for aerosols formation?
I.2.2 Tholins optical properties in the Infrared range
Looking at the aerosols themselves, the main data available for comparing laboratory tholins with Titan’s aerosols are their optical properties. Especially the infrared signature of Titan’s aerosols provides numerous comparison points with their laboratory analogues. The first study analyzing tholins properties in the IR was Khare et al. 1984 which provided the optical constants of tholins from soft X-rays to Microwave frequencies. Due to its wide expertise area, this paper has been used as a reference for many studies and comparison with observations of Titan’s atmosphere. However the tholins spectrum in the IR presents major discrepancies with actual observations of Titan (Anderson and Samuelson 2011). Recently, few studies started to investigate the absorption properties of tholins in the mid-infrared. Imanaka et al. 2004 reported the main function visible in the IR spectrum and the influence of the experimental pressure on the infrared signature of tholins (Figure 13).
13
Figure 13: Comparison of IR spectra produced by plasma discharge in CH4/N2 90/10 gas mixture at different pressures. From Imanaka et al. 2004. The main bonding absorption area are reported on the spectra.
Authors also proposed a Gaussian deconvolution of the CN bonding pattern at 2200 cm-1, emphasizing that this pattern can be fitted using 6 different Gaussians (and thus representing six different configurations for the CN bonds within tholins). The main observation of this study is the influence of pressure on the aliphatic carbon pattern around 2900 cm-1. The higher the pressure, the more this pattern is visible. Bernard et al. 2006 also reported variability of this pattern and of the one at 2200 cm-1 between two samples harvested in two different area of the same experiments (and thus supposed to have two different compositions). Quirico et al. 2008 provided a comparison of the spectra in the mid-IR (4000 – 500 cm-1) range of tholins produced in the PAMPRE setup with different methane percentage. Once again, the aliphatic carbon pattern appears to be highly variable with methane percentage, whereas the global structure of tholins spectra is similar. Quirico et al. 2008 also compared tholins spectra with the spectrum of a poly-HCN polymer. Even if the spectra present similarities, it is clear that such polymeric material is not able to properly reproduce the spectrum of tholins. Although I did not focused on the optical constants (n and k index) of tholins during my thesis, it has to be noticed that two papers have been published recently on this problem in the visible wavelength (Imanaka et al. 2012; Sciamma-τ’Brien et al. 2012) providing comparison
14
with data on Titan’s aerosols. The influence of methane percentage on these index have been investigated during my thesis by the PAMPRE team (Mahjoub et al. 2012).
All these studies provided numerous information on tholins optical properties in the mid-IR and on the chemical functions present in the samples. However, it has to point out two main lacks in the literature:
- With exception of the old Khare et al. 1984 data, there is no study providing the aerosols absorption properties in the far-Infrared (below 500 cm-1), whereas, as seen above, the CIRS instrument onboard Cassini detected Titan’s aerosols signatures in this domain.
- The experimental data available in the literature on tholins infrared absorption properties are usually not compared with actual observations on Titan’s aerosols, either from the VIMS or from the CIRS instruments, respectively in the mid- and far-infrared.
In addition to comparing tholins with Titan’s aerosols, studies can be performed on tholins using advanced experimental analyses. Indeed, a bottom up approach can be used by investigating on the chemical composition of laboratory tholins to infer the composition and thus the formation processes of Titan’s aerosols.
Previous studies have been performed on tholinomics, the field defined in Pernot et al. (2010) as the chemical analysis of tholins. Elemental analysis provided a first chemical information on the C/N/H ratios in tholins (Imanaka et al. 2004; Sciamma-O'Brien et al. 2010; Cable et al. 2011). But it is not sufficient to determine their exact molecular composition. This is the reason why other types of chemical analyses have been used for tholinomics, such as infrared spectroscopy, X-ray photoelectron spectroscopy (Tran et al. 2003; Ruiz-Bermejo et al. 2008; Ruiz-Bermejo et al. 2009), chromatographic techniques such as gas chromatography-mass spectrometry (GC-MS); pyrolysis-GC-MS; high performance liquid chromatography (HPLC) (Ruiz-Bermejo et al. 2008; Coll et al. 2013), Nuclear Magnetic Resonance Spectroscopy (Derenne et al. 2012; He et al. 2012a; He et al. 2012b) or high resolution mass spectrometry (Hörst et al. 2012, Imanaka and Smith 2010; Pernot et al. 2010; Somogyi et al. 2012). All these analyses confirmed that tholins are probably based on organics polymer like structures,
15
not only made of hydrocarbons but also including a large amount of nitrogen which contributes to chemical functional groups of interest for astrobiology, such as amines or nitriles.
The remaining questions on tholins composition that I will try to answer in this thesis are: - What are the predominant molecules in tholins, and what is their role in
tholins formation?
- What are the chemical structures present in tholins and how do they differ in different tholins samples?
I.3 Conclusion
One of the most striking points about Titan is the huge amount of organic aerosols present in the atmosphere. The aerosol formation is not a minor phenomenon but actually a major aspect of Titan’s atmosphere. Actually the amount of aerosols produce is so large that the surface of the satellite cannot be seen from space in the visible wavelengths. Such quantity of aerosols (totally opaque in the visible, much less in the infrared) is of high impact on Titan’s atmospheric dynamic and radiative balance (Tomasko and West 2010).
In addition to its interest for planetary science, the study of Titan’s aerosols, particularly their composition, is of high interest for astrobiology. Indeed, this material is among the most complex organic material known in the Solar System with exception of Earth. Based on laboratory experiment, it appears that Titan’s aerosols are probably formed of H, C and σ based complex molecules up to several hundreds of atomic mass units (amu). Some laboratory studies performed on Titan’s aerosols analogs pointed out the formation of pre-biotic molecules such as amino-acids or purine bases when these materials are submitted to hydrolysis or produced in oxidative environment (Neish et al. 2009; Neish et al. 2010; Hörst et al. 2012).
The aim of this thesis is to answer some of the questions still running on Titan’s aerosols through the study of tholins. All the measurements performed on laboratory tholins will, as much as possible, compared to the fragmentary data available on Titan’s aerosols.
The main questions will be to characterize the chemistry and possible pathways leading to tholins formation. The second point assessed by this thesis will be to characterize with cutting
16
edge analytical techniques the properties and composition of tholins. To answer these questions, my work can be split up in two approaches.
The first one, presented in chapter III, is a bottom-up approach, by characterizing the reactivity and composition of the gas phase leading to tholins formation. This study is mainly based on mass spectrometric measurement in two N2/CH4 plasma reactors.
The second part of my work, presented in chapter IV, uses a top-bottom approach. This part is dedicated to the analysis of tholins using several techniques. The first one is the characterization of tholins mid- and far-infrared absorption properties. The second is the study by high resolution mass spectrometry (orbitrap) of tholins to investigate their chemical composition and get some clues on their formation pathways.
Although it is not directly linked to the first two parts, chapter V presents a study on the impact of the energy source used (plasma or photo-irradiation) on the gas phase reactivity.
17
Chapter II
Methods
In this chapter, we are going to see the different reactors used for this thesis, and present all the analytical techniques I used to characterize samples produced in these setups.
II.1 Experimental devices
II.1.1 The PAMPRE experiment: Synthesis of Titan's aerosols analogues
II.1.1.a Setup
The PAMPRE (Production d'Aérosols en Microgravité par Plasma REactif) setup, developed in LATMOS since 2002 (Szopa et al. 2006), is a radio frequency capacitively coupled plasma used to simulate the chemistry occurring in Titan's atmosphere and leading to the formation of solid aerosols. The PAMPRE experiment has been developed on the basis of a previously existing reactor developed in GREMI laboratory (Boufendi and Bouchoule 1994) used for dusty plasma studies in argon-silane discharges.
The stainless steel reactor is cylindrical; 30 cm in diameter by 40 cm height. A scheme of the PAMPRE setup is given in Figure 14. Optical windows are displaced around the reactor to allow spectroscopic diagnosis, UV-Visible emission spectroscopy and Infrared absorption spectroscopy. At the bottom of the reactor, a capillary tube connects the reactor to a quadrupole mass spectrometer.
18
Figure 14: PAMPRE experimental setup and diagnoses
All the experiments performed with PAMPRE in this thesis were done with an injected power of 30 W and in continuous current mode. The upper electrode is driven by a RF voltage at 13.56 MHz, and a grounded cylindrical grid confine the plasma in a controlled volume. This grid allows optical emission spectroscopy in the UV-Visible range. For IR measurements the cage is then withdrawn and a metallic plate in front of the polarized electrode ensures the role of the grounded electrode. The cold trap visible in this figure is described in detail in the ex-situ diagnoses part.
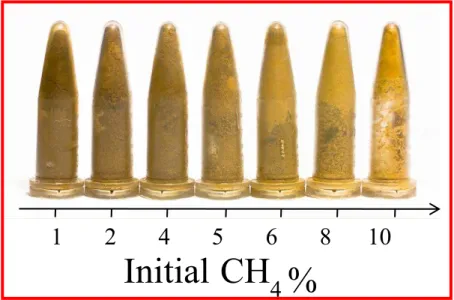
The gas mixture can be adjusted from 0% to 10% of methane in nitrogen using two bottles (100% N2 and N2:CH4 90:10). A third bottle containing pure argon can also be used for actinometric measurements. The gas is introduced in the reactor using mass flow controllers (MKS 247C) through the cathode using a showerhead design to ensure the uniformity of the gas within the discharge. The gas is then pumped out by a primary vane pump that allows to
19
vacuum the chamber down to 10-2 mbar. A turbo molecular pump (Alcatel ACT 200T) is used to pump the reactor down to 10-6 mbar for cleaning purposes.
Gas pressure is monitored by two pressure gauges, one baratron (MKS PR 4000) for working conditions pressures between 10-2 and 100 mbar, and a Penning gauge (Edwards Penning 505) for the 10-2 - 10-6 mbar pressure range, to check the ultimate vacuum for cleaning procedures Pressure can be controlled either by adjusting the incoming gas flow rate, or by using a diaphragm valve to limit pumping efficiency. Standard gas flow used for the experiments is of 55 standard cubic centimeter per minute (sccm) and the total pressure in the reactor is of 0.90 ± 0.05 mbar (with exception of experiment performed with a cold trap, see below).
Once plasma is triggered on, nitrogen and methane molecules are ionized and dissociated to initiate a complex organic chemistry leading to the formation of volatile compounds and of solid material. The solid material, so called tholins, can then be seen as an analogue of Titan's aerosols. The principal advantage of the PAMPRE design is that the aerosols are electrically charged. This means that, in addition to their weight, the ions drag force, the neutral drag force and a thermoforesis induced force, they are submitted to an electrostatic force. This allows particles to remain in levitation in the electric field as long as the forces compensate. Particles can then grow in volume (i.e. without any wall interaction, as in a free atmosphere) until they are too big to be maintained in the plasma. Once they reach this point, particles fall down through the confining grid at the bottom of the plasma and can be collected in the glass vessel surrounding the reactive area.
II.1.1.b In situ diagnoses
On the PAMPRE experiment, several diagnoses allow monitoring in-situ the plasma, neutral gases and dust in the reactor.
a. Quadrupole mass spectrometer: monitoring neutral gas
The first available diagnosis is a quadrupole mass spectrometer (QME 200, Pfeiffer). This spectrometer has a resolution of at m/z 100 and covers the mass range from 0 to 100 amu. Gas sampling is done though a capillary tube (0.8 mm in diameter), with a sampling orifice located 1 cm outside the reactive plasma. The capillary is long enough to reduce the gas flow rate between the reactor chamber and the QMS and keep operating
20
pressure in the MS below 10-5 mbar. This QMS allows detecting only stable neutral species. The QMS operates in electron impact mode at the standard 70eV electron energy. The QME 200 can be operated in two different methods. The first one, so called " scan analog" method provides the mass spectrum of a selected mass range, i.e. intensity of a peak versus the m/z ratio of this peak. This mode is especially used for detection and identification of species in the reactive mixture.
The second method, Multiple Ion Detection (MID), provides the temporal evolution of one (or several) selected peak, with a time resolution down to 0.2 s (depending of the concentration of the species, in order to get enough signal in the selected time dwell). This mode allows monitoring species of interest and their kinetics.
b. Optical Emission Spectroscopy (OES): plasma characterization
The second diagnosis on the PAMPRE experiment is a visible and ultra-violet spectrometer that can monitor the optical emission spectrum of the plasma. This can for example provide information on neutral temperature, nitrogen or cyanide bands intensity (Alcouffe et al. 2010). The light emitted by the plasma discharge passes through a silica window and then enters an optical fiber. The fiber exit is located at the entrance slit of the 60 cm focal length monochromator (Jobin-Yvon HRS). The maximal resolution of the spectrometer is 25 000, but in order to increase the signal to noise ratio, a split aperture providing a resolution of 5 000 is used on this spectrometer. A photomultiplier is displaced on the exit slit of the monochromator to collect signal, the current is measured by a Pico ammeter.
During my thesis, I mainly used this diagnosis to perform actinometric measurements of atomic hydrogen, which cannot be detected with the QME 200 mass spectrometer available on PAMPRE. I thus used actinometry to determine the atomic hydrogen content in the gas mixture. Actinometry is a diagnosis commonly used for the study of plasma discharges, which, among others, allows determining the H concentration. Hydrogen atoms are produced from the CH4 dissociation and are excited by electronic collision to radiative levels. These levels are then depopulated by radiative emission. In optical emission spectroscopy, the intensity of an H line is then proportional to the electron density in the plasma ne, to the rate coefficient for the population of the radiative level, , function of the electron temperature Te and to [H], the atomic hydrogen density.
21
(1)
Equation (1) shows that the intensity of the hydrogen lines depends on the hydrogen density, but also on some plasma parameters. In order to get free from this problem, it is possible to use argon as an actinometer gas. In PAMPRE experimental conditions, argon follows the same population/depopulation processes than hydrogen. The intensity of an argon line can then be established as:
(2)
The A parameter is a constant in the equation (1) but differs for argon and hydrogen. A depends on the volume of the plasma observed by OES, the spectral calibration factor of the optical device at a given wavelength, the photon energy and the Einstein coefficient for the observed line.
It is possible to combine equation (1) and equation (2) to get the H atoms density as follows:
(3)
Since the amount of argon is constant, [H] is proportional to the ratio between the intensities of the H and Ar lines, a constant B, and the ratio of the electronic rate coefficients.
To use this equation, we need to assume that the ratio of the electronic rate coefficients is constant. Alcouffe et al. 2010 showed that the electron temperature in the PAMPRE plasma varies when solid dusts are present in the plasma. However, Gicquel et al. 1998 calculated that the ratio of the electronic rate coefficients increase only about 10% when increasing electron temperature from 1 eV to 5 eV. Since electron energy remains on the order of few eV in PAMPRE experiment, we can consider, in a first approach, that the ratio is constant.
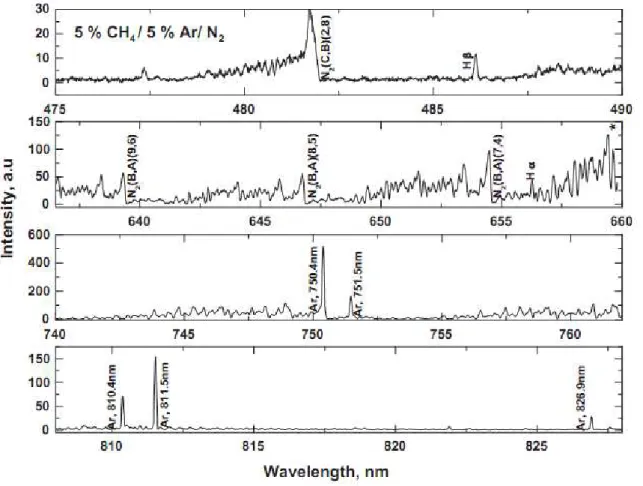
Spectra are recorded in the visible to the near-IR (475-825 nm) using a colored glass filter to eliminate overlapping of second order lines in the red and near-IR range. A spectrum of the discharge in the full wave range is given in Figure 15.
22
Figure 15: Emission spectrum obtained from 475 to 828 nm for a 95:5 N2/CH4 plasma discharge with 5% Ar as actinometer.
The spectrum is dominated by nitrogen molecular emission bands of the second positive system (SPS) N2(C B) and first positive system (FPS) σ2(B A), hydrogen emission of H (656.3 nm) and H (486.1 nm) and atomic Ar lines. In order to have limited variations of the electronic rate constants, one should use lines with excitation energies of the same order of magnitude and with similar cross sections for electron collisions excitation (Gicquel et al. 1998). As the excitation energies for Ar (811.5 nm) and H are similar (13.07 eV and 12.74 eV respectively) and as the lines are well isolated, these two lines were chosen for actinometric measurements in our case.
c. Fourier transform infrared spectroscopy: gas and aerosols IR signature The third diagnosis available on the PAMPRE setup is the Fourier Transform InfraRed spectrometer (FTIR, from Thermo Scientific). It is the only diagnosis able to study dust directly in the reactor and not ex-situ. This spectrometer covers a spectral range from 550 cm-1
23
up to 4000 cm-1, with an achievable resolving power of 0.1 cm-1, although this resolution is not needed in the case of dust absorption (most often I used a resolution of 2 cm-1 or 4 cm-1). A sketch of the IR setup seen from above is given in Figure 16.
Figure 16: Sketch of FTIR setup on the PAMPRE reactor, seen from above
The infrared beam is emitted by the FTIR and then focalized by two gold mirrors to reach maximum focalization point within the plasma. The beam is then collected by a Mercury Cadmium Telluride detector cooled down with liquid nitrogen to avoid thermal noise. In this set-up, the beam passes through the plasma. This allows getting the absorption spectra of the mixture in the reactor. Some gases presenting high absorption in the infrared (such as CH4, C2H2 or HCN for example) can then be detected easily. Since the beam passes through the plasma only once (no multi reflection, pass length of ~30cm), the spectral signature of the dust is still low.
II.1.2 Bochum setup
The second reactor used during my thesis is a plasma reactor developed at the Ruhr University Bochum, in the Institute for Experimental Physics II. This reactor has been designed for the study of dusty plasma and producing astroanalog dusts (Kovacevic et al. 2003; Kovačević et al. 2005; Stefanović et al. 2005). I used this reactor as a complementary setup of the PAMPRE reactor. Both reactors have slight differences, which induce differences in the experimental parameters, but they have complementary diagnoses. In particular the Bochum reactor host a multi-pass FTIR, whose pass length through the plasma is much higher than the one on the PAMPRE experiment.
24
II.1.2.a Reactor
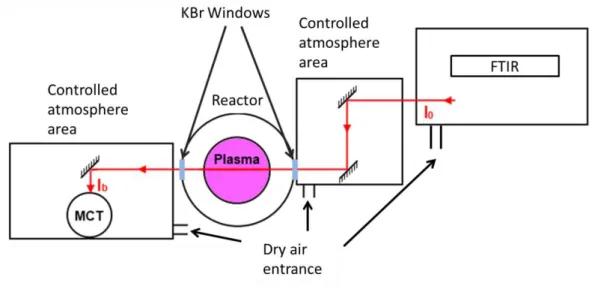
The reactor is a capacitively coupled radiofrequency plasma working at 13.56 MHz A general scheme of the setup (top-view) is given in Figure 17. The chamber has a diameter of 55 cm and a height of 30 cm. Polarized electrodes are two parallel stainless steel plates, 30 cm in diameter and separated by 8 cm,. and the reactor walls are grounded. The RF power applied to the plasma during this thesis was typically of 60 W for experiments at 0.5 mbar. As for the PAMPRE setup, the experiments presented in this thesis were performed in continuous working conditions.
Figure 17: Scheme of the Bochum plasma reactor, seen from above
The reactor is directly pumped by a turbo molecular pump (Pfeiffer TPU 261 C). This configuration limits the pressure range achievable in the reactor to a few 10-1 mbar. Gas flow is controlled by mass flow controllers (MKS 247C) and settled at 15 sccm total flow. I used a gas mixture of N2:CH4 with 90% of nitrogen and 10% of methane at a pressure of 0.5 mbar. In order to avoid film deposition on windows, the Nitrogen flux is built in a way that it flushes
25
the optical parts when introduced in the experiment. To clean the chamber between each experiment, oxygen plasma is used to eliminate dust and film deposited on the electrodes.
II.1.2.b In-situ Diagnoses
a. Fourier Transform infrared spectroscopy: Gas phase quantification
The infrared spectrometer installed on this reactor uses the same principle of Fourier Transform Infrared Spectroscopy (FTIR) as described for the PAMPRE reactor. The main difference between the two setups is that the spectrometer used for the Bochum reactor (Bruker Equinox 55) has a multi-pass analysis mode. Once emitted by the spectrometer, the infrared beam passes through KBr windows to enter the plasma chamber. The beam is then reflected several times by gold mirrors on both sides of the plasma (see Figure 17). This increases the effective pass length of the beam in the reactive medium, and thus the sensibility of the detection. The beam has a radius of 1 cm, but because of the multi reflections of the beam, the final monitored area has a size of 2 cm height by 5 cm wide. The pass length through the plasma can be adjusted from 0.6 m (two passes) up to 7.2 m (24 passes). After multi-passing the plasma, the beam is focused on a liquid nitrogen cooled MCT detector. The influence of atmospheric water and CO2 is minimized by enclosing the detection system and flushing it with desiccated and CO2 purified air.
b. Quadrupole mass spectrometry: Products and kinetics monitoring
The quadrupole mass spectrometer (Plasma Process Monitor 422, Pfeiffer) uses also similar principles as the one on the PAMPRE reactor. The resolution of the spectrometer is about
m/ m = 100 at m/z 100, and the spectrometer extraction hood is directly located within the
reactor chamber to enable ions detection. However the lower pressure in Bochum setup induces a higher detection limit of the MS.
c. Tholins harvest: Thermophoretic technique
The solid aerosols produced in a RF plasma are electrically charged, and thus submitted to five different forces (Bouchoule 1999; Berndt et al. 2009):
-The electrostatic force Fe -The Gravity Fg
26 -The ion drag force Fi
-The neutral drag force Fn -The thermophoretic force Fth
As long as the dusts are maintained in the plasma, these forces counterbalance such as their resultant (Fr) equals zero:
(4)
Any modification of the forces cited above would then induce a movement of the particles and possibly its ejection from the plasma. This happens for example when dust get bigger, which improve both their surface and weight, and thus affect (principally) both neutral drag force and gravity, implying the ejection of the dust from the plasma (case of PAMPRE reactor).
On Bochum reactor, the dust is collected using a modification of the thermophoretic force. The general principle is described in Godde et al. 2011. The thermophoretic force is proportional to the square of the particle radius (rp) and of the neutral gas temperature (Tn) gradient:
(5)
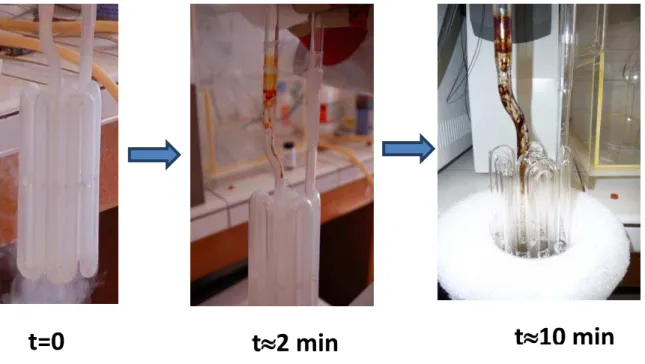
A metallic plate (usually copper or stainless steel) is introduced within the plasma. The plate is then cooled down using liquid nitrogen, inducing a gradient in the neutral gas temperature within the reactor. The gradient will increase the strength of the thermophoretic force and thus modify the global balance of forces applied to the dust. The dust will then be shifted toward the cold spot, in our case the metallic plate were dust accumulate. This plate is then removed from the plasma, with dust forming a thin layer on its surface.
II.1.3 Photochemical experiment: the APSIS setup
Even if plasma simulations are the most efficient for production of Titan's aerosols analogues, it is important to note that Titan's atmospheric chemistry is mainly driven by photochemical processes (Robertson et al. 2009). To address the issue of the sensitivity of the global chemistry to the energy source, the LATMOS team designed a new photochemical
27
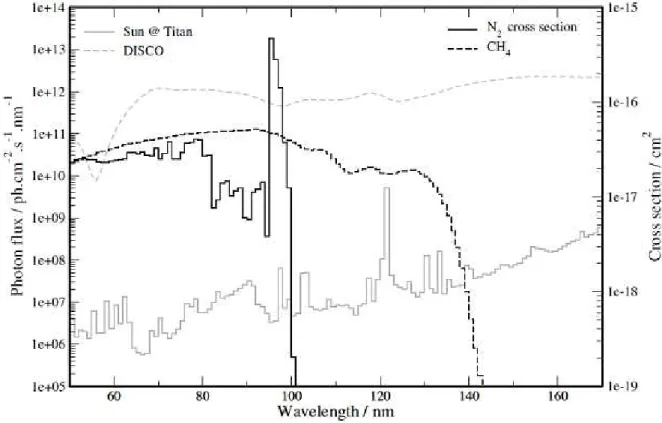
reactor, APSIS, for Atmospheric Photochemistry Simulated by Synchrotron. Photon sources covering the VUV spectrum needed to dissociate molecular nitrogen may be found on synchrotron radiation facilities (see Figure 18 and Imanaka and Smith 2007). The APSIS reactor is coupled with a VUV photon source. In the work presented here, the photon source was DISCO, a VUV bending magnet based beam line at the SOLEIL synchrotron radiation facility (Giuliani et al. 2009; Giuliani et al. 2011). The DISCO beam line has three end-stations including the APEX (Atmospheric Pressure Experiment) one, used for the APSIS reactor. The APEX station is fitted with a differential pumping system which allows delivering VUV photons from 220 nm down to 60 nm, up to a pressure of 1 bar.
The photon flux of DISCO is given in Figure 18, with the solar photon flux at the top of Titan’s atmosphere, as the activation cross sections of σ2 and CH4. As visible in this figure, the spectrum of DISCO is 104-106 times more intense than the solar one, which ensure achievable time scales for experiments, but much more uniform on the 60 – 170 nm range. Contrary to the solar spectrum, the DISCτ spectrum does not present peak at Lyman at 121.6 nm.
28
Figure 19: Scheme of the APSIS reactor
The reactor (presented in Figure 19) is a stainless-steel parallelepiped box with inner dimensions of 500 mm x 114 mm x 92 mm. The geometry of the reactor is elongated to accommodate the optical depth of CH4 in the running experimental conditions. The reactive gas mixture consists in 10 % of methane in molecular nitrogen (purity >99.999%, Air Liquide). The gas flow can be adjusted from 0 to 10 sccm with a MKS mass flow controller. The out flowing of the gas is ensured by a primary pumping. The pressure in the reactor is measured with an absolute capacitance gauge (Ceravac, Oerlikron). The partial pressure of the reactive mixture reaches a few millibars and residence time of the gas is a few minutes. The reactor can be pumped down to 10-5 mbar with a turbo molecular pump before each experiment for cleaning purpose. A Helium flow is introduced upstream the reactor (see Figure 19) to confine reactive mixture inside the reactor without using any windows.
The diagnosis available on the APSIS reactor is the quadrupole mass spectrometer of the PAMPRE reactor, which can be relocated on the APSIS setup. It is also possible to adapt the cryogenic trapping (see below) of the PAMPRE reactor on APSIS.