HAL Id: halshs-00556940
https://halshs.archives-ouvertes.fr/halshs-00556940
Preprint submitted on 18 Jan 2011
HAL is a multi-disciplinary open access archive for the deposit and dissemination of sci-entific research documents, whether they are pub-lished or not. The documents may come from teaching and research institutions in France or
L’archive ouverte pluridisciplinaire HAL, est destinée au dépôt et à la diffusion de documents scientifiques de niveau recherche, publiés ou non, émanant des établissements d’enseignement et de recherche français ou étrangers, des laboratoires
the Most for Private Investment in Middle East and
North Africa
Marie-Ange Véganzonès-Varoudakis, Ahmet Faruk Aysan, Zeynep Ersoy
To cite this version:
Marie-Ange Véganzonès-Varoudakis, Ahmet Faruk Aysan, Zeynep Ersoy. What Types of Perceived Governance Indicators Matter the Most for Private Investment in Middle East and North Africa. 2011. �halshs-00556940�
Document de travail de la série
Etudes et Documents
E 2008.02
What Types of Perceived Governance Indicators Matter the Most for Private Investment in Middle East and North Africa
Ahmet Faruk Aysan* Zeynep Ersoy*
Marie-Ange Véganzonès –Varoudakis**
19 p.
* Boğaziçi University, Department of Economics, Istanbul, Turkey ** CERDI, CNRS, Université d’Auvergne, France
Abstract
By using a simultaneous equations model, this paper establishes that the perceived quality of governance, which is measured by three different indicators “Quality of Administration”, “Public Accountability” and “Political Stability”, has a positive effect on the private investment decisions in the developing countries. Our model allows us to point out the fact that the mechanisms through which each type of indicator affects private investment are different. In addition to our primary result we also show that Middle East and North Africa (MENA) region could have attained a better private investment performance if it had reached a more advanced level of perceived institutions in last two decades. The low level of public accountability, among other governance deficiencies, was predominantly responsible for the deficiency in private investment in MENA.
1. Introduction
The quality of governance in the Middle East and North Africa (MENA) region is generally considered to be inadequate. Although this is true for a large number of institutions, quality of governance is a wide-ranging phenomenon and its distinct features may exhibit quite different paths for the same region (see Table I). For example in terms of the administrative quality and political stability indicators used in this paper, MENA ranks third in average during 1980 to 2002-with scores of 0.14 and 0.07 respectively- among the six developing regions and is superior to Africa (AFR), Latin America (LAC) and South Asia (SAS). This basic comparison shows that contrary to common belief, MENA is not particularly deficient in institutional quality when measured by these indicators. On the other hand political accountability for the MENA is the lowest among the regions with the score of -0.901. The different levels of advancement displayed by the various governance indicators in the MENA region (as well as other regions) suggest that the mechanisms shaping each indicator can be quite different. Hence these different types of governance institutions are also expected to exert their influences on the economic variables differently as well. So, in this paper we focus on the various different dimensions of governance indicators and analyze the impact of various types of perceived governance institutions on the level of private investment in MENA.
There is an emerging literature on the quality of governance which advocates that “good” governance institutions are needed for successful market-based economies2. The impact of institutions on economic growth3 , GDP per capita4 and or volatility of the economic activity5 have been studied extensively in the recent years. Although private investment is one of the main channels through which institutions exert their influence on growth and economic development, very little research is done on the relationship between private investment and governance institutions. The existing studies on governance and private investment have generally concentrated on the effect of the rule of law6. Private investment is very much responsive to the changes in the business environment; which governance constitutes an important element. The forward looking nature of investment highlights the importance of a stable and secure environment. World Bank (2004) finds a strong positive link between the investment climate and private investment decisions and suggests that better governance improves the investment climate by improving bureaucratic performances and predictability which in turn reduced uncertainty and the cost of doing business.
Since governance is an important determinant for investment, private investors would want to know about the quality of the governance institutions at the time of making investment decisions but they may not know the actual governance establishments with 100% accuracy. Hence they collect information about the quality of governance institutions from various sources
1 Table II, also confirms the same result .The level of the variables associated with administrative quality and political stability look rather satisfactory for the MENA region. In contrast, in terms of political accountability variables –civil liberties and government stability- MENA has the lowest score among all the regions. 2 See in particular Rodrik (1999) and Frankel (2002).
3 See for example Knack and Keefer (1995) and Acemoglu, Johnson, and Robinson (2001) among others. 4
See Acemoglu, Johnson, and Robinson (2001) among others. 5
See for example Acemoglu and Taicharoen (2003).
6 Under this category the security of the property rights is the most studied and empirically validated component. See North (1981) and Knack and Keefer (1995)
to form their perceptions about these institutions. Since their opinions on governance institutions are crucial in making the investment decisions, perceived level of quality of the governance institutions needs to be analyzed as a determinant of private investment. For the governance variables we use the data obtained from International Country Risk Guide (ICRG) and Freedom House (FH). These are independent private firms that provide consulting services to international investors. We argue that, this data set can be a good proxy to measure the perceptions of the investors about the institutions. We also allow for the possibility that perceived and actual institutions may actually differ. Based on the existing literature, we classify governance institutions in three groups as “Administrative Quality”, “Political Stability” and “Political Accountability”. The first one, Administrative Quality contains four variables from the ICRG: “Control over Corruption”, “Quality of Bureaucracy”, “Investment Profile”, and “Law and Order”7.This governance unit shows the capacity of the government to provide investment-friendly and reliable conditions for the private investors. Political Stability is composed of the following four variables from ICRG: “Government Stability”, “Internal Conflict”, “External Conflict” and “Ethnic Tensions”. The lack of Political stability creates uncertainty which has detrimental effects for the level of investment. Our last indicator, Public Accountability consists of two indicators from FH: “Civil Liberties” and “Political Rights”. Private investment decisions are highly sensitive to the perception of the credibility and persistence of the political regime, as well as of policies (See Rodrik 1991). A participatory political system provides the stability of social institutions and ensures a broad public support to policies, which are in this case more sustainable in the long run.
The neoclassical flexible accelerator model (Jorgenson, 1963) is based on the neoclassical idea of the theory of the firm. The determinants of investment in the neoclassical flexible accelerator model include the expected aggregate demand (the accelerator), the user cost of capital, the wage rate and the initial capital stock. The firms in developing countries face certain constraints that are not accounted for in the conventional neoclassical theory8. One of the main constraints confronted by the investors in the developing countries is the deficit in economic reforms. Structural reforms are important determinants of the actual and future profitability of private investment. Our structural reforms index includes trade policy and financial development. Financial development is an important determinant for private investment since it creates profitable investment opportunities. A developed financial system mobilizes and allocates resources to the projects that will create the most surplus. Trade reforms can also encourage private investment decisions. The link between persistent growth and trade openness is generally acknowledged (See Bisat et. al., 1996). In addition to their direct effects; economic reforms are also expected to affect private investment through their impact on institutional quality. For example, there is some evidence that greater openness to trade and stronger competition are conducive to institutional improvement (Berg and Krueger 2003). Human capital is also an important determinant for the level of private investment. Human capital stimulates private capital formation by raising the profitability of investment and can provide positive externalities (Mankiw, Romer and Weil 1992). Additionally, human capital gives rise to institutions with better quality. More educated people with higher life expectancy become more competent bureaucrats demand for better quality of bureaucracy (Galor et al., 2005). In the
7
These four variables (as well as the components of the other two groups) are aggregated using the Principle Components Analysis to form a broad index for the Quality of Administration.
8 See in particular Shafik (1992), and Aysan, Pang and Véganzonès-Varoudakis (2007) for a discussion and additional references.
developing countries, the government is still the pre-dominant actor in the economy. Hence the level of government consumption can be an important determinant for private investment for these countries. When government spending is used to finance projects which increase the profitability of the private investment (like health and education services) then the effect of this factor on private investment will be positive. On the flip side government consumption can reduce the amount of funds available to the private sector. This effect is most likely to be observed through the increase in the interest rates (Binter 1977) and future tax burden (Friedman 1976). Since government consumption can have beneficial as well as damaging effects on the private investment in theory, the overall impact of this variable on the level of private investment needs to be analyzed empirically. Government spending is expected to have a positive effect on governance. For example the improvements in the living standards of the bureaucrats caused by the increase in wages can induce them to form better governance institutions. 9
Aysan, Nabli and Véganzonès-Varoudakis (2007) have reexamined and updated the International Finance Corporation (IFC) data set for private investment by consulting the national sources, IMF and World Bank series and country economists. We use their disseminated data set (which covers the period from 1970 to 2002 and includes 60 developing countries) in our study. Private investment and different forms of governance institutions are jointly determined so we use a simultaneous equations model. The procedure of this model is justified by the fact that private investment can have a direct effect on the institutions10. Our findings show that the perceived quality of governance institutions plays an important role in private investment decisions. “Administrative Quality” (QA) and “Political Stability” (PS) and “Political accountability” (PA) are crucial for the determination of private investment. This result supports the hypothesis that different categories of governance institutions effect private investment through different channels.
2. The Econometric Analysis 2.1. The Model Tested
In our empirical model, endogenous variables are the share of private investment and the various measures of governance, namely Quality of Administration (QA), Political Accountability (PA) and Political Stability (PS). To incorporate the two-way causality into our analysis, we form a system of equations to estimate the share of private investment (PI) in GDP and quality of governance institutions (IQ) simultaneously. In the private investment equation, perceived quality of governanceinstitutions is expected to increase the private investment. In the governance equation, the sign of the coefficient of private investment is expected to be positive. This system of equations is estimated using three stage least squares by controlling for the other determinants. The model estimated is the following:
PIit =α0 +α1IQit +α2X1i +ε1it (A)
9
See Azariadis and Lahiri (2002) 10
For instance, an increase in the private investment strengthens the private sector’ incentive in lobbying .Hence these newly-empowered corporate bodies are likely to exert more pressure on the government and demand institutional changes for their own well-being, see Altmann (2006).
IQit =γ0 +β1PIit +β2X2i +ε2it (B)
In these equations,PIit is the share of private investment in GDP andIQit represents the various indexes of governance (QA, PA and PS).X1i And X2i are the other control variables in private investment (PI) and governance (IQ) equations respectively.ε1it and ε2it are the error
terms of each equation. i signifies the country and t represents the time of the variable.
The private investment equation in our model includes real interest rate (Realr) to capture the user cost of capital and the GDP growth rate in last year (Growth) to account for the accelerator effect11. These two variables are assumed to have no direct effect on the level of the perceived quality of governance so are not included in the governance equations. The following variables appear in both of the equations. GDP per capita variable enters in the private investment with an expected negative sign. This variable in the governance equation is expected to exert a positive influence on the governance indicators12.Our Structural reforms (SR) index is composed by aggregating trade policy and financial development indicator by using the principal component analysis. Financial development is calculated by the private credit by banks and other depository institutions. Trade policy indicator is formed by subtracting the exports of oil and mining products and the “natural trade openness” (Constructed by Sachs and Warner 1997) from the commercial openness (Calculated by aggregating the export and import in total GDP ). Structural reform is expected to enhance the level of private investment and the perceived quality of the governance institutions. Human Capital (HC) index is formed by aggregating life expectancy at birth and average years of primary, secondary and higher schooling variables. The ratio of government consumption to GDP (GCons) is used to account for the level of government consumption and this variable is included in both of the equations. The effect of this variable on private investment is not certain ex-ante, but it is expected to exert a positive influence on the governance equations. Oil export as a percentage of total merchandise export (Oil Export) is also included as explanatory variables in both equations. The validity of the natural curse hypothesis is tested by incorporating this variable in the investment equation13 and the sign of this variable in the private investment equation is expected to be negative. The share of oil exports has also implications for the quality of governance institutions in the economy14 so, oil export as a percentage of total merchandise export is expected to have a negative coefficient in the governance equations.
The tenure of the system (Tensys) from Keefer et al. (2001) is excluded from the investment equation to identify the system and is expected to have a positive influence on the governance institutions15. Finally, a regional dummy for the Middle Eastern and North African countries (MENA dummy) appears as a right hand side variable in both of the equations.
11
GDP growth rate enters the equation with an expected positive sign whereas the effect of the real interest rate is expected to be negative.
12 According to more Azariadis and Lahiri (2002) developed countries can afford to have better institutions. 13 When a country relies more on natural resources extraction in its export, there can be less incentives to invest for other products, Rodriguez and Sachs (1999).
14
Countries which are less dependent on natural resources are expected to form better governance institutions , see Ross (2001).
2.2. Estimation Results
Equations “(A)” and “(B)” have been estimated on an unbalanced panel of 32 developing countries over 1970-2002. Three sets of regressions have been calculated, each one utilizing a different governance indicator to account for the perceived quality of the government
institutions. Tables IV present the results.
From table IV column 1-where Administration Quality (QA) is used as a measure of governance- we can conclude that the QA has a positive and significant coefficient at the 5 % level in the investment equation. In this specification especially the structural reforms have an important impact on private investment. The accelerator variable has the expected positive sign and it is significant. Although not significant, interest rate appears to exert a negative effect on the private investment, which is consistent with the user cost of capital theory. The coefficient of the GDP per capita and human capital variables are not significant. Government consumption variable has a significantly negative coefficient in equation 1 (Table IV column 1). This finding indicates that, for the countries that are included in our sample the crowding out effect of government spending outweighs the crowding in effect. The coefficient of the oil export variable as a percentage of total merchandise export is significant and negative in equation 1. Similarly, the regional dummy for MENA countries has a negative coefficient. MENA countries seem to be diverging from the rest of the world in terms of private investment. However, this dummy variable is not significant. This result is most likely stem from the inclusion of the oil exports variable in the regressions. On the “Administrative Quality” equation (Table IV, column 2), our results uncover the positive influence of several factors on the perceived quality of the administration. For example GDP per capita-although small- has a significantly positive coefficient which implies that countries with superior resources are able to develop better institutions. Besides, private investment helps improving the administrative quality considerably. This last result validates the usage of the 3SLSQ estimation technique. Tenure of system is also an important determinant for the administrative quality. Government spending has a significantly positive coefficient for the administration quality. Our estimations fail to confirm the negative impact of the share of oil export in merchandise export. Structural reforms and human capital are not significant in explaining administrative quality in equation (2). However, when estimating the system by excluding private investment from equation (B), the coefficient of the structural reforms and human capital becomes positive and highly significant (see Table IV column 4). This result seems to be due to the fact that the structural reforms index is correlated with private investment. Hence, the positive impact of private investment on administrative quality seems mainly due to the structural reforms which stimulate firms’ decisions to invest. This result also shows that the impact of human capital on private investment is indirect.
Political Stability (see columns 5&6 of Table IV) seems to have a significant and positive impact on the investment decisions, but for this governance indicator the level of significance is 10%. Once again structural reforms are confirmed to be crucial for private investment, but this time their effect is indirect. They enhance the level of investment by improving the political stability of a country (see Table IV columns 5&6). In this specification, both of the variables that are related to the neo-classical investment model- growth and interest rate- are highly significant with the expected signs. The influence of human capital on the political stability is highly significant. Hence we can say that the human capital variable is exerting its influence on private investment through its influence on political stability. Similar to the Administrative Quality
case, we are again able to verify the natural curse hypothesis. But the effect of private investment is not significant on political stability. The regional MENA dummy in the political stability equation (Table IV column 6) is significant with a positive sign. This result establishes a strong conclusion about the level of the quality of the governance in the MENA region as measured by the political stability indicator. Controlling for the other determinants of the political stability, being a MENA country increases the level of stability. Unlike the administrative quality case, government consumption does not have a robust effect on political stability (Table IV, column 6). Also the positive impact of GDP and Tenure system on political stability are validated in this specification.
Table IV (columns 7&8) reports the regression results when “Political Accountability” measures the perceived quality of institutions. We show that the coefficient of Political Accountability in the private investment equation (See table IV equation 7) is significant at the 10% level. This can be viewed as an important contribution to the literature on economic activity and democracy. This set of estimations also confirms that structural reforms encourage private investment decisions. This time, the link appears to be only direct, the coefficient of the structural reforms indicator in the political accountability equation appears insignificant (Table IV, columns 7&8). Like the political stability case human capital has a significant influence on the political accountability but not on private investment. Unlike the previous indicators the MENA dummy variable has different coefficients in both of the equations. In equation (7), the coefficient of the MENA dummy is positive, although not significant. On the political accountability equation (Table IV, columns 8) the coefficient of this variable is now significant and negative. This last finding strengthens our claims about the low level of democratic quality in the MENA region introduced in the first section. Once again both of the variables that are related to the neo-classical investment model are highly significant with the expected signs. Like the previous cases crowding out effect of the government sector spending on private investment and the positive influence of government consumption on the quality of institutions is established in this specification too (Table IV, columns 7&8). Finally like the previous two indicators, this one also verifies the natural curse hypothesis along with the positive influence of the level of GDP on governance.
3. Perceived Quality of Governance and Private Investment Performance of MENA
In this section, we use the models estimated previously to uncover the contribution of each type of governance institution to the improvement of private investment performance in the MENA region. For this purpose, we compare private investment performance of the MENA region in these respects to the one of the more advanced developing economies of our sample, the East Asian economies and simulate which level of private investment MENA could have achieved if the region had the same perceived governance institutions as East Asia. This is done for two time periods; the 1980s and the 1990s respectively. In our simulations we use the equations obtained for private investment in the three different specifications. (See Table IV, columns 1, 5 and 7). The contribution of the Quality of Administration index has been calculated by aggregating the contributions of its four sub-components and the same thing has been done for the other governance indicators.16
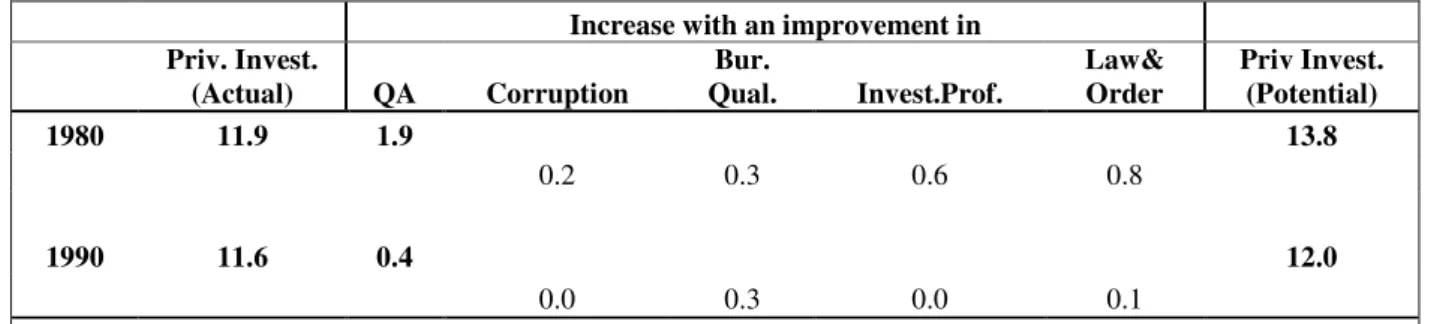
From Table V (top section) it can be seen that, if MENA had the same perceived quality of administration as the East Asia in the 1980s it’s average-private investment to GDP ratio would have reached 13.8 (compared to 11.9 per cent observed).When the contributions of the various components of administration quality to this result are examined, it becomes clear that deficiencies in the investment profile and law &order were the primary reasons for the gap between the actual and potential level of private investment (these two components are responsible for the loss of 0.6 and 0.8 points of private investment to GDP respectively). These results imply that, in the 1980s the countries in the MENA region had difficulties in ensuring an equitable and consistent rule of law in protecting the security rights, as well as providing an investment environment that is free from risks to operations and excessive regulations. Table VI shows that in the 1980s, private investment in the MENA region had the potential to reach on average 15.9 per cent of GDP if the gap with the East Asian institutions in terms of political stability was diminished. External and internal stability components were nearly the sole contributors to this result which have reduced private investment decisions by respectively 1.6 and 2.7 per cent of GDP on average per year If MENA had benefited from the same quality political accountability private investment would have been 15.9 percent of GDP in the 1980s (See table VII). The lack of civil liberties and political rights has both been important factors in keeping the region from reaching its potential level of investment.
In the 1990s, the gap with East Asia has been noticeably reduced in terms of “Administrative Quality” and “Political Stability”. The deficit in private investment caused by insufficient quality of administration was 0.4 points of GDP on average per year in the 1990s (see Table V bottom section). The gap with East Asia has nearly fully diminished in terms of corruption, investment profile and law&order. On the other hand just like the 1980s lack of bureaucratic quality is still responsible for the loss the private investment equaling to 0.3 points of GDP on average. In the 1990s, MENA had a superior performance –in terms of the overall political stability indicator- than the East Asia in terms of political stability (see Table VI). Government stability and ethnic tension sub-components are better for the MENA region, whereas- although improved significantly compared to the 1980- external conflict still accounts for the loss of 0.3 points of private investment to GDP. In terms of Political Accountability, the gap between the two regions nearly did not decrease at all. The low level of political accountability is responsible for the deficit in private investment equaling to 3.9 points of GDP (See Table VII).
4. Conclusion
In this paper we empirically show that the perceived quality of governance is an important determinant of the private investment decisions in the developing countries by stressing the existence of different types of possible measures of governance. Different types of governance; namely “Quality of Administration” (QA), “Political Accountability” (PA) and “Political Stability” (PS) are confirmed to exert their influence on the private investment through diverse mechanisms. All of the three indicators were proved to be significantly –although at different levels of significance and magnitudes of influence-important for private investment decisions. The weakness of MENA institutions during the 1980s was an important reason for the observed low level of investment in this region. In the 1990s the gap between the two regions mostly diminished in terms of the quality of the administration and political stability. On the other hand the gap between the MENA and East Asia regions did not decrease at all in terms of the political accountability. The low level of perceived PA was still responsible for the deficit in
private investment equaling to 3.9 points of GDP. These results support the argument that governance may exert different levels of influence on private investment when measured by different indicators.
References
Acemoglu, Daron, Simon Johnson, and James A. Robinson (2001) “The Colonial Origins of Comparative Development: An Empirical Investigation” American Economic Review 91(5), 1369–401.
Acemoglu, Daron, and Yunyong Taicharoen ( 2003) “Institutional Causes, Macroeconomic Symptoms, Volatility, Crises and Growth” Journal of Monetary Economics, 89 (September), 49-123.
Altmann, Franz-Lothar (2006) “Promoting Democracy-Building and Security through Private Investments” Stiftung für Wissenschaft und Politik Berlin. Available online at (December 2006): www.bmlv.gv.at/pdf_pool/publikationen/wg7-altmann.pdf
Aysan, Ahmet Faruk, Mustapha Kamel Nabli and Marie-Ange Véganzonès–Varoudakis (2007) “Governance Institutions and Private Investment: An application to the Middle East and North Africa.” The Developing Economies, Vol. 45, N.3, pp 339-377.
Aysan, Ahmet Faruk, Gaobo Pang and Marie-Ange Véganzonès–Varoudakis (2007) “Uncertainty, Economic Reforms and Private Investment in the Middle East and North Africa” Applied Economics (fortcoming)
Azariadis, Costas and Amartya Lahiri (2002) "Do Rich Countries Choose Better Governments?" Contributions to Macroeconomics 2(1), Article 4.
Berg, Andrew and Ann Krueger (2003) “Trade, Growth, and Poverty – A Selective Survey.” IMF Working Paper 03/30, Washington, D.C.
Binter, W.H. (1977) “Crowding-Out and the Effectiveness of Fiscal Policy.” Journal of Public Economics, N.7.
Bisat, Amer, Mohamed A. El-Erian, Mahmoud El-Gamal and Francesco P. Mongelli (1996) “Investment and Growth in the Middle East and North Africa.” IMF Working Paper WP/96/124. Frankel, Jeffrey (2002) “Promoting Better National Institutions: The Role of the IMF.” presented at the Thirds Annual IMF Research Conference, Washington, November 7-8.
Fraser Institute, Economic Freedom in the World, Vancouver, Canada.
Freedom House (2002a) Freedom in the World 2001–2002. Available online at (Accessed 2003) http://www.freedomhouse.org.
Freedom House (2002b), Press Freedom Survey 2003. Available online at (Accessed 2003) http://www.freedomhouse.org.
Friedman, Milton (1976) “The Line We Dare Not Cross: The Fragility of Freedom at 60 Percent.” Encounter.
Galor, Oded, Omer Moav and Dietrich Vollrath (2005) “Land Inequality and the Emergence of Human Capital Promoting Institutions.” Development and Comp Systems, 0502018, Economic Working Paper Archive at WUSTL.
Heritage Foundation/The Wall Street Journal. (2002 and 2003) Index of Economic Freedom. (Accessed 2003) Available online at http://www.heritage.org/research/ features/index. International Monetary Fund (1996) “World Economic Outlook, Growth, and Institutions.” World Economic and Financial Surveys. Washington, D.C.
Jorgenson, Dale W. (1963) “Capital Theory and Investment Behavior.” American Economic Review 53(2), 247-259.
Keefer, Philip, Thorsten Beck, George Clarke, Alberto Groff, and Patrick Walsh (2001) "New Tools in Comparative Political Economy: The Database of Political Institutions." World Bank Economic Review 15(1), 165-176.
Knack, Stephen, and Philip Keefer (1995) “Institutions and Economic Performance: Cross Country Tests Using Alternative Institutional Measures.” Economics and Politics 7(3), 207–27. Mankiw, Gregory, David Romer and David Weil (1992) “A Contribution to the Empirics of Economic Growth.” Quarterly Journal of Economics 106, 407-37.
Nabli, Mustapha and Marie-Ange Véganzonès-Varoudakis (2007) “Reforms Complementarities and Economic Growth in the Middle East and North Africa”, Journal of Intermational Development, Vol. 19, pp 17-54
Nagaraj, Ratapolu, Aristomène Varoudakis, and Marie-Ange Véganzonès (2000) “Long-Run Growth Trends and Convergence across Indian States: The Role of Infrastructures.” Journal of International Development 12 (1), 45-70.
North, Douglas C. (1981) “Structure and Change in Economic History” New York: W. W. Norton.
Political Risk Services (2001) International Country Risk Guide, New York: PRS Group. Available online at (Accessed 2004) http://www.prsgroup.com.
Rodriguez, Francisco and Jeffrey D. Sachs (1999) “Why Do Resource Abundant Economies Grow More Slowly?” Journal of Economic Growth 4(3), 277-303.
Rodrik, Dani (1991), “Policy Uncertainty and Private Investment in Developing Countries”, Journal of Development Economics, 36(2): 229-42.
Rodrik, Dani (1999) “Institutions for High-Quality Growth: What They Are and How to Acquire Them.” paper presented at the IMF Conference on Second Generation Reforms, Washington, November 8-9.
Ross, Michael (1999) “The Political Economy of the Resource Curse.” World Politics 51, 297– 322.
Ross, Michael (2001), “Does Oil Hinder Democracy?” World Politics 53: 325–61.
Sachs, Jeffrey and Andrew Warner (1997), “Natural Resource Abundance and Economic Growth”, Center for International Development. Harvard University, Cambridge, Mass. Available online at (Accessed 2003) http://www.cid.harvard.edu// ciddata/ciddata.html.
Shafik, Nemat (1992) “Modeling Private Investment in Egypt.” Journal of Development Economics 39 (October): 263-277
World Bank (2004) Better Governance for Development in the Middle East and North Africa: Enhancing Inclusiveness and Accountability, MENA Development Report. The World Bank, Washington, D.C.
Annex 1
Table I: Governance Indicators (average 1970-2002)
Table II: Disaggregated Governance Variables (average 1970-2002)
Table III: List of Countries with High Quality Data (60 countries)
Argentina, Bangladesh*, Barbados*, Belize, Benin*, Bolivia*, Brazil*, Bulgaria, Cambodia, Chile*, China*, Colombia*,Comoros, Costa Rica*, Cote d'Ivoire, Croatia, Dominican Rep., Ecuador*, Egypt Arab Rep.*, El Salvador, Estonia, Ethiopia, Guatemala*, Guinea-Bissau, Guyana, Haiti, Honduras*, India*, Indonesia*, Iran Islamic Rep., Kenya*, Lithuania, Malawi*, Malaysia*, Mauritius*, Mexico, Moldova, Morocco, Namibia, Pakistan*, Panama, Papua New Guinea*, Paraguay*, Peru*, Philippines*, Poland*, Romania, Serbia and Montenegro, Seychelles, South Africa*, St. LuciaSt., Vincent and the Grenadines , Thailand*, Trinidad & Tobago*, Tunisia*, Turkey*, Uruguay*, Uzbekistan, Venezuela*, Yugoslavia (FR)
Due to the lack of corresponding data for some countries, only counties marked with * are included in the final regressions Region Administrative Quality Political Stability Political Accountability AFR -0.38 -0.63 -0.55 EAP 0.59 0.29 -0.05 ECA 0.29 0.42 0.03 LAC -0.31 -0.09 1.16 MENA 0.14 0.07 -0.90 SAS -0.55 -0.88 0.46
Sources: International Country Risk Guide, Freedom House, and the Authors’ calculations. Region Corruption Bureaucracy Quality Investment Profile Law and Order Political Rights Civil Liberties Government Stability Internal Conflict External Conflict Ethnic Tensions AFR 2.81 1.49 5.42 2.71 -5.10 -4.97 6.07 6.96 8.44 2.99 EAP 3.22 2.37 6.29 3.89 -4.29 -4.49 7.07 9.28 9.99 3.33 ECA 3.43 1.71 5.69 4.04 -4.20 -4.39 6.94 9.68 10.06 3.92 LAC 2.71 1.44 5.73 2.81 -2.72 -3.02 6.13 7.61 9.75 4.34 MENA 2.98 1.95 5.89 3.39 -5.41 -5.51 7.62 8.30 8.34 4.34 SAS 1.98 1.81 5.38 2.33 -3.38 -4.08 5.73 6.60 8.27 2.29
Table IV: Estimation Results
Endogenous Variables Endogenous Variables Endogenous Variables Endogenous Variables Explanatory Priv inv QA Priv inv QA Priv inv PS Priv inv PA
Variables (1) (2) (3) (4) (5) (6) (7) (8) QA 2.07 2.16 (2.08)** (2.17)** PS 3.64 (1.72)* PA 4.74 (1.66)* GCons -0.27 0.07 -0.26 0.04 -0.20 -0.01 -0.44 0.05 (-3.35)*** (4.07)*** (-3.36)*** (3.81)*** (-2.52)** (-0.49) (-2.45)** (2.55)** Priv Inv 0.12 -.07 -0.05 (2.53)** (-1.59) (-0.87) SR 1.71 -0.0018 1.73 0.3 1.11 0.53 3.53 -0.13 (5.24)*** (-0.01) (5.28)*** (9.11)*** (1.51) (4.36)*** (4.66)*** (-0.98) HC 0.25 0.05 0.2 0.09 -0.42 0.25 -0.71 0.25 (1) (0.95) (0.79) (2.47)** (-0.76) (5.32)** (-1.00) (4.70)*** Oil Export -0.03 0.0025 -0.04 -0.0025 -0.05 -0.001 -0.06 0.001 (-2.96)*** (0.85) (-3.28)*** (-1.41) (-3.02)*** (-0.25) (-3.06)*** (0.33) GDP per capita 0.00009 0.0007 0.00018 0.0001 -0.00002 0.0002 -0.0008 0.0003 (0.38) (1.80)* (0.73) (3.12)*** (-0.06) (3.90)*** (-0.95) (5.64)*** MENA Dummy -0.97 0.13 -0.83 0.02 -2.19 .34 4.47 -1.15 (-0.99) (0.67) (-0.86) (0.15) (-1.64) (1.81)* (1.25) (-5.27)*** Rear -0.01 -0.03 -0.05 -0.04 (-1.53) (-3.18)*** (-2.47)** (-2.86)*** Growth 0.19 0.16 0.19 0.23 (2.77)*** (2.13)** (2.53)** (2.77)*** Ten Syst 0.01 0.02 0.013 0.01 (3.55)*** (6.21)*** (3.66)*** (2.29)*** Constant 15.5 -2.84 15.62 -1.03 16.96 -0.02 17.35 -0.25 (10.13)*** (-3.85)*** (10.16)*** (-6.65)*** (7.09)*** (-0.02) (6.80)*** (-0.30)
Num obs 349 in each equation
Notes: (*) indicates significance at 10 %; (**) indicates significance at 5 %; (***) indicates significance at 1 %.
Table V: Private Investment to GDP – Administrative Quality (QA) Case
Table VI: Private Investment to GDP – Political Stability Case (PS) Case
Table VII: Private Investment to GDP – Political Accountability (PA) Case
Increase with an improvement in
Priv. Invest. (Actual) QA Corruption Bur. Qual. Invest.Prof. Law& Order Priv Invest. (Potential) 1980 11.9 1.9 13.8 0.2 0.3 0.6 0.8 1990 11.6 0.4 12.0 0.0 0.3 0.0 0.1
Source: Authors’ calculations.
Increase with an improvement in
Priv. Invest.
(Actual) PS Gov. Stab.
Int.
Confl. Ext. Confl. Ethn. Tens.
Priv Invest. (Potential) 1980 11.9 4.0 15.9 0.1 1.6 2.7 -0.4 1990 11.6 -0.7 10,9 -0.6 0.1 0.3 -0.5
Source: Authors’ calculations.
Private Investment to GDP – Political Accountability (PA) Case
Increase with an improvement in
Priv. Invest.
(Actual) PA Pol. Rights Civ. Lib.
Priv Invest. (Potential) 1980 11.9 4.0 15.9 1.9 2.1 1990 11.6 4.0 15.6 1.9 2.1
Annex 2
Principal Component Analysis: To get the overall impact of the changes in each category of the governance indicators, we first calculated the contribution of each initial variable in the category to the overall improvement in the level of private investment. The calculation is based on the estimated coefficients of each type of governance indicator in the regression (Table IV, equations 1,5 and 7) as well as on the weights of each principal component in the aggregate indicator combined with the loading of the initial variables in each principal component .
Figure 1: The Administrative Quality Indicator
Component Eigenvalue Cumulative R2
P1 2.23 0.56 P2 0.83 0.76 P3 0.51 0.89 P4 0.43 1 Loadings P1 P2 P3 P4 Corruption 0.49 -0.57 0.06 0.65 Bureaucracy Quality 0.54 -0.08 0.64 -0.54 Investment profile 0.41 0.81 0.08 0.40
Law and Order 0.54 -0.02 -0.76 -0.36
QA = P1*(0.5577/0.7640) + P2*(0.2063/0.7640)
Figure 2: The Political Stability Indicator
Component Eigenvalue Cumulative R2
P1 2.96 0.42 P2 0.97 0.56 P3 0.90 0.69 P4 0.68 0.79 P5 0.62 0.88 P6 0.57 0.96 P7 0.30 1 Loadings P1 P2 P3 P4 Gov Stability) 0.32 -0.62 -0.38 0.05 Socioeco Conditions 0.29 0.63 -0.44 -0.14 Internal Conflicts 0.51 -0.06 -0.09 -0.07 External Conflicts 0.39 -0.29 0.26 -0.6 Ethnic Tensions 0.39 -0.06 0.02 0.77 Religious Tensions 0.31 0.19 0.76 0.1 Military in Politics 0.39 0.31 -0.12 -0.11
PS = P1* (0.4253/ 0.7878) + P2* (0.1373/0.7878) + P3* (0.1280/ 0.7878 + P4* (0.0972/ 0.7878)
Figure 3: The Political Accountability Indicator
Component Eigenvalue Cumulative R2
P1 1.88 0.94 P2 0.12 1 Loadings P1 P2 Political Rights 0.71 0.71 Civil Liberties 0.71 -0.71 PA = P1 Annex 3
Figure 4: Short term coefficients of the Disaggregated Indicators
Short and Long Term Coefficients/Elasticities
Short Term Coefficients Standardized Level Index Variables Variables Variables Corruption 0,43 0,40 bureaucraty quality 0,78 0,75 QA investment profile* 1,08 0,51
law and order 0,80 0,62
Government Stability 1,81 0,75 PS Internal Conflict 1,56 0,60 External Conflict 1,49 0,67 Ethnic Tensions 0,67 0,46 Political rights 3,37 1,70 Civil liberties 3,37 2,10 PA