HAL Id: hal-02151287
https://hal.archives-ouvertes.fr/hal-02151287
Submitted on 7 Jun 2019HAL is a multi-disciplinary open access
archive for the deposit and dissemination of sci-entific research documents, whether they are pub-lished or not. The documents may come from teaching and research institutions in France or abroad, or from public or private research centers.
L’archive ouverte pluridisciplinaire HAL, est destinée au dépôt et à la diffusion de documents scientifiques de niveau recherche, publiés ou non, émanant des établissements d’enseignement et de recherche français ou étrangers, des laboratoires publics ou privés.
Quantifying the Strength of a Salt Bridge by Neutron
Scattering and Molecular Dynamics
Philip Mason, Pavel Jungwirth, Elise Duboue-Dijon
To cite this version:
Philip Mason, Pavel Jungwirth, Elise Duboue-Dijon. Quantifying the Strength of a Salt Bridge by Neutron Scattering and Molecular Dynamics. Journal of Physical Chemistry Letters, American Chem-ical Society, 2019, pp.3254-3259. �10.1021/acs.jpclett.9b01309�. �hal-02151287�
Quantifying the Strength of a Salt Bridge by
Neutron Scattering and Molecular Dynamics
Philip E. Mason,
∗,†Pavel Jungwirth,
∗,†and Elise Duboué-Dijon
∗,†,‡†Institute of Organic Chemistry and Biochemistry, Czech Academy of Sciences, Flemingovo nam. 2, 16610 Prague 6, Czech Republic
‡Laboratoire de Biochimie Théorique, CNRS, UPR9080, Univ Paris Diderot, Sorbonne Paris Cité, PSL Research University, 13 rue Pierre et Marie Curie, 75005, Paris, France
Abstract
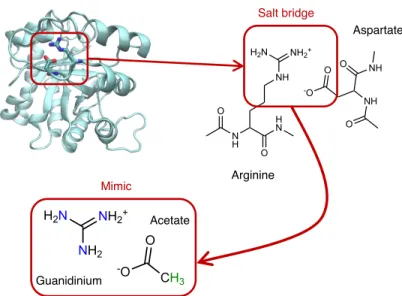
The molecular structure and strength of a model salt bridge between a guanidinium cation— side chain group of arginine—and the acetate carboxylic group in an aqueous solution is char-acterized by a combination of neutron diffraction with isotopic substitution and molecular dynamics simulations. The present neutron scattering experiments provide direct informa-tion about ion pairing in the soluinforma-tion. At the same time, these measurements are used to assess the quality of the force field employed in the simulation. We show that a standard non-polarizable force field overestimates the strength of salt bridges. In contrast, accounting for electronic polarization effects via charge scaling allows to quantitatively reproduce the experiment. Such simulations are used to quantify the weak character of a fully hydrated salt bridge. Finally, on top of the canonical hydrogen-bonding binding mode, we uncover another interaction motif involving an out-of-plane hydrophobic contact of the acetate methyl group with the guanidinium cation.
TOC Graphic
0 2 4 6 Q (Å-1) -0.01 0 0.01 DD S(Q) NH2 NH2+ H2N O -O Guanidinium Acetate Mimic Salt bridge NDIS MDSalt bridges, i.e., electrostatic interactions between oppositely charged amino acid side chains, are among the key factors considered to be responsible for protein structure stability. However, there has been an ongoing discussion in the literature about the strength of the salt bridges that form between arginines, lysines, or N-termini of proteins on one side and gluta-mates, aspartates, or C-termini on the other side.1,2 While early studies suggested that salt
bridges may be among the main driving forces behind protein folding,3 later investigations rather pointed to their minor effects on folding and overall protein stability.4–7 Nevertheless, salt bridges can still contribute significantly to fine tuning of specific protein structures.8,9 They have also been suggested to be important for life at high temperatures,10 as well as
for conformational specificity and positioning of critical functioning groups.11,12 Even if their
contribution to overall protein stabilization is small, salt bridges may still in many cases play a critical role being essential for specific biological functions of proteins.13–15
The principle question is how do we reliably and accurately assess the strength of a particular salt bridge teasing it out from the plethora of interactions that keep a protein in shape. On the experimental side, NMR measurements combined with pH titration or single point mutations come closest to answering the question, but fall short of providing the stabilization free energies of salt bridges.16–19 While structural studies,12,20,21
potentio-metric titration,4,22 fluorescence measurements,23 and calorimetric experiments24,25 provide
additional useful data, they cannot directly answer the question posed in the beginning of the paragraph either. Here, we conduct technically challenging Neutron Diffraction with Isotopic Substitution (NDIS) experiments that allow us for the first time to quantify directly the ion pairing between guanidinium and acetate ions in an aqueous solution as a proxy for arginine-based salt bridges (Fig. 1). Simultaneously, we employ molecular dynamics simulations with a newly developed scaled charge force field—that accounts for electronic polarization in a mean field way—to fully characterize the molecular details of the interaction patterns relevant for ion pairing between these two molecular ions.
tech-NH2 NH2+ H2N O -O CH3 H N N H O O NH NH2+ H2N O -O NH O O NH Arginine Aspartate Guanidinium Acetate Salt bridge Mimic
Figure 1: Chemical structure of the arginine–aspartate salt bridge, together with the guanidinium–acetate proxy ion pair. The guanidinium nitrogen atoms and acetate hydro-gen atoms substituted in the neutron scattering experiment are colored in blue and green, respectively.
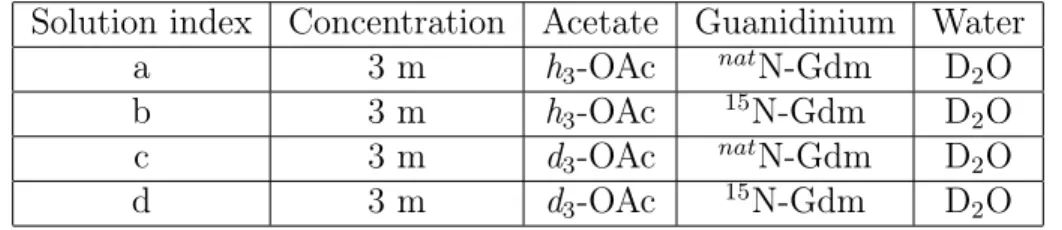
nically challenging NDIS experiments26,27 that use four chemically identical 3 m guanidinium acetate (GdmOac) aqueous solutions with varying isotopic compositions. A different com-bination of isotopes is used for guanidinium nitrogen atoms (natN or 15N, colored in blue
in Fig. 1) and for the acetate hydrogen atoms (H or D, colored in green) in the four solu-tions (see Methods and Table 1). This yielded the four neutron scattering patterns provided in Figure 2A. While their general shapes are very similar, the small differences between them are directly due to varying isotopic compositions, that assign a different weight to particular correlations in the solution. Subtracting pairs of solutions that differ only by the isotopes of the guanidinium nitrogen atoms yields the first order differences ∆SNh
3-OAc(Q) and
∆SNd
3-OAc(Q) (Fig. 2B), which reflect the structural correlations between the guanidinium N
atom and any other atom in the solution (see Supporting Information).
Taking the difference between these two first order patterns eventually yields the second order difference ∆∆SN
OAc(Q) (Fig. 2C). The second order difference reflects the single
0 1 2 3 4 5 6 7 8 r (Å) -0.002 -0.001 0 0.001 DD G(r) 0 2 4 6 8 10 12 14 16 Q (Å-1) -0.02 -0.015 -0.01 -0.005 0 DD S(Q) 0 2 4 6 8 10 12 14 16 Q (Å-1) 0 0.25 0.5 0.75 1 1.25 S(Q) a b c d A a - b c - d 0 2 4 6 8 10 12 14 16 Q (Å-1) 0 0.01 0.02 0.03 0.04 DS(Q) B e f f - e Fourier-transform C D
Figure 2: A) Raw total structure factor for four isotopically different 3 m guanidinium acetate solutions: (a) GdmOAc(h3, natN), (b) GdmOAc(h3, 15N), (c) GdmOAc(d3, natN), and (d)
GdmOAc(d3, 15N). B) First order differences (e) ∆SNh3-OAc(Q) and (f) ∆S N
d3-OAc(Q). C)
Second order difference ∆∆SN
OAc(Q). D) Second order difference in direct space ∆∆GNOAc(r),
obtained by back-Fourier transform of the Q-space second-order difference. All neutron signals are in units of barns str−1 atom−1.
acetate non-exchangeable H atoms:
∆∆SOAcN = ∆SdN3-OAc(Q) − ∆ShN3-OAc(Q) = 1.04SNHsubs(Q) . (1)
∆∆SOAcN is thus a direct measure of the ion pairing propensity between acetate and guanidinium ions, which serve as a proxy for the salt bridges formed between glutamate or aspartate and arginine side chains in proteins. Such simple model molecules were chosen not only because of the availability of the isotopically substituted compounds, but also because their simple structure and the symmetry of the guanidinium ion were expected to give rise to a signal simple enough to allow its comprehensive interpretation. In reciprocal space, the second order difference is mainly featureless beyond 4 Å−1 but exhibits a broad peak around 2 Å−1 and a characteristic sharp fall below this value. Measuring this structural correlation was a technically challenging experiment, because the expected contrast for the double dif-ference was only ∼ 1 mbarns, i.e. ∼ 0.3 % of the total scattering signal. Comparison of two independent sets of data confirmed the reliability of our procedure (see Supporting Informa-tion). The success of our experiment was possible only thanks to a very careful preparation of the samples and to the very high signal to noise performance of the 7C2 instrument at the Orphee reactor (Saclay, France).28
The corresponding signal in direct space (r-space) is obtained by Fourier transform of the Q-space signal, after applying a window function to limit ringing artifacts (Fig. 2D). It exhibits a very broad split first peak between 3 and 4 Å, a second peak just above 5 Å, and a third very shallow hump at 7 Å. This signal represents the first direct characterization of the real-space correlation between the two ions. However, further interpretation of the data and peak assignment is only possible with the help of molecular modeling.
Hence, we used force field molecular dynamics to simulate a guanidinium chloride solu-tion at the same concentrasolu-tion as the experiment, i.e., 3 m, and calculated the corresponding second order difference signal in Q-space, ∆∆SOAcN (Q). The simulated signal can be directly
compared to the experimental second order difference without any assumptions (Fig. 3). However, results from molecular simulations can be only as good as is the underlying inter-action potential and, indeed, recent comparative studies show that existing force fields tend in general to overestimate the strength of salt bridges.29,30 Attempts to track the origin of
this artifact point primarily to the neglect of electronic polarization effects in standard (non-polarizable) MD simulations, which typically leads to excessive pairing of oppositely charged ions or charged groups in aqueous solutions.31,32 By comparison to structures obtained from neutron diffraction these studies have also shown that a simple, accurate, and physically well justified way for accounting for electronic polarization lies in scaling of charges of aqueous ions or charged groups by the inverse square root of the high frequency dielectric constant of water, i.e., by a factor of approximately 0.75.32–34 Hence, simulations were performed with
two different force fields—we compared a standard non-polarizable force field ("full charges") with its scaled-charge, ECC, variant (see Methods).
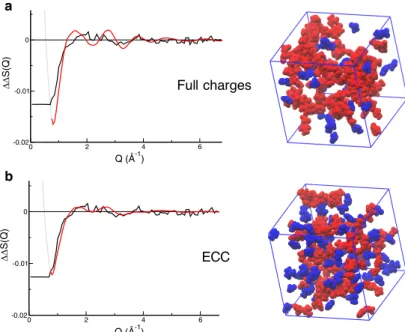
The depletion at low-Q and the presence of a broad peak around 2 Å−1 in the second order difference signal (Fig. 3) is captured by both simulations, but the amplitude of the depletion at 1 Å−1 is much better described by the scaled charge simulations. In addition, the full charge force field clearly leads to too sharp peaks around 2 Å−1 compared to the experimental data. This reflects stronger ion-pairing in the solution when using full charge force fields (Fig. 3). While the experimental signal only shows a very broad peak around 2 Å−1, the computed double difference with the ECC force field exhibits a double peak structure around 2 Å−1, with a first peak at 1.7 Å−1 and a second at 2.7 Å−1. However, given the experimental noise level and the weak intensity of the peaks, the signal computed with the ECC force field is compatible with the experiment within noise level. Hence, the scaled charge (ECC) simulation is used for all further analyses.
We can now use our simulations to obtain a more detailed picture of the structure of the solution at the molecular level. The acetate is found to interact with guanidium primarily in two different modes (Fig. 4a). The first mode of interaction is a formation of two hydrogen
0 2 4 6 Q (Å-1) -0.02 -0.01 0 DD S(Q) 0 2 4 6 Q (Å-1) -0.02 -0.01 0 DD S(Q) Full charges ECC a b
Figure 3: Comparison between the experimental second order difference in Q-space ∆∆SN
OAc(Q) (black) and that calculated (red) from a simulation performed with either a) full
charges or b) ECC (scaled charges) force fields. A snapshot of each simulation (right hand side) is provided to illustrate the difference in pairing. All the ions involved in a H-bonded ion pair (NGdm-OAc distance lower than 3.5 Å) are colored in red, the others in blue. All the
simulation snapshots in this paper have been prepared using VMD.35
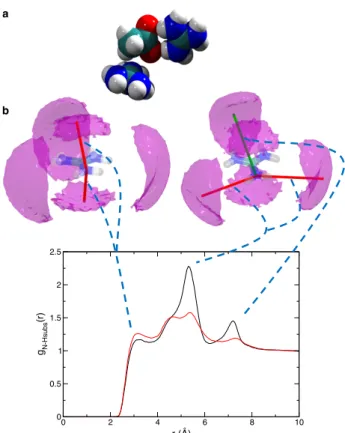
bonds with the guanidinium moiety, as expected for salt bridges in proteins. The second mode of interaction is via the acetate hydrophobic methyl group, which can lie on top of the guanidinium central carbon. These two modes are apparent in the density maps of hydrogen or oxygen acetate atoms around guanidinium (Supporting Information and Fig. 4). The density clouds in the guanidinium plane (Fig. 4b) clearly show the direct hydrogen-bonding interaction between the two moieties, while the out-of-plane density clouds correspond to the second interaction mode, with the acetate methyl group on top of the guanidinium plane.
This structural analysis allows us to identify the molecular origin of the peaks present in the simulated double difference signal ∆∆GN
OAc(r) (Fig. 4b). The first small peak around
3.2 Å clearly originates from the second interaction mode, where acetate CH3 groups are
positioned directly on top of the guanidinium plane. In contrast, the two peaks around 5.4 and 7.2 Å can be assigned to the direct hydrogen bond interaction between the guanidinium
0 2 4 6 8 10 r (Å) 0 0.5 1 1.5 2 2.5 gN-Hsubs (r) a b
Figure 4: a) Snapshot from the molecular dynamics simulation illustrating the two possible interaction modes of acetate with guanidinium. b) Pair correlation functions in real space gN-Hsubs(Q) calculated from a simulation performed with either full charges (black) or scaled
charges (ECC, red) force fields. The correlation responsible for each peak is identified on the HAc density maps around guanidinium, plotted for a low (2.2 times bulk density) density
cutoff value.
NH groups and the acetate oxygen atoms. The origin of the peak or shoulder around 4.6 Å is more elusive and seems to originate from the second interaction mode. While the first peak corresponds to the NH correlation with the closest H from the CH3 group, this second one
would reflect the position of the other hydrogen atoms, further away from the guanidinium plane (see Supporting Information for details).
It is interesting to note that while the peaks related to the direct H-bond interaction are found at the exact same position in the simulation (Fig. 4) and in the Fourier transform of the experimental data (Fig. 2D), both peaks related to the second interaction mode are somewhat shifted. The first peak is shifted to slightly lower distances in the simulations
compared to the experimental data, while the second peak is found at a significantly shorter distance in the experimental signal. This suggests that, while the qualitative picture from the MD simulations of two interaction types is correct, the details of the hydrophobic out-of-plane interaction are probably not fully captured by our simulation setup. This is not unexpected, as no terms in the employed force field specifically describes the interaction with aromatic groups.
Both our NDIS measurements and MD simulations show that the salt bridge between fully hydrated guanidinium and carboxylate charged moieties is weak, thus lending support to previous interpretations of measurements of protein and model systems.4,17,22,24 We note
in this context that while NMR studies probing salt bridges involving lysines in biological systems exist,17no such investigation of salt bridges involving arginines has been done so far.
Nevertheless, the binding free energy of the guanidinium – acetate ion pair from the present simulations can be related to earlier potentiometric measurements,22that monitor ion pairing
via the induced pKa shift, which is a significantly less direct measure of the interaction than that presented here. Still, our association constant KA = 0.53 computed with the ECC
force field from the fraction of acetates involved in ion pairing with guanidinium ions (see Supporting Information) is in good agreement with the experimentally estimated value of KA = 0.37,22 both pointing to a weak association between the two molecular ions. In
contrast, the association is strongly overestimated by a standard full charge non polarizable force field, as also found from the comparison with neutron scattering data.
The present study is the first direct measurement of the molecular structure of a model salt bridge between a guanidinium cation and the carboxylic moiety of an acetate anion. Combined with molecular simulations, it highlights the two interaction modes between ac-etate and guanidinium. While the first one—the electrostatic hydrogen-bonding salt bridge interaction—is the canonical one, the additional hydrophobic interaction of the acetate CH3
group above and below the guanidinium plane is rather unexpected. Nevertheless, a similar interaction taking place out of the guanidinium plane with hydrophobic side chains (e.g., of
leucine) had been evidenced from a Protein Data Bank (PDB) search previously.21 Addi-tionally, based on our own analysis of a subset of 2265 relevant protein structures from the PDB (see Supporting Information), we find that 25–55 % of the structures (depending on the employed distance criterion) present at least one out-of-the-plane contact between the hydrophobic part of an aspartate or glutamate residue side chain and the guanidinium side chain of an arginine residue. This shows that our findings can be generalized beyond our very simple model of salt bridge and stresses the biological relevance of this newly highlighted interaction, even if it is less common than the canonical hydrogen-bonding salt bridge.
Methods
Experimental details We prepared four chemically identical solutions of guanidinium acetate with different isotopic compositions and very accurate concentrations. The below method was designed specifically to obtain this high level of accuracy. First, a 50:50 wt% solution was prepared from 100 g KOH (85 % Sigma Aldrich) and 100 g of 18 MΩ water (Millipore). 30 g of Dowex 1x8 50-100 mesh ion exchange resin were added to 100 g of this solution. The resulting solution was stirred before being loaded as an ion exchange column. The column was then washed with an additional 100 g of the KOH solution, before being repeatedly washed with 18 MΩ water until the eluted water exhibited a pH lower than 9. 1.5 g of natural guanidinium chloride (Sigma >=99% for molecular biology) was dissolved in 5 mL of water and gently eluted onto the column, followed by three 5 mL washings by H2O.
The column was then run in 20 mL fractions with monitoring of the pH. All the fractions with a pH higher than 10 were collected and combined (about 135 mL). This solution was split into two identical fractions of exactly 60.000 g. Each of these fractions was gravimetrically titrated until pH = 6.3 using either hydrogenated HOAc(h3) or deuterated DOAc(d3) acetic acid. The water was then removed via evaporation in a custom made closed circuit where the air was circulated first over the sample, then over a condenser. This method is preferable
to vacuum methods as it reduces the risk of the sample spluttering. Once almost all the water was removed, D2O (6 g) was added, and removed via the closed circuit apparatus.
This procedure was repeated 3 times to ensure that all the exchangeable hydrogens on the guadininium ion were exchanged for deuterons. D2O was then added to each solution to
reach the desired concentration. This procedure was then repeated with 15N guanidinium
chloride (Sigma-Aldrich, 98 atom%) to prepare 15N guanidinium acetate solutions. The isotopic composition of the four solutions is summarized in Table 1.
Table 1: Isotopic composition of the four guadinium acetate solutions. Solution index Concentration Acetate Guanidinium Water
a 3 m h3-OAc natN-Gdm D2O
b 3 m h3-OAc 15N-Gdm D2O
c 3 m d3-OAc natN-Gdm D2O
d 3 m d3-OAc 15N-Gdm D2O
The total neutron scattering patterns were then recorded for each of these four samples on the 7C2 instrument28 at the Orphee nuclear reactor of the Laboratoire Léon Brillouin in
Saclay, France. They were corrected for multiple scattering and absorption effects36 prior
to being normalized versus a previously characterized scattering sample of known geometry (a ∼6 mm vanadium cylinder). This produced the total structure factors (S(Q)) for each solution (Figure 2A). The first order difference was then taken between pairs of solution with the same acetate isotope but different guanidinium isotopes, 15N-Gdm and 14N-Gdm. The structure factors corresponding to these first order differences, ∆SNh3-OAc(Q) and ∆SNd3-OAc(Q), can be expressed as a sum of pairwise structure factors (see Supporting Information), and differ only in the prefactor associated with the correlation between the non-exchangeable hydrogen atoms on the acetate (Hsubs) and the guanidinium nitrogen atoms (N). Hence, the
structure factor for the second order difference ∆∆SN
OAc, obtained by the direct subtraction of
the two first order differences, only depends on the correlation between the non-exchangeable hydrogen atoms on the acetate (Hsubs) and the guanidinium nitrogen atoms (N). It is thus a
∆∆SOAcN = ∆SdN
3-OAc(Q) − ∆S N
h3-OAc(Q) = 1.04SNHsubs(Q) . (2)
Computational details We performed force field molecular dynamics simulations of a 3 m guanidinium acetate aqueous solution using the Gromacs 5.1.1 software.37 The simulation
box was composed of 100 guanidinium cations, 100 acetate anions, and 1852 water molecules. The SPC/E38 force field was used to describe water molecules, and two different force fields
were compared for the ions. First, we used a previously developed full charge force field34for acetate based on the Amber ff99 force field.39 Consistently, we designed an AMBER-based force field for the guanidinium cations, using the same charges as in the AMBER ff99 for the NH2 moieties, and adjusting the charge of the central carbon atom so that the guanidinium
total charge is +1. We then used a scaled charge force field–using the electronic continuum correction (ECC)33,40–for both for acetate34 and for guanidinium. In such ECC force fields,
electronic polarization is taken into account in a mean field way through scaling the total charge of the ions by a factor 0.75. This correction has been shown to improve ion pairing properties in many different ionic aqueous solutions.34,41,42 The detailed guanidinium force fields (Table S1) and further simulations details are provided in Supporting Information.
Acknowledgement
We thank Jacques Darpentigny and Louis Hennet for their help with the neutron scatter-ing experiments on the 7C2 beamline of the Orphee reactor in Saclay, France. PJ thanks the Czech Science Foundation for support via an EXPRO grant no. 19-26854X. EDD ac-knowledges support from the EMBO and Marie Curie Actions (fellowship ALTF 952-2015), and support by the "Initiative d’Excellence" program from the French State (Grants "DY-NAMO", ANR-11-LABX-0011, and "CACSICE", ANR-11-EQPX-0008). PEM acknowl-edges the support of his YouTube channel, thunderf00t. This work was performed using neutron beam time allocated at the Laboratoire Léon Brillouin in Saclay (proposal
2018-602), computer time allocated by the national supercomputing center IT4innovations in Ostrava (project OPEN-13-24) and MetaCentrum data storage facilities.
Supporting Information Available
Supporting Information is available, with additional experimental and computational details, and complementary analyses.
This material is available free of charge via the Internet at http://pubs.acs.org/.
References
(1) Jacobsen, C.; Linderstrom-Lang, K. Salt Linkage in Proteins. Nature 1949, 164, 411–412.
(2) Dill, K. A. Dominant Forces in Protein Folding. Biochemistry 1990, 29, 7133–7155.
(3) Mirsky, A. E.; Pauling, L. on the Structure of Native, Denatured, and Coagulated Proteins. Proc. Natl. Acad. Sci. U.S.A. 1936, 83, 439–447.
(4) Tanford, C. the Association of Acetate with Ammonium and Guanidinium Ions. J. Am. Chem. Soc. 1954, 76, 945–946.
(5) Barlow, D. J.; Thornton, J. M. Ion-Pairs in Proteins. J. Mol. Biol. 1983, 168, 867–885.
(6) Serrano, L.; Horovitz, A.; Avron, B.; Bycroft, M.; Fersht, A. R. Estimating the Contribution of Engineered Surface Electrostatic Interactions to Protein Stability by Using Double-Mutant Cycles. Biochemistry 1990, 29, 9343–9352.
(7) Waldburger, C. D.; Schildbach, J. F.; Sauer, R. T. Are Buried Salt Bridges Important for Protein Stability and Conformational Specificity? Nat. Struct. Biol. 1995, 2, 122–128.
(8) Marquese, S.; Baldwin, R. L. Helix Stabilization by Glu-...Lys+ Salt Bridges in Short Peptides of De Novo Design. Proc. Natl. Acad. Sci. USA 1987, 84, 8898–8902.
(9) Schueler, O.; Margalit, H. Conservation of Salt Bridges in Protein Families. J. Mol. Biol. 1995, 248, 125–135.
(10) Thomas, A. S.; Elcock, A. H. Molecular Simulations Suggest Protein Salt Bridges Are Uniquely Suited to Life at High Temperatures. J. Am. Chem. Soc. 2004, 126, 2208–2214.
(11) Calhoun, J. R.; Nastri, F.; Maglio, O.; Pavone, V.; Lombardi, A.; DeGrado, W. F. Artificial Diiron Proteins: From Structure to Function. Biopolymers (Pept. Sci.) 2005, 80, 264–278.
(12) Donald, J. E.; Kulp, D. W.; DeGrado, W. F. Salt Bridges: Geometrically Specific, Designable Interactions. Proteins 2011, 79, 898–915.
(13) Taly, A.; Corringer, P.-J.; Grutter, T.; de Carvalho, L. P.; Karplus, M.; Changeux, J.-P. Implications of the Quaternary Twist Allosteric Model for the Physiology and Pathology of Nicotinic Acetylcholine Receptors. Proc. Natl. Acad. Sci. USA 2006, 103, 16965–16970.
(14) Moraga-Cid, G.; Sauguet, L.; Huon, C.; Malherbe, L.; Girard-Blanc, C.; Petres, S.; Murail, S.; Taly, A.; Baaden, M.; Delarue, M. et al. Allosteric and Hyperekplexic Mutant Phenotypes Investigated on an α 1 Glycine Receptor Transmembrane Structure. Proc. Natl. Acad. Sci. USA 2015, 112, 2865–2870.
(15) De Vecchis, D.; Cavellini, L.; Baaden, M.; Hénin, J.; Cohen, M. M.; Taly, A. a Membrane-Inserted Structural Model of the Yeast Mitofusin Fzo1. Sci. Rep. 2017, 7, 1–17.
(16) Bosshard, H. R.; Marti, D. N.; Jelesarov, I. Protein Stabilization by Salt Bridges: Concepts, Experimental Approaches and Clarification of Some Misunderstandings. J. Mol. Recognit. 2004, 17, 1–16.
(17) Tomlinson, J. H.; Ullah, S.; Hansen, P. E.; Williamson, M. P. Characterization of Salt Bridges to Lysines in the Protein G B1 Domain. J. Am. Chem. Soc. 2009, 131, 4674–4684.
(18) Williamson, M. P.; Hounslow, A. M.; Ford, J.; Fowler, K.; Hebditch, M.; Hansen, P. E. Detection of Salt Bridges to Lysines in Solution in Barnase. Chem. Commun. 2013, 49, 9824– 9826.
(19) White, A. D.; Keefe, A. J.; Ella-Menye, J. R.; Nowinski, A. K.; Shao, Q.; Pfaendtner, J.; Jiang, S. Free Energy of Solvated Salt Bridges: A Simulation and Experimental Study. J. Phys. Chem. B 2013, 117, 7254–7259.
(20) Vaughan, C. K.; Harryson, P.; Buckle, A. M.; Fersht, A. R. a Structural Double-Mutant Cycle: Estimating the Strength of a Buried Salt Bridge in Barnase. Acta Crystallographica D 2002, 58, 591–600.
(21) Armstrong, C. T.; Mason, P. E.; Anderson, J. L.; Dempsey, C. E. Arginine Side Chain Interac-tions and the Role of Arginine As a Gating Charge Carrier in Voltage Sensitive Ion Channels. Sci. Rep. 2016, 6, 1–10.
(22) Springs, B.; Haake, P. Equilibrium Constants for Association of Guanidinium and Ammonium Ions with Oxyanions. the Effect of Changing Basicity of the Oxyanion. Bioorg. Chem. 1977, 6, 181–190.
(23) Sokalingam, S.; Raghunathan, G.; Soundrarajan, N.; Lee, S. G. a Study on the Effect of Surface Lysine to Arginine Mutagenesis on Protein Stability and Structure Using Green Fluorescent Protein. PLoS ONE 2012, 7 .
(24) Takano, K.; Tsuchimori, K.; Yamagata, Y.; Yutani, K. Contribution of Salt Bridges Near the Surface of a Protein to the Conformational Stability. Biochemistry 2000, 39, 12375–12381.
(25) Petrauskas, V.; Maximowitsch, E.; Matulis, D. Thermodynamics of Ion Pair Formations Be-tween Charged Poly(Amino Acid)s. J. Phys. Chem. B 2015, 119, 12164–12171.
(26) Enderby, J. E.; North, D. M.; Egelstaff, P. A. the Partial Structure Factors of Liquid Cu-Sn. Philosophical Magazine 1966, 14, 961–970.
(27) Neilson, G. W. the Application of Neutron Scattering Methods to Aqueous Electrolyte Solu-tions. Physica 120B 1983, 325–334.
(28) Cuello, G. J.; Darpentigny, J.; Hennet, L.; Cormier, L.; Dupont, J.; Homatter, B.; Beuneu, B. 7C2, the New Neutron Diffractometer for Liquids and Disordered Materials at LLB. J. Physics:
(29) Debiec, K. T.; Gronenborn, A. M.; Chong, L. T. Evaluating the Strength of Salt Bridges: A Comparison of Current Biomolecular Force Fields. J. Phys. Chem. B 2014, 118, 6561–6569.
(30) Pylaeva, S.; Brehm, M.; Sebastiani, D. Salt Bridge in Aqueous Solution: Strong Structural Motifs but Weak Enthalpic Effect. Sci. Rep. 2018, 8, 1–7.
(31) Leontyev, I. V.; Stuchebrukhov, A. Electronic Continuum Model for Molecular Dynamics Simulations of Biological Molecules. J. Chem. Theor. Comput. 2010, 6, 1498–1508.
(32) Kohagen, M.; Pluharová, E.; Mason, P. E.; Jungwirth, P. Exploring Ion-Ion Interactions in Aqueous Solutions by a Combination of Molecular Dynamics and Neutron Scattering. J. Phys. Chem. Lett. 2015, 6, 1563–1567.
(33) Leontyev, I.; Stuchebrukhov, A. Accounting for Electronic Polarization in Non-Polarizable Force Fields. Phys. Chem. Chem. Phys. 2011, 13, 2613–2626.
(34) Martinek, T.; Duboué-Dijon, E.; Timr, Š.; Mason, P. E.; Baxová, K.; Fischer, H. E.; Schmidt, B.; Pluharová, E.; Jungwirth, P. Calcium Ions in Aqueous Solutions: Accurate Force Field Description Aided by Ab Initio Molecular Dynamics and Neutron Scattering. J. Chem. Phys. 2018, 148, 222813.
(35) Humphrey, W., Dalke, A. and Schulten, K. VMD - Visual Molecular Dynamics. J. Molec. Graphics 1996, 14, 33–38.
(36) Barnes, A. C.; Lague, S. B.; Salmon, P. S.; Fischer, H. E. a Determination of the Structure of Liquid Ag2Se Using Neutron Diffraction and Isotopic Substitution. J. Phys.: Condens. Matt. 1997, 9, 6159–6173.
(37) Van der Spoel, D.; Lindahl, E.; Hess, B.; Groenhof, G.; Mark, A. E.; Berendsen, H. J. C. GROMACS: Fast, Flexible, and Free. J. Comput. Chem. 2005, 26, 1701–1718.
(38) Berendsen, H. J. C.; Grigera, J. R.; Straatsma, T. P. the Missing Term in Effective Pair Potentials. J. Phys. Chem. 1987, 91, 6269–6271.
(39) Wang, J. M.; Cieplak, P.; Kollman, P. A. How Well Does a Restrained Electrostatic Potential (RESP) Model Perform in Calculating Conformational Energies of Organic and Biological Molecules? J. Comput. Chem. 2000, 21, 1049–1074.
(40) Leontyev, I. V.; Stuchebrukhov, A. A. Electronic Continuum Model for Molecular Dynamics Simulations. J. Chem. Phys. 2009, 130, 085102.
(41) Pluharova, E.; Mason, P. E.; Jungwirth, P. Ion Pairing in Aqueous Lithium Salt Solutions with Monovalent and Divalent Counter-Anions. J. Phys. Chem. A 2013, 117, 11766–11773.
(42) Kohagen, M.; Mason, P. E.; Jungwirth, P. Accurate Description of Calcium Solvation in Con-centrated Aqueous Solutions. J. Phys. Chem. B 2014, 118, 7902–7909.