HAL Id: hal-00301073
https://hal.archives-ouvertes.fr/hal-00301073
Submitted on 19 May 2003HAL is a multi-disciplinary open access
archive for the deposit and dissemination of sci-entific research documents, whether they are pub-lished or not. The documents may come from teaching and research institutions in France or abroad, or from public or private research centers.
L’archive ouverte pluridisciplinaire HAL, est destinée au dépôt et à la diffusion de documents scientifiques de niveau recherche, publiés ou non, émanant des établissements d’enseignement et de recherche français ou étrangers, des laboratoires publics ou privés.
Out of Africa: High aerosol concentrations in the upper
troposphere over Africa
J. Heintzenberg, M. Hermann, D. Theiss
To cite this version:
J. Heintzenberg, M. Hermann, D. Theiss. Out of Africa: High aerosol concentrations in the upper troposphere over Africa. Atmospheric Chemistry and Physics Discussions, European Geosciences Union, 2003, 3 (3), pp.2661-2689. �hal-00301073�
ACPD
3, 2661–2689, 2003 High aerosol concentrations in the upper troposphere over Africa J. Heintzenberg et al. Title Page Abstract Introduction Conclusions References Tables Figures J I J I Back Close Full Screen / EscPrint Version
Interactive Discussion
c
EGU 2003
Atmos. Chem. Phys. Discuss., 3, 2661–2689, 2003 www.atmos-chem-phys.org/acpd/3/2661/
c
European Geosciences Union 2003
Atmospheric Chemistry and Physics Discussions
Out of Africa: High aerosol
concentrations in the upper troposphere
over Africa
J. Heintzenberg, M. Hermann, and D. Theiss
Leibniz-Institute for Tropospheric Research, Permoserstr. 15, 04318 Leipzig, Germany Received: 22 February 2003 – Accepted: 7 May 2003 – Published: 19 May 2003 Correspondence to: J. Heintzenberg (jost@mail.tropos.de)
ACPD
3, 2661–2689, 2003 High aerosol concentrations in the upper troposphere over Africa J. Heintzenberg et al. Title Page Abstract Introduction Conclusions References Tables Figures J I J I Back Close Full Screen / EscPrint Version
Interactive Discussion
c
EGU 2003
Abstract
In the year 2000, six flights (three southbound and three northbound) of the CARIBIC project were conducted between Germany and two destinations in the southern hemi-sphere (Windhoek, Namibia and Cape Town, South Africa). In the present report, results on particle number concentrations are discussed in three size ranges (> 4 nm,
5
>12 nm, and >18 nm particle diameter) during the unique transequatorial Africa flights.
The flights covered a total of about 80 h in May, July, and December. Thus, no claim can be made for long-term representativeness of the aerosol data. Nevertheless, they are the first upper systematic tropospheric transequatorial aerosol profiles over Africa. The average aerosol results show a broad maximum, roughly symmetrical to the equator,
10
which compares well in latitudinal extent to a maximum of CO concentrations measured on the same flights. This export of continental surface aerosol to the upper troposphere will be dispersed on a global scale both with the easterly flow near the equator and with the westerlies in the adjacent subtropical regions. There was strong evidence of recent new particle formation before aerosol arrival at flight level, in particular during the time
15
periods between 9:00 and 13:00 local time over Africa. Direct and indirect climate effects of the respective particulate matter remain to be investigated by future flights with the ongoing extension of the CARIBIC payload towards size-resolved measure-ments above 100 nm particle diameter. At the same time global chemical transport models and aerosol dynamics models need to be extended to be able to reproduce the
20
CARIBIC findings over Africa.
1. Introduction
Aerosol forcing of climate is an important issue in the discussion of climate change (Charlson and Heintzenberg, 1995). Despite its importance, the influence of aerosol particles on the Earth’s radiation budged is still highly uncertain (Houghton et al., 2001).
25
ACPD
3, 2661–2689, 2003 High aerosol concentrations in the upper troposphere over Africa J. Heintzenberg et al. Title Page Abstract Introduction Conclusions References Tables Figures J I J I Back Close Full Screen / EscPrint Version
Interactive Discussion
c
EGU 2003
an important role in heterogeneous chemistry and radiative forcing, e.g. by cirrus clouds (Laaksonen et al., 2000), and there is some evidence of their affecting trop-ical cumulus clouds (Sherwood, 2002). However, the knowledge on UT/LS aerosol particles is limited today (Raes et al., 2000).
The CARIBIC research project (Civil Aircraft for Regular Investigation of the
atmo-5
sphere Based on an Instrument Container, Brenninkmeijer et al., 1999) was designed to increase the very limited knowledge of trace gases and aerosol particles in the up-per troposphere and lower stratosphere. Beginning in 1997 on long-range commercial flights continuous measurements of particle number concentrations in three submi-crometer size ranges have been taken as part of this project. Initially, these flights
10
operated between Germany and the Indic. The southernmost latitudes of these flights reached about 5◦N. Until the year 2000, 45 measurement flights had been conducted on that route. A statistical discussion of the particle number concentrations presented in Hermann et al. (2003) showed that in the tropics high number concentrations of ultrafine particles smaller than about 10 nm in diameter frequently were encountered
15
at flight altitudes of about ten kilometers. Trajectory analyses and trace gas information strongly indicated that the some of the related air masses originated from low altitudes over Africa.
In 2000, six flights (three outbound and three homebound) were conducted between Germany and two destinations in the southern hemisphere (Windhoek, Namibia and
20
Cape Town, South Africa). In May 2002, the CARIBIC aircraft has been decommis-sioned and the payload is being rebuilt for deployment on another aircraft starting in late 2003. In the present report, the results on particle number concentrations during the unique transequatorial Africa flights are discussed.
2. Instrumental
25
Particle number concentrations were measured with a combination of three Conden-sation Particle Counters (CPCs, TSI Model 7610, St. Paul, MN) operated in
paral-ACPD
3, 2661–2689, 2003 High aerosol concentrations in the upper troposphere over Africa J. Heintzenberg et al. Title Page Abstract Introduction Conclusions References Tables Figures J I J I Back Close Full Screen / EscPrint Version
Interactive Discussion
c
EGU 2003
lel. These instruments were modified for low-pressure conditions and aviation require-ments, and were extensively tested with respect to their counting efficiency at operating pressures of 160–1000 hPa (Hermann and Wiedensohler, 2001). The lower threshold diameters of the CPCs (i.e. the particle diameter with 50% detection efficiency) were set to 4 nm (N4), 12 nm (N12), and 18 nm (N18), respectively, by increasing or
decreas-5
ing the temperature difference between the saturator and condenser block inside the counters. The upper threshold diameter was determined by the aerosol inlet system to 1.3 µm (50% sampling efficiency), which had been characterized in detail in terms of aspiration efficiency and transmission by Hermann (2000). Subtracting the readings of the first two counters yields the number concentration of ultrafine particles (N4−12).
10
Number concentrations were recorded with a time resolution of two seconds on flight levels corresponding to pressures below 500 hPa. As all single-particle counters, the CARIBIC CPCs suffer from coincidence errors due to finite probabilities of more than one particle being present concurrently in the sensing volume. Up to true concentra-tions of 40 000 cm−3 (at working pressure) this error was corrected for after an
empir-15
ical coincidence calibration (Hermann and Wiedensohler, 2001). The coincidence-corrected counting results are reduced to STP-conditions (1013.25 hPa, 273.15 K). Consequently, the upper limit of acceptable CPC data increases to about 120 000 cm−3 (STP) and was set to 100 000 cm−3 (STP) in all results presented below.
Besides correction for particle coincidence, number concentrations were corrected
20
for losses in the inlet and in the sampling line (≈27% for N4−12 and 10% for N12 and N18), for pressure-dependent CPC flow rates, and CPC counting efficiencies (Hermann and Wiedensohler, 2001). Together, these corrections account for a particle-size and number-concentration-dependent increase in raw particle concentrations by a factor of 1.2 to 2.
25
For data analysis, the CARIBIC system provided additional information on ozone and carbon monoxide mixing ratios along the flight track (cf. Brenninkmeijer et al. 1999). For each CARIBIC flight, aircraft position and altitude information were used together with ECMWF data to calculate three-dimensional 5-day back trajectories every
ACPD
3, 2661–2689, 2003 High aerosol concentrations in the upper troposphere over Africa J. Heintzenberg et al. Title Page Abstract Introduction Conclusions References Tables Figures J I J I Back Close Full Screen / EscPrint Version
Interactive Discussion
c
EGU 2003
five minutes along the CARIBIC flight paths. This work was done by the Royal Dutch Meteorological Service, KNMI, de Bilt, Netherlands.
3. Results and discussion
3.1. Overview
General parameters of the six Africa flights are listed in Table 1. Figure 1 shows the two
5
transequatorial routes taken on these flights. Because of different African flight desti-nations, they differ mainly over southern Africa whereas the rest of Africa was crossed on very similar routes on each flight. Small differences are due to larger tropical con-vective systems that were circumvented by the pilots. Two sources of meteorological information were used to delineate the extent of the Intertropical Convergence Zone
10
(ITCZ) along the CARIBIC flight tracks. For the planetary boundary layer the 700 hPa, potential temperatures from ECWMF fields were used. Strong temperature gradients in the climatologically most probable regions were taken as delineators. ECWMF high cloud fields and METEOSAT images in the visible channel were used as ITCZ delin-eators in flight level. As expected, the ITCZ divided into two branches diverging in
15
easterly direction over the African continent. The estimated northern and southern limits of the ITCZ are also listed in Table 1.
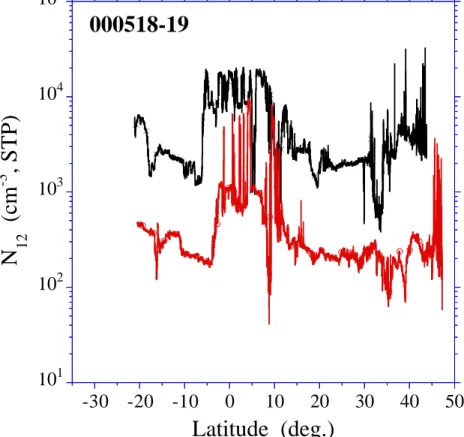
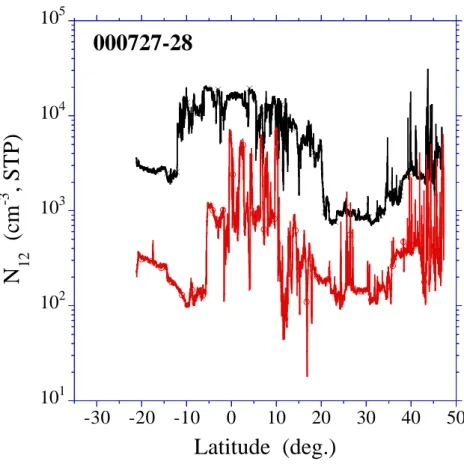
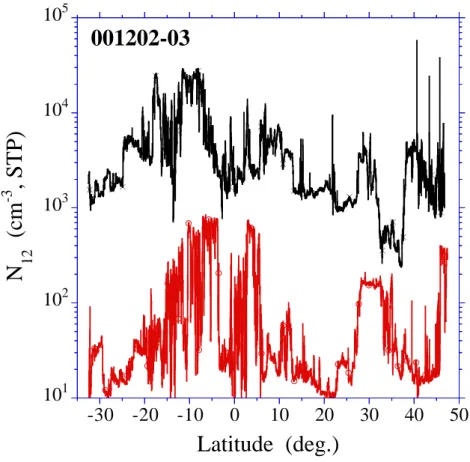
In Fig. 2a, N12 for all flights is drawn as a function of latitude in order to visualize similarities and differences between the six flights. As on all other CARBIC flights the European region stands out with short periods of high concentrations that can be
20
explained by high air traffic densities with ensuing emissions of exhaust gases and particles. During the day-flight in boreal summer, (cf. subplot 000728 in Fig. 2a), convective activity over Europe added to the upper tropospheric aerosol burden.
On most flights, northern subtropical latitudes are characterized by low and rather stable particle concentrations, confirming the findings of Hermann et al. (2003) for
25
ACPD
3, 2661–2689, 2003 High aerosol concentrations in the upper troposphere over Africa J. Heintzenberg et al. Title Page Abstract Introduction Conclusions References Tables Figures J I J I Back Close Full Screen / EscPrint Version
Interactive Discussion
c
EGU 2003
southern subtropical latitudes as well. Very different results were found in the tropics. In boreal spring and summer there is a broad latitudinal region of roughly ±15◦around the equator in which evening and night flights (000518, 000727, 001202) yielded N12 values, which were elevated by a factor of 3–5 compared to the remainder of the flights. In austral summer, (cf. subplot 001202 in Fig. 2a), this region is shifted to the south
5
and exhibits a gap near the equator. The region of elevated particle concentrations roughly compares with the extent of the ITCZ along the flight tracks (cf. Table 1). The dip in average particle concentrations close to the equator can be explained by the bifurcation in the ITCZ over the African continent. According to the satellite images in the visible this bifurcation became more pronounced towards the end of the series of
10
flights (cf. flights 001202/03). The three day-flights (000519, 000728, 001203) likewise show the broad maximum in the particle number concentration. However, there are high concentration peaks superposed, exceeding 100 000 particles cm−3 STP. These are the highest concentrations ever measured during CARIBIC. The general shape of the increase in particle concentrations over the African continent is quite similar within
15
each of the three pairs of flights, each of which covered a total period of about 24 h. Average ratios of northern to southern hemisphere concentrations can be formed by combining the data of the northern subtropics with the rest of the respective flights data north of these latitudes (cf. Table 2). Averaging over all flights yields concentration ratios of northern-to-southern hemisphere data of 1.8, 1.4, and 1.3 in the size
chan-20
nels N4, N12, and N18, respectively. These values are smaller as similar hemispheric ratios given in Minikin et al. (2003) for the INCA project who report values between two and three. The CARIBIC data, however, only reach down to 33◦S, whereas the INCA data reach 53◦S, Furthermore, the present data set does not encompass data from the heavily trafficked north Atlantic flight corridor, as did the INCA data. We also
25
note that on all of the first four flights a decrease in N12 was encountered between the southernmost end of the flights and the onset of the concentration bulge near the equator (cf. Fig. 2a). The last two flights, on the other hand, did not exhibit this feature.
ACPD
3, 2661–2689, 2003 High aerosol concentrations in the upper troposphere over Africa J. Heintzenberg et al. Title Page Abstract Introduction Conclusions References Tables Figures J I J I Back Close Full Screen / EscPrint Version
Interactive Discussion
c
EGU 2003
3.2. Ultrafine particles over tropical Africa
During flights, which passed over tropical Africa around local noon, much higher ratios of tropical to subtropical number concentrations were measured, reaching average val-ues up to ten for the ratio of N4 (tropical to northern subtropics, cf. Table 2). Often, extremely high and extremely variable particle concentrations were recorded.
Accord-5
ing to the coincidence limits of the CPCs (cf. Sect. 2), values larger than 120 000 cm−3 (STP) were excluded from the latitudinal averages presented in Table 2 and from the graphs.
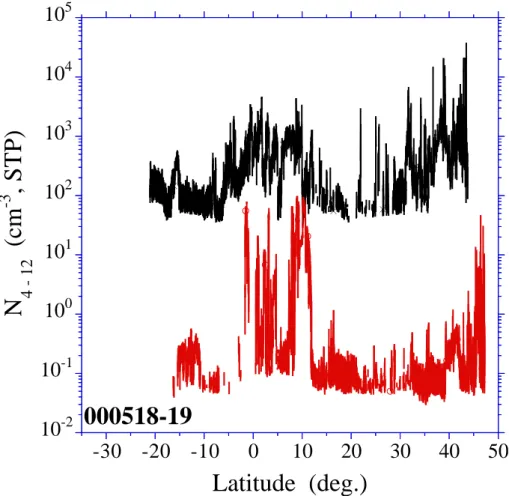
The difference between day flights and night flights becomes much more obvious in the difference N4−12, also termed ultrafine particles (UFP), as plotted in Fig. 2b in
10
the same way as N12 is shown in Fig. 2a. This difference emphasizes the smallest particles, which most recently have been formed near the flight path or have been transported up rapidly from their source region in the lower troposphere. We note that N4−12 may become insignificant or even negative for short periods, at low values of N4−12 because of statistical fluctuations in the two counters. Therefore, only values of
15
N4−12 are shown that are larger than the Poisson counting error of N4.
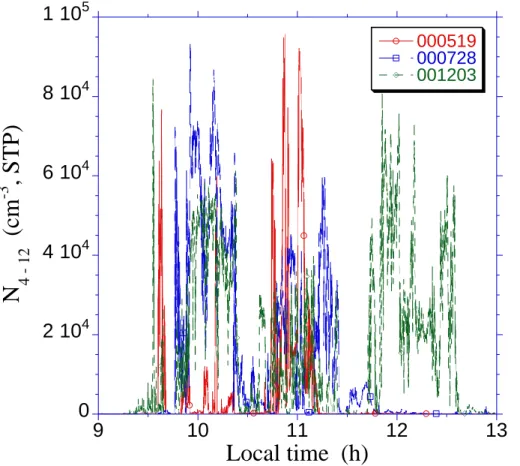
N4−12 of the day flights is presented as a function of local time in Fig. 3 in order to emphasize their connection with the sunlit part of the day. Strong maxima on all three daytime flights appeared between 09:30 and 12:30 LT, the period during which many continental UFP studies reported new particle formation due to mixing and/or
20
photochemical activity in the planetary boundary layer (e.g. Birmili et al., 2001). Low particle concentrations occurred in between, e.g. 10:30 and 11:30 LT (cf. Fig. 3). The corresponding trajectories (not shown) indicated upper tropospheric and lower stratospheric air and the satellite images indicate a cloud-free region in the bifurcated continental ITCZ.
25
If these high concentrations were related to recent particle nucleation events it can be expected that these events should be strongest with a minimum of preexisting par-ticulate surface that could compete for the condensable vapors that otherwise nucleate.
ACPD
3, 2661–2689, 2003 High aerosol concentrations in the upper troposphere over Africa J. Heintzenberg et al. Title Page Abstract Introduction Conclusions References Tables Figures J I J I Back Close Full Screen / EscPrint Version
Interactive Discussion
c
EGU 2003
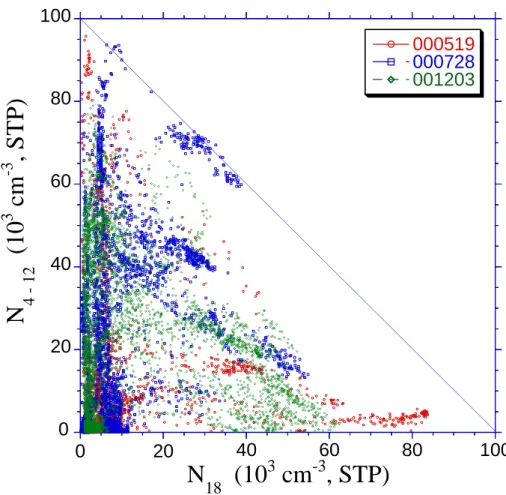
To date, no particle surface-related parameter is measured in the CARIBIC payload. As a compromise, the largest particle channel N18 was related to N4−12 in Fig. 4 for the three daytime flights. Consistently on all three day-flights, there is a general trend towards highest values of N4−12with lowest N18 in accord with atmospheric nucleation concepts.
5
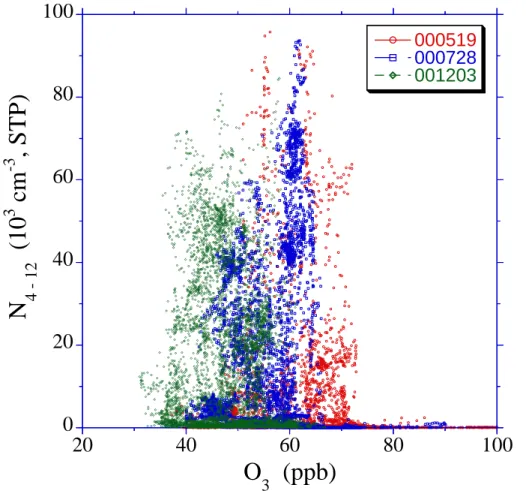
From the available information it is difficult to assess where the measured UFPs had been produced. From local ozone concentrations, the origin of the air masses can be gleaned. During the periods of the strong local maxima of N4−12, mostly values below 80 ppb were recorded, during the December flight often below 50 ppb (cf. Fig. 5). Average values for the period 09:30 and 12:30 LT were 67, 63, and 49 ppb for the flights
10
000519, 000728, and 001203, respectively.
Low ozone values are typical for tropical surface air. Over the tropical Atlantic (20◦S– 30◦N, 1977–1996), average surface values for the period 1977–1996 as measured by the German Weather Service (P. Winkler, private communication), were 33, 31, and 21 ppb for the months May, July, and December, respectively. For the Mt. Kenya
15
GAW station the corresponding average values for the period 1999–2002 were 26, 19, 16 ppb. Whereas average absolute ozone values at the surface apparently were somewhat lower than during the UFP-events on the CARIBIC flights, the seasonal trend is in qualitative agreement, with the lowest values during the austral summer and the highest values in May.
20
For the flight 000728 M ¨uhle et al. (2002) have evaluated the trace gas analyses together with the particle data. Their CO enhancement ratios over tropical Africa for non-methane hydrocarbons and methyl halides are consistent with those reported from fresh biomass burning plumes, thus corroborating the results of the present study.
3.3. The origin of sampled air masses
25
The CARIBIC trajectories were explored for their potential information content con-cerning convective transport of polluted continental surface air to the flight paths. We focused our attention on the latitude band ±25◦ about the equator which covers both
ACPD
3, 2661–2689, 2003 High aerosol concentrations in the upper troposphere over Africa J. Heintzenberg et al. Title Page Abstract Introduction Conclusions References Tables Figures J I J I Back Close Full Screen / EscPrint Version
Interactive Discussion
c
EGU 2003
major areas of biomass burning and strong convective activity (Herman et al., 1997; Sherwood, 2002). During periods of high number concentrations only few trajectories reached down into the African planetary boundary layer allowing to explain periods with high particle number concentrations. This limitation is due to the fact that the meteo-rological models on which the trajectory calculations are based are unable to resolve
5
the processes and scales which control rapid vertical mixing of polluted surface air to the flight level. As a simplistic first indirect approach, the horizontal trajectory positions were merged with a GISS-based map of the national boundaries of African states and the lengths of the trajectories over each country relative to the total territorial boundary of each country was calculated. These relative lengths were summed over all African
10
states within ±25◦latitude about the equator and then correlated with the aerosol infor-mation after interpolating the GISS results linearly in between the five-minute intervals of trajectory information with the timing information of the CPC data. For individual flights correlation coefficients up to 0.63 were reached (flight 000727). However, the average correlation coefficient over all six flights was only 0.38 with a minimum of −0.01
15
for flight 000728.
In two ways this simplistic trajectory evaluation was augmented. First the three-dimensional information was exploited by weighing the land passages of the trajecto-ries with the pressure changes along the trajectotrajecto-ries by the following procedure. A cubic spline approximation developed by Reinsch (1967) was used for this purpose.
20
The pressure differences were calculated as first derivative of the spline-interpolated trajectory at the center of each interval of three one-hour time steps of a trajectory. A factor was determined to normalize this derivative and transform it into a range of val-ues between zero on one. The normalization was by difference of estimated pressure at this point to a fixed maximum pressure. This weighing is based on the fact that
large-25
scale subsidence as indicated by corresponding pressure changes supresses convec-tive upward transport of surface air and that the influence of surface air increases at trajectory levels near the surface. Additionally, the relative lengths of land passages were weighted with the sum of GEIA emission inventories for black carbon emissions
ACPD
3, 2661–2689, 2003 High aerosol concentrations in the upper troposphere over Africa J. Heintzenberg et al. Title Page Abstract Introduction Conclusions References Tables Figures J I J I Back Close Full Screen / EscPrint Version
Interactive Discussion
c
EGU 2003
from biomass and fossil fuel burning over Africa (http://weather.engin.umich.edu/geia/). Whereas some improvements of trajectory/CPC correlations in subsidence regions south of the ITCZ and close to the equator (within the divided ITCZ over the African continent), the overall correlation coefficients did not improve in comparison with those from the unweighted relative land passages. Hence the refined trajectory approach did
5
not provide more conclusive information on the continental origin of the particles.
3.4. The question of artifacts
All flights crossed the ITZC that is characterized by strong convective activity with cu-mulus towers reaching beyond the average ten-kilometer flight altitudes. There are many reports of artifact signals created at aerosol inlets on aircraft when operating in
10
clouds (e.g. Clarke et al., 1997; Hudson, 1993; Hudson and Frisbie, 1991; Weber et al., 1998). Cloud drops shattering and splashing at the edges of the inlets are sup-posed to create large numbers of fragments that are aspirated, dried, and recorded as small residues in aerosol sensors. The presumed processes include the formation of water films on the inlets that tear off at downstream edges of the inlet, again creating
15
fragment drops that cause artifact aerosol signals.
To date the CARIBIC payload does not comprise any cloud sensor. Thus, there are no direct measurements available to decide if in-cloud artifact formation occurred. In the following, we are collecting arguments supporting our assumption that the present aerosol data were not affected significantly by cloud artifacts.
20
Guided by on-board radar commercial aircraft specifically avoid large cumulus tow-ers, trying to pass the area 100–200 km upwind of the core by changing course some ten minutes ahead of the cloud passage. Therefore, cloud encounters can expected to be infrequent.
Due to the nature of the artifact processes, the distribution of drop fragment sizes
25
and numbers is expected to be chaotic in nature. Consequently, the size distribution of residue aerosol particles should be chaotic in nature as well. As a first test of the regularity of the number size distributions in the region of potential cloud passages the
ACPD
3, 2661–2689, 2003 High aerosol concentrations in the upper troposphere over Africa J. Heintzenberg et al. Title Page Abstract Introduction Conclusions References Tables Figures J I J I Back Close Full Screen / EscPrint Version
Interactive Discussion
c
EGU 2003
shape of the measured size distributions was checked by comparing ratios of concen-tration increases in the three size channels. As a sudden concenconcen-tration step, a factor of two increase within two seconds in N4 relative to the average concentration of the past ten seconds was defined. Whenever this occurred, the respective increases in N12 and N18 were calculated. In only 22 of 92497 recordings did the concentration
ra-5
tios as defined above increase monotonically from N4 to N18. This very small number increased to 63 when only comparing N12 to N4, i.e. only in 63 cases did N12increase more strongly than N4 according to the above definition. In the vast majority of cases concentration increases were characterized by the smallest particles increasing most strongly, which is typical for recently nucleated atmospheric aerosols.
10
To our knowledge, there are no reports of artifact aerosol signals in ice clouds. On the opposite, even reduced interstitial aerosol signals have been reported in cirrus (Str ¨om et al., 1999). Arguments have been given for the fragmentation processes be-ing less important in these clouds (Weber et al., 1998). We took this as the startbe-ing point of a second test for potential artifacts in our data. Air temperatures of −40◦C are
15
usually taken as a limit between water clouds and ice clouds. For the flight starting 001203 the total number of data points with temperatures below −40◦C was roughly equal to that above −40◦C. We used an FFT analysis in order to compare the fre-quency (f ) distributions of the two populations (three size channels each). Over the range of 0.001 to 0.2 Hz the data smoothly followed an f−5/3 power law, indicating a
20
well-mixed underlying atmosphere without indications of chaotic processes as would have been expected for chaotic cloud drop fragmentation. Furthermore, the frequency distributions are very similar in all three size-channels, corroborating the results of the first test.
4. Conclusions
25
The CARIBIC flights over Africa covered a total of about 80 h in May, July, and De-cember 2000. Thus, no claim can be made for long-term representativeness of these
ACPD
3, 2661–2689, 2003 High aerosol concentrations in the upper troposphere over Africa J. Heintzenberg et al. Title Page Abstract Introduction Conclusions References Tables Figures J I J I Back Close Full Screen / EscPrint Version
Interactive Discussion
c
EGU 2003
particle data. Nevertheless, they are the first systematic upper tropospheric transequa-torial aerosol profiles over Africa, which global chemical transport models need for their validation. Thus, we plotted average meridional distributions of the three aerosol chan-nels in Fig. 6 in 2.5◦ latitudinal bins to demonstrate the effect of the African continent on the upper tropospheric submicrometer aerosol. The average particle results show
5
a broad maximum, roughly symmetrical to the equator, which compares well in latitudi-nal extent to a maximum of CO concentrations measured on the same flights. Ozone, on average, on the other hand does not show a corresponding minimum around the equator.
This export of continental surface aerosol to the upper troposphere will be dispersed
10
on a global scale both with the easterly flow near the equator and with the westerlies in the adjacent subtropical regions. Direct and indirect climate effects of the respective particulate matter remain to be investigated on future flights with the ongoing extension of the CARIBIC payload towards size- resolved measurements above 100 nm particle diameter. At the same time global chemical transport models and aerosol dynamics
15
models need to be extended to be able to reproduce the CARIBIC findings over Africa.
Acknowledgement. Part of this work has been funded by the European Commission through contract number ENV-CT95-0006 and the Ministry for Research and Education of the Federal Republic of Germany under project number 07ATF17 (CARIBIC) within the AFO2000 research program. We gratefully acknowledge the support by the carrier of the CARIBIC payload and
20
industry partner of the project, LTU International Airways. We thank P. van Velthoven and H. Cuijpers, KNMI, de Bilt, Netherlands for calculating backward trajectories, and EUMETSAT (Darmstadt, Germany) for providing the Meteosat-5 satellite images. Furthermore, we thank the German Weather Service, represented by P. Winkler, and the Kenya Meteorological De-partment, represented by J. K. Rotich for their respective ozone data. H. Siebert of IfT kindly
25
ACPD
3, 2661–2689, 2003 High aerosol concentrations in the upper troposphere over Africa J. Heintzenberg et al. Title Page Abstract Introduction Conclusions References Tables Figures J I J I Back Close Full Screen / EscPrint Version
Interactive Discussion
c
EGU 2003
References
Charlson, R. J. and Heintzenberg, J.: Aerosol Forcing of Climate (Ed.), John Wiley & Sons, New York, 416, 1995.
Birmili, W., Wiedensohler, A., Heintzenberg, J., and Lehmann, K.: Atmospheric particle number size distribution in Central Europe: Statistical relations to air masses and meteorology, J.
5
Geophys. Res., 106, 32 005–32 018, 2001.
Brenninkmeijer, C. A. M., Crutzen, P. J., Fischer, H., G ¨usten, H., Hans, W., Heinrich, G., Heintzenberg, J., Hermann, M., Immelmann, T., Kersting, D., Maiss, M., Nolle, M., Pitschei-der, A., Pohlkamp, H., Scharffe, D., Specht, K., and Wiedensohler, A.: CARIBIC – civil aircraft for global measurements of trace gases and aerosols in the tropopause region, J.
10
Atmos. Oceanic Technol., 16, 1373-1383, 1999.
Clarke, A. D., Uehara, T., and Porter, J. N.: Atmospheric nuclei and related aerosol fields over the Atlantic: Clean subsiding air and continental pollution during ASTEX, J. Geophys. Res., 102, 25 281–25 292, 1997.
Herman, J. R., Herman, Barthia, P. K., Torres, O., Hsu, C., Seftor, C., and Celarier, E.: Global
15
distribution of UV-absorbing aerosols from Nimbus 7/TOMS data, J. Geophys. Res., 102: 16 911-16 922, 1997.
Hermann, M.: Development and application of an aerosol measurement system for use on commercial aircraft, Ph.D. Thesis, University of Leipzig, Leipzig, 114, 2000.
Hermann, M., Heintzenberg, J., Wiedensohler, A., Brenninkmeijer, C. A. M., Heinrich, G., and
20
Zahn, A.: Meridional distributions of aerosol particle number concentrations in the upper troposphere and lower stratosphere obtained by CARIBIC flights, J. Geophys. Res., 108, 4114, doi:10.1029/2001JD0001077, 2003.
Hermann, M. and Wiedensohler, A.: Counting efficiency of condensation particle counters at low-pressures with illustrative data from the upper troposphere, J. Aerosol Sci., 32, 975–991,
25
2001.
Houghton, J. T., Ding, Y., Griggs, D. J., Noguer, M., Linden, P. J. v. d., and Xiaosu, D.: Cli-mate Change 2001: The Scientific Basis, J. T. Houghton (Ed.), Cambridge University Press, Cambridge UK: 896, 2001.
Hudson, J. G.: Cloud condensation nuclei near marine cumulus, J. Geophys. Res. 98, 2693–
30
2702, 1993.
ACPD
3, 2661–2689, 2003 High aerosol concentrations in the upper troposphere over Africa J. Heintzenberg et al. Title Page Abstract Introduction Conclusions References Tables Figures J I J I Back Close Full Screen / EscPrint Version
Interactive Discussion
c
EGU 2003
Res., 96, 20 795–20 808, 1991.
Laaksonen, A., Pirjola, L., Kulmala, M., Wohlfrom, K.-H., Arnold, F., and Raes, F.: Upper tropospheric SO2 conversion into sulfuric acid aerosols and cloud condensation nuclei, J. Glaciol. 105, 1459–1469, 2000.
Minikin, A., Petzold, A., Str ¨om, J., Krejci, R., Seifert, M., Velthoven, P. v., Schlager, H., and
5
Schumann, U.: Interhemispheric differences in the upper tropospheric fine particle aerosol at midlatitudes, Geophys. Res. Lett., (in press), 2003.
M ¨uhle, J., Brenninkmeijer, C. A. M., Rhee, T. S., Slemr, F., Oram, D. E., Penkett, S. A., and Zahn, A.: Biomass burning and fossil fuel signatures in the upper troposphere observed during a CARIBIC flight from Namibia to Germany, Geophys. Res. Lett., 29, 19 16-1–16-4,
10
2002.
Raes, F., Van Dingenen, R., Vignati, E., Wilson, J., Putaud, J.-P., Seinfeld, J. H., and Adams, P.: Formation and cycling of aerosols in the global troposphere, Atmos. Environ., 34, 4215– 4240, 2000.
Reinsch, C. H.: Smoothing by Spline Functions, Numer. Math., 10, 177–183, 1967.
15
Sherwood, S. C.: A microphysical connection among biomass burning, cumulus clouds, and stratospheric moisture, Science, 295, 1272-1275, 2002.
Str ¨om, J., Fischer, H., Lelieveld, J., and Schr ¨oder, F.: In situ measurements of microphysical properties and trace gases in two cumulonimbus anvils over western Europe, J. Geophys. Res., 104, 12 221–12 226, 1999.
20
Weber, R. J., Clarke, A. D., Litchy, M., Li, J., Kok, G., Schillawski, R. D., and McMurry, P. H.: Spurious aerosol measurements when sampling from aircraft in the vicinity of clouds, J. Geophys. Res., 103, 28 337–28 346, 1998.
ACPD
3, 2661–2689, 2003 High aerosol concentrations in the upper troposphere over Africa J. Heintzenberg et al. Title Page Abstract Introduction Conclusions References Tables Figures J I J I Back Close Full Screen / EscPrint Version
Interactive Discussion
c
EGU 2003
Table 1. Parameters of the six Africa flights of project CARIBIC in 2000. ITCZ-North= Northern
latitudinal boundary of the Intertropical Convergence Zone (ITCZ) along the CARIBIC flight track, delineated from high clouds in ECWMF analyses; in parentheses the corresponding values from strong gradients in the modeled 700 hPa temperature fields are given. ITCZ-South = as ITCZ-North but for the southern boundary of the ITCZ
# From Departure To Arrival ITCZ-
ITCZ-Date, UTC1 Date, UTC1 North South
1 Munich 000518 19:40 Windhoek 000519 03:43 13◦N (36◦N) 4◦S (7◦S) 2 Windhoek 000519 06:32 Munich 000519 15:27 7◦N (36◦N) 0◦N (7◦S) 3 Munich 000727 19:00 Windhoek 000728 03:45 12◦N (38◦N) 4◦S (4◦S) 4 Windhoek 000728 06:31 Munich 000728 15:17 8◦N (38◦N) 3◦S (5◦S) 5 Munich 001202 11:30 Cape Town 001202 21:30 10◦N (12◦N) 22◦S (29◦S) 6 Cape Town 001203 06:44 Munich 001203 17:13 13◦N (12◦N) 20◦S (29◦S)
1
ACPD
3, 2661–2689, 2003 High aerosol concentrations in the upper troposphere over Africa J. Heintzenberg et al. Title Page Abstract Introduction Conclusions References Tables Figures J I J I Back Close Full Screen / EscPrint Version
Interactive Discussion
c
EGU 2003
Table 2. Latitudinal arithmetic average number concentrations (cm−3, STP) of the six Africa flights of project CARIBIC in 2000. Latitude ranges are given for each average as minimum and maximum latitudes (Latmin, Latmax). N4, av= diameters = 4 nm, N12, av= diameters = 12 nm, N18, av = diameters = 18 nm. Averages over all flights of regional number concentrations and average ratios of concentrations in the tropics to those in northern and southern subtropics are given in the last two lines, respectively
Subtropical southern hemisphere Tropics Subtropical northern hemisphere
# Latmin Latmax N4, av N12, av N18, avLatmin Latmax N4, av N12, av N18, av Latmin Latmax N4, av N12, av N18, av
1 -18 -6.7 2200 2100 1780 -6.7 14 9940 9380 8900 14 30 2150 2110 1970 2 -18 -3.6 2730 2670 2380 -3.6 17 19000 11800 9810 17 30 2170 2120 1890 3 -21 -12 2680 2650 2480 -12 21 11700 11000 10400 21 30 923 918 919 4 -18 -5.5 1830 1830 1730 -5.5 19 24800 12200 8260 19 30 1610 1580 1280 5 -32 -25 1700 1710 1530 -25 13 8170 7130 5880 13 26 1470 1420 1260 6 -28 -23 1560 1620 1450 -23 13 30000 16400 11300 17 26 1580 1590 1350 Average 2120 2100 1890 17300 11300 9090 1650 1620 1450 Ratio tropical /subtropical 8.2 5.4 4.8 10 7.0 6.3 2676
ACPD
3, 2661–2689, 2003 High aerosol concentrations in the upper troposphere over Africa J. Heintzenberg et al. Title Page Abstract Introduction Conclusions References Tables Figures J I J I Back Close Full Screen / EscPrint Version
Interactive Discussion
c
EGU 2003
Fig. 1. (a) Flight route and horizontal projections of 3-dimensional 5-day back trajectories
plot-ted from the flight positions every 30 min for flight 000519 from Windhoek, Namibia to Munich, Germany.
ACPD
3, 2661–2689, 2003 High aerosol concentrations in the upper troposphere over Africa J. Heintzenberg et al. Title Page Abstract Introduction Conclusions References Tables Figures J I J I Back Close Full Screen / EscPrint Version
Interactive Discussion
c
EGU 2003
ACPD
3, 2661–2689, 2003 High aerosol concentrations in the upper troposphere over Africa J. Heintzenberg et al. Title Page Abstract Introduction Conclusions References Tables Figures J I J I Back Close Full Screen / EscPrint Version Interactive Discussion c EGU 2003
10
110
210
310
410
5-30
-20
-10
0
10
20
30
40
50
000518-19
N
12(cm
-3, STP)
Latitude (deg.)
Fig. 2. (a) Latitudinal distributions of particle number concentrations larger than 12 nm in
diam-eter (N12, cm−3, STP) for the six Africa flights of project CARIBIC. The flights are identified by their starting dates (cf. Table 1). Respective outbound and return flights are collected in one graph each. Data of return flights are shifted down by one order of magnitude, except for flight 001203, which is shifted down by two orders of magnitude to facilitate intercomparisons.
ACPD
3, 2661–2689, 2003 High aerosol concentrations in the upper troposphere over Africa J. Heintzenberg et al. Title Page Abstract Introduction Conclusions References Tables Figures J I J I Back Close Full Screen / EscPrint Version Interactive Discussion c EGU 2003
10
110
210
310
410
5-30
-20
-10
0
10
20
30
40
50
000727-28
N
12(cm
-3, STP)
Latitude (deg.)
Fig. 2. (a) Continued.ACPD
3, 2661–2689, 2003 High aerosol concentrations in the upper troposphere over Africa J. Heintzenberg et al. Title Page Abstract Introduction Conclusions References Tables Figures J I J I Back Close Full Screen / EscPrint Version Interactive Discussion c EGU 2003
10
110
210
310
410
5-30
-20
-10
0
10
20
30
40
50
001202-03
Latitude (deg.)
N
12(cm
-3, STP)
ACPD
3, 2661–2689, 2003 High aerosol concentrations in the upper troposphere over Africa J. Heintzenberg et al. Title Page Abstract Introduction Conclusions References Tables Figures J I J I Back Close Full Screen / EscPrint Version Interactive Discussion c EGU 2003
10
-210
-110
010
110
210
310
410
5-30
-20
-10
0
10
20
30
40
50
000518-19
N
4 - 12(cm
-3, STP)
Latitude (deg.)
Fig. 2. (b) Latitudinal distributions of particle number concentrations between 4 and 12 nm
in diameter (N4−12, cm−3, STP) for the six Africa flights of project CARIBIC. The flights are identified by their starting dates (cf. Table 1). Respective outbound and return flights are collected in one graph each. Data of return flights are shifted down by two orders of magnitude to facilitate intercomparisons.
ACPD
3, 2661–2689, 2003 High aerosol concentrations in the upper troposphere over Africa J. Heintzenberg et al. Title Page Abstract Introduction Conclusions References Tables Figures J I J I Back Close Full Screen / EscPrint Version Interactive Discussion c EGU 2003
10
-210
-110
010
110
210
310
410
5-30
-20
-10
0
10
20
30
40
50
000727-28
N
4 - 12(cm
-3, STP)
Latitude (deg.)
Fig. 2. (b) Continued.ACPD
3, 2661–2689, 2003 High aerosol concentrations in the upper troposphere over Africa J. Heintzenberg et al. Title Page Abstract Introduction Conclusions References Tables Figures J I J I Back Close Full Screen / EscPrint Version Interactive Discussion c EGU 2003
10
-210
-110
010
110
210
310
4-30
-20
-10
0
10
20
30
40
50
001202-03
N
4 - 12(cm
-3, STP)
Latitude (deg.)
Fig. 2. (b) Continued.ACPD
3, 2661–2689, 2003 High aerosol concentrations in the upper troposphere over Africa J. Heintzenberg et al. Title Page Abstract Introduction Conclusions References Tables Figures J I J I Back Close Full Screen / EscPrint Version Interactive Discussion c EGU 2003
0
2 10
44 10
46 10
48 10
41 10
59
10
11
12
13
000519 000728 001203N
4 - 12(cm
-3, STP)
Local time (h)
Fig. 3. Number concentrations of aerosol particles between 4 and 12 nm diameter (N4−12, cm−3, STP) as a function of local time during the period 09:00–13:00 on the flights 000519, 000728, and 001203.
ACPD
3, 2661–2689, 2003 High aerosol concentrations in the upper troposphere over Africa J. Heintzenberg et al. Title Page Abstract Introduction Conclusions References Tables Figures J I J I Back Close Full Screen / EscPrint Version Interactive Discussion c EGU 2003
0
20
40
60
80
100
0
20
40
60
80
100
N
18(10
3cm
-3, STP)
N
4 - 12(10
3cm
-3, STP)
000519
000728
001203
Fig. 4. Number concentrations of aerosol particles between 4 and 12 nm diameter (N4−12, cm−3, STP) as a function of number concentrations of aerosol particles larger than 18 nm di-ameter (N18) cm−3 STP during local times between 09:00 and 13:00 on the flights 000519, 000728, and 001203.
ACPD
3, 2661–2689, 2003 High aerosol concentrations in the upper troposphere over Africa J. Heintzenberg et al. Title Page Abstract Introduction Conclusions References Tables Figures J I J I Back Close Full Screen / EscPrint Version Interactive Discussion c EGU 2003
0
20
40
60
80
100
20
40
60
80
100
O
3(ppb)
N
4 - 12(10
3cm
-3, STP)
000519
000728
001203
Fig. 5. Number concentrations of aerosol particles between 4 and 12 nm diameter (N4−12, cm−3, STP) as a function of local ozone concentrations in ppb during local times between 09:00 and 13:00 on the flights 000519, 000728, and 001203.
ACPD
3, 2661–2689, 2003 High aerosol concentrations in the upper troposphere over Africa J. Heintzenberg et al. Title Page Abstract Introduction Conclusions References Tables Figures J I J I Back Close Full Screen / EscPrint Version Interactive Discussion c EGU 2003
0
5000
10000
15000
20000
-30
-20
-10
0
10
20
30
40
50
N
12N
18N
4-12N
i(cm
-3, STP)
Latitude (deg.)
Fig. 6. (a) Latitudinal averages of number concentrations of aerosol particles larger than 4, 12,
and 18 nm diameter (Ni, cm −3
ACPD
3, 2661–2689, 2003 High aerosol concentrations in the upper troposphere over Africa J. Heintzenberg et al. Title Page Abstract Introduction Conclusions References Tables Figures J I J I Back Close Full Screen / EscPrint Version Interactive Discussion c EGU 2003
0
20
40
60
80
100
120
140
-30
-20
-10
0
10
20
30
40
50
%strat.
O
3CO
O
3, CO (ppb)
Latitude (deg.)
Fig. 6. (b) Latitudinal averages of CO, ozone, and percentage of flight time in the stratosphere