HAL Id: inserm-00536184
https://www.hal.inserm.fr/inserm-00536184
Submitted on 27 Jul 2012HAL is a multi-disciplinary open access archive for the deposit and dissemination of sci-entific research documents, whether they are pub-lished or not. The documents may come from teaching and research institutions in France or abroad, or from public or private research centers.
L’archive ouverte pluridisciplinaire HAL, est destinée au dépôt et à la diffusion de documents scientifiques de niveau recherche, publiés ou non, émanant des établissements d’enseignement et de recherche français ou étrangers, des laboratoires publics ou privés.
Cognitive determinants of social functioning after a first
ever mild to moderate stroke at vocational age.
Marc Hommel, Sandra Trabucco Miguel, Bernadette Naegele, Nicolas Gonnet,
Assia Jaillard
To cite this version:
Marc Hommel, Sandra Trabucco Miguel, Bernadette Naegele, Nicolas Gonnet, Assia Jaillard. Cogni-tive determinants of social functioning after a first ever mild to moderate stroke at vocational age.: cognition and social functioning after stroke. Journal of Neurology, Neurosurgery and Psychiatry, BMJ Publishing Group, 2009, 80 (8), pp.876-80. �10.1136/jnnp.2008.169672�. �inserm-00536184�
Cognitive determinants of social functioning after a first-ever mild
to moderate stroke at vocational age
Marc Hommel MD, 1, 3 Sandra Trabucco Miguel PhD, 1 Bernadette Naegele PhD, 1, 2 Nicolas Gonnet, 3 Assia Jaillard MD PhD 1, 2
1. Stroke Unit, University Hospital - Joseph Fourier University, Grenoble
2. Research Center, Grenoble Institute of Neuroscience Unit UMR_S Inserm UJF - CEA U 836 - GIN
3. INSERM CIC 003, University Hospital Grenoble
Corresponding author: Marc Hommel MD
Stroke Unit, University Hospital Grenoble BP 217 - 38043 Grenoble Cedex 9, France. Phone : (33) 476 76 57 89
Fax : (33) 476 76 56 31
E-Mail : [email protected]
Cover title: cognition and social functioning after stroke Tables: 3
Figure: 0
Abstract: 253 words Word count: 3239 words References: 42
Background and Purpose
Social functioning is impaired in about two third of stroke patients in vocational age, even several months after a first-ever mild to moderate stroke. The known predictors of social functioning were initial stroke severity, anxiety and depression and the Mini Mental State Evaluation, suggesting that cognitive deficits contribute to post-stroke social dysfunctioning. Our aim was to evaluate whether cognitive domains correlated with social functioning and to determine the cognitive predictors of social dysfunctioning.
Methods
We prospectively included 74 patients, 6 months after a first-ever stroke. NIHSS, modified Rankin scale, depression and anxiety were recorded. Social functioning was recorded using the Work and Social Adjustment Scale (WSAS). An extensive neuropsychological tests battery explored general cognitive functioning, episodic memory, instrumental functions, executive functions and working memory. Univariate comparisons assessed the relationships between the neuropsychological tests and the scores of the WSAS. Predicting factors of WSAS were determined using ordinal logistic regression.
Results
Fifty two patients (70%; 95%CI 58 – 80%) complained of significant perturbation of work and social functioning. In univariate comparisons, general cognitive functioning, memory, instrumental functions, executive functions and working memory significantly correlated with social functioning. Working memory was the most affected domain. With multivariate
modelling, the NIHSS at admission, Hospital Anxiety-Depression scale and Owen’s Spatial Working Memory test were independent predictors of WSAS.
Conclusions
All cognitive domains were associated with social functioning, working memory being the main cognitive determinant. Our results suggest that cognitive impairment impacts on social dysfunctioning, which is known to be a component of quality of life.
Major improvement in stroke prognosis has been achieved by stroke units implementation and increasing routine use of thrombolysis. Therefore, the frequency of patients with a good outcome is rising. Outcome is usually assessed in clinical trials and in routine clinical
practice, using the NIHSS score[1] for the neurological deficit and using the modified Rankin score (mRankin) [2] for the handicap. However, despite ratings considered as good outcomes, many patients fully independent in daily living activities still complain of difficulties in many domains of functioning[3, 4]. Edwards et al.[5] reported that as high as 87% of patients were complaining 6 months after a mild stroke of related changes in domains such as work, driving and recreational activities. Age and motor impairment were not predictors of life satisfaction. They suggested that mild strokes may suffer from different and more subtle neurologic impairment impacting in life satisfaction, than more severe stroke patients[5]. We have recently reported that about 2 out of 3 patients in vocational age complained of significant difficulties in social functioning months after a first-ever mild to moderate stroke.[6] Social functioning was associated with initial stroke severity measured using the NIHSS score at admission, depression and anxiety measured using Hospital Anxiety and Depression scale (HAD)[7] and Mini Mental State Examination (MMSE)[8] at study time, suggesting a role for cognitive impairment. However, the MMSE, which was designed as a diagnostic tool for the detection of dementia, may be inaccurate in detecting post stroke cognitive impairment.[9] Sensitive neuropsychological tests can detect performance below the norm in patients whose performance on MMSE is well within the normal range.[10] With a median of 29 (25%-75% inter-quartile 27-30), the MMSE of our population presented an obvious ceiling effect, giving an excessive weight to any error. The MMSE allows exploring orientation, working memory, verbal recall, comprehension-praxis and naming, which can be classified into three domains: working memory, episodic memory and instrumental functions.[11] However, executive functions are not examined, while they appear to be frequently impaired after stroke.[9] Therefore, the MMSE, as an explanatory variable of cognition, suffered from many pitfalls, the main one being an over simplified approach to cognition making difficult to determine which domains of cognition are mainly affected in relation to social dysfunctioning after stroke.
We had two purposes. Fist, in a heuristic approach to investigating the contribution of
cognition to social functioning, we correlated social functioning with a comprehensive battery of neuropsychological tests exploring all cognitive domains. Second, we wanted to test if after adjustment for the already established determinants depression and neurological deficit, some domain of cognition also contributes to social functioning in patients with a first ever mild to moderate stroke in vocational age.
METHODS AND SUBJECTS Inclusion criteria
Methods have been described in details elsewhere [6]. This prospective cohort included patients admitted consecutively to the stroke unit with a first-ever stroke providing they met the following criteria: a recent 6 ± 3 months stroke demonstrated on MRI, and a vocational age from 16 years to 65 years. To be included a score > 23/30 was required for the MMSE[8] to exclude patients with dementia or those who were not able to sustain the
whole set of tests. To be included, an mRankin scale ≤ 2 was chosen to exclude patients who had severe limitations of physical activities. Patients were not eligible if they
presented with transient ischemic attack, NIHSS > 4 at study time, severe aphasia, alexia, non-compensated hemianopia, neglect, decreased visual acuity, illiteracy, psychiatric disorder, symptomatic prior stroke or silent stroke on imaging, other neurological disease. The Medical Ethics Committee (CCPRB) of the institution approved the study. We obtained signed informed consent from all the subjects.
Clinical evaluation
Self-estimated work and social dysfunctioning was assessed with the WSAS[12], which explores five domains: ability to work, home management, social leisure, private leisure and ability to form and maintain close relationships with others. The WSAS is based on subject’s estimated capacities and resources and not on subject’s actual performance (“what I have done"). The consequences of an identified condition such as a stroke are assessed since each question begins by “because of my ‘condition x’ stroke my activity ‘y’ is impaired”. The five items of the WSAS were rated from 0 (no impairment) to 8 (very severely impaired), and the scores obtained for each item were summed in a total score. A score of 0 reflects normal functioning and a score of 40 the worst score possible. To be consistent with validation publications on the WSAS, we applied similar categorization of WSAS into 3 categories as those reported in other diseases. A score ≥ 20 suggested
moderately severe to severe impairment, from 10 to 19 significant dysfunctioning, and less than 10 a subclinical dysfunctioning.[12]
Neuropsychological Evaluation
To test cognitive contribution to social functioning, the patients underwent an extensive standardized neuropsychological battery. We evaluated handedness[13], and patients completed a battery of cognitive tests including
(1) Depression using Beck’s depression inventory[14] and hospital anxiety and depression scale (HAD)[7]
(2) Global cognitive functioning was assessed using MMSE[15], pattern matrices 1938 (PM 38)[16], and verbal automatisms[17]
(3) Memory: the Grober & Buschke[18, 19] and Pattern Recognition Memory (PRM) Cambridge neuropsychological test automated battery (CANTAB® )[20]
(4) Instrumental functions: visuo-spatial and visuo-constructive functions were assessed with the visual object and space perception battery (VOSPs)[21] and the bells test[22], graphomotor praxias, and language with the Lexis[23]
(5) Executive functions: the categorical and alphabetic fluency test[24], the Toronto Tower[25], and the Trail-Making Tests A and B (TMA and TMB) [26, 27] and STOOP color word test were used[28]
(6) Working memory was tested using the forward digit span from the Wechsler adult intelligence scale (WAIS-R) digit span subtest[29, 30], spatial span pattern of the
CANTAB® [20], backward digit span (WAIS 3), Paced Auditorial Serial Addition Test or PASAT[31, 32], Owen’s spatial working memory test (Owen SWM)[33] using the CANTAB® battery[20] and the visual patterns (2 scores) from CANTAB®.[20]
Brain imaging A 1.Tesla MRI was used to obtain DWI, T2 and FLAIR images with
5-mm thickness within the first week after stroke onset. A neurologist, who was unaware of clinical data, drew the stroke lesion to determine the stroke type, side, and arterial territory. This allowed discarding patients with prior strokes, silent strokes and leukoaraiosis.
Data and statistical analysis
Demographic, stroke related and neuropsychological variables were tested between the 3 severity categories of the WSAS. These ordinate categories provided a higher sensitivity to detect significant trends according to severity than binary comparisons. For univariate comparisons with WSAS, we used anova, chi-square test, Fisher's exact test, Kruskal-Wallis test and Cuzick’s test for trends when appropriate. We wished to be able to conclude about associations based on univariate comparisons. As we had 39 univariate variables to compare to WSAS, we corrected the level of significance with Sidak’s correction for 39 comparisons. Therefore, we considered significant the comparisons with a p-value lower than 0.0013.
We used ordinal logistic regression modelling to evaluate which cognitive domains were expressed by the WSAS. Ordinal logistic regression fits specifically to ordinal
categorization of the dependant variable, providing the proportional odds assumption is satisfied [34]. Moreover, it displays proportional odds ratio which have similarities with odds ratios from binary logistic regression. Considering its limitations, MMSE was not included in the model. All the other variables associated with WSAS at univariate analysis with level at p<0.2 were initially included and removed in a backward stepwise analysis. Were kept in the model the variables significant at p<0.05. The proportional odds assumption also called parallel regression assumption of the ordinal logistic model was assessed with Brant’s test.[35] Confidence intervals were computed using
bootstrapping[36] with 1500 replications. Statistical analyses were performed using STATA 10.1 (STATA Corp, College Station, Tex).
Results
We included 74 patients in the study.
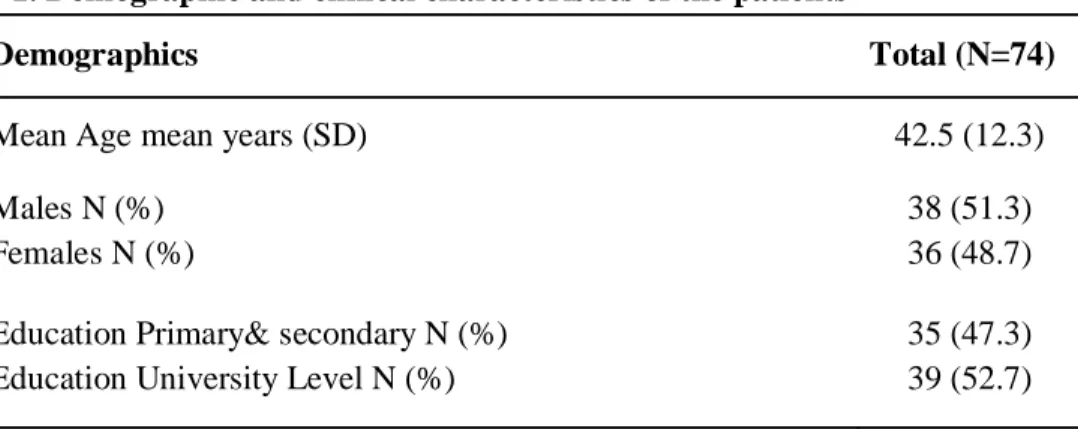
Demographic and clinical characteristics are reported in table 1.
Table 1. Demographic and clinical characteristics of the patients
Demographics Total (N=74)
Mean Age mean years (SD) 42.5 (12.3)
Males N (%) Females N (%)
38 (51.3) 36 (48.7) Education Primary& secondary N (%)
Education University Level N (%)
35 (47.3) 39 (52.7)
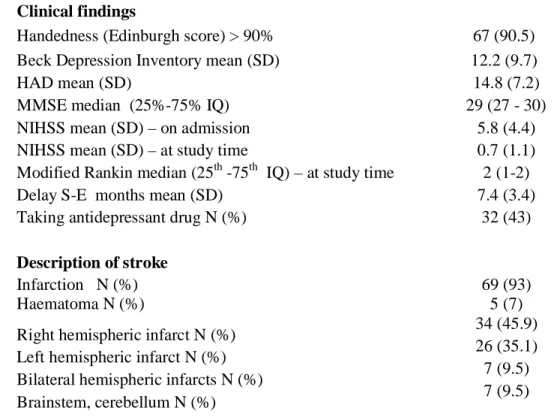
Clinical findings
Handedness (Edinburgh score) > 90% 67 (90.5)
Beck Depression Inventory mean (SD) 12.2 (9.7)
HAD mean (SD) 14.8 (7.2)
MMSE median (25%-75% IQ) 29 (27 - 30)
NIHSS mean (SD) – on admission 5.8 (4.4)
NIHSS mean (SD) – at study time 0.7 (1.1)
Modified Rankin median (25th -75th IQ) – at study time 2 (1-2)
Delay S-E months mean (SD) 7.4 (3.4)
Taking antidepressant drug N (%) 32 (43)
Description of stroke
Infarction N (%) 69 (93)
Haematoma N (%) 5 (7)
Right hemispheric infarct N (%) Left hemispheric infarct N (%) Bilateral hemispheric infarcts N (%) Brainstem, cerebellum N (%)
34 (45.9) 26 (35.1) 7 (9.5) 7 (9.5) NIHSS on admission: NIHSS at admission with acute stroke in the stroke unit; NIHSS at study time: NIHSS at inclusion in the study, mean 7.4 months after stroke; HAD: Hospital Anxiety and Depression scale; Delay S-E: Delay from stroke to evaluation; IQ: interquartile
Using the 3 scores categorisation of the WSAS, 22 patients had a WSAS score under 10 which means a subclinical score, 22 had a significant work and social dysfunctioning and 30 a moderately severe to severe impairment. So a total of 52 patients (70%; 95% CI 58% – 80%) complained of at least significant work and social dysfunctioning due to stroke. The univariate analysis with the 3 categories of the WSAS is reported in table 2.
Table 2. Univariate analysis of the WSAS determinants WSAS < 10 N=22 (29.7%) WSAS 10 to 19 N=22 (29.7%) WSAS ≥ 20 N=30 (40.6%) P-value Demographic characteristics Age mean (SD)A 40.3 (14.3) 40.5 (13.3) 45.7 (9.4) P=0.198 Gender male N (%)Chi2 13 (59.1) 13 (59.1) 12 (40.0) P=0.27 Education university N (%)Chi2 15 (38) 13 (33) 11 (28) P=0.06 Right HandednessN (%)F 20 (30) 20 (30) 27 (40) P=1 NIHSS on admission mean (SD)NP-t 4.6 (4.6) 5.7 (4.5) 6.6 (3.9) P=0.02
NIHSS at study timemean (SD)NP-t 0.3 (0.5) 0.8 (1.1) 1.0 (1.3) P=0.08 mRankinmean (SD) N P-t 1.1 (0.7) 1.7 (0.6) 1.7 (0.6) P=0.003 Delay S-Emean (SD)K-W 7.2 (3.5) 6.8 (3.2) 7.9 (3.6) P=0.67 AntidepressantsN (%)F 3 (9.4) 9 (28.1) 20 (62.5) P=0.001*
Side of strokeF P=0.83
Depression
HAD mean (SD) A 10.2 (5.3) 13.7 (5.4) 19.1 (7.4) P<0.000* HAD depression mean (SD)A 3.0 (2.3) 5.7 (3.2) 8.6 (3.8) P<0.000* HAD anxiety mean (SD)A 7.2 (3.5) 8.0 (3.5) 10.5 (4.3) P<0.007 Beck DImean (SD)K-W 6.6 (6.4) 10.6 (6.4) 18.0 (11.0) P=0.0002*
Global cognitive functioning
MMSEmean (SD)K-W 29.4 (0.7) 28.3 (1.7) 27.1 (2.5) P=0.003 PM38 mean (SD)A 110.2 (14.6) 99.3 (16.0) 91.1 (16.1) P=0.0002* Verbal automatismsmean (SD)K-W 107.3 (11.6) 111.5 (12.0) 101.8 (17.5) P=0.16
Memory
Grober & Buschke normalmean (SD)F 21 (95.4) 21 (95.4) 23 (76.7) P=0.20 PRM (CANTAB®)mean (SD)K-W 88.9 (17.0) 87.9 (11.7) 72.7 (19.0) P=0.0001*
Instrumental functions
VOSP spatialF mean (SD) 22 (100) 20 (91) 25 (83) P=0.28
VOSP constructNP-t N20 17 13 8 P<0.000*
Bells testN (%)F 22 (100.0) 20 (90.9) 30 (100.0) P=0.17 Graphomotor praxiaNP-t median
(0.25-0.75 IQ) 3 (3-3) 3 (2.5-3) 3 (3-3) P=0.11
Language F median (0.25-0.75 IQ) 78 (76-79) 79 (75-80) 77 (75-78) P=0.48
Executive functions
Categorical fluency mean (SD)A 32.1 (9.5) 27.3 (9.4) 24.2 (7.3) P=0.007 Alphabetic fluency mean (SD)A 21.4 (9.2) 20.5 (7.3) 18.4 (8.0) P=0.41 Toronto tower N normal N (%)F 20 (90.1) 14 (63.6) 19 (71.6) P=0.01 TMA mean (SD)K-W 33.3 (11.5) 36.9 (16.7) 57.5 (39.8) P=0.001* TMB mean (SD)K-W 70.3 (35.0) 88.4 (44.4) 141.6 (135.5) P=0.002 Stroop colormean (SD)K-W 65.1 (19.2) 66.0 (14.3) 77.9 (19.0) P=0.019 Stroop motormean (SD)NP-t 46.7 (10.6) 50.0 (10.5) 55.3 (15.8) P=0.039 Stroop inkmean (SD)NP-t 118.3 (41.9) 122.4 (39.7) 141.6 (42.8) P=0.01
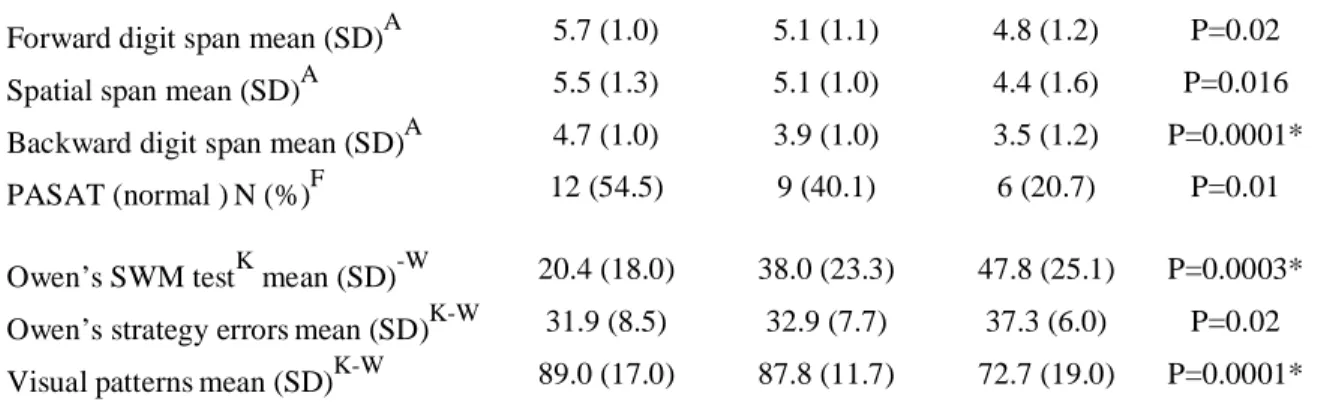
Forward digit span mean (SD)A 5.7 (1.0) 5.1 (1.1) 4.8 (1.2) P=0.02 Spatial span mean (SD)A 5.5 (1.3) 5.1 (1.0) 4.4 (1.6) P=0.016 Backward digit span mean (SD)A 4.7 (1.0) 3.9 (1.0) 3.5 (1.2) P=0.0001* PASAT (normal )N (%)F 12 (54.5) 9 (40.1) 6 (20.7) P=0.01 Owen’s SWM testK mean (SD)-W 20.4 (18.0) 38.0 (23.3) 47.8 (25.1) P=0.0003* Owen’s strategy errorsmean (SD)K-W 31.9 (8.5) 32.9 (7.7) 37.3 (6.0) P=0.02 Visual patternsmean (SD)K-W 89.0 (17.0) 87.8 (11.7) 72.7 (19.0) P=0.0001* Education university: Education university level; A: ANOVA; F: Fisher’s exact test; Chi2: Pearson’s Chi2;
NP-t
: Cuzick’s test for trends; K-W: Kruskal-Wallis; N20 Number of patients with the highest score of 20 in the VOSP construct; 0.25-0.75 IQ 0.25-0.75 interquartile range; Spatial WM Owen’s test: Owen’s spatial working memory test; * significant test with Sidak’s correction for 39 comparisons.
With ordinal logistic regression, the Brant test confirmed that parallel regression assumption also known as the proportional odds assumption was respected (Chi2=0.75; p>0.86). Three variables were selected in the model, NIHSS at admission, HAD and Owen’s SWM test (Table 3).
Table 3. Ordinal logistic model of the 3 variables predicting WSAS
Odds Ratio
Bootstrap
Std. Err. P>|z| 95% Conf. Interval
NIHSS Day 1 1.17 0.09 0.036 1.01 1.36
Owen’s SWM 1.04 0.01 0.003 1.01 1.06
HAD 1.25 0.09 0.001 1.09 1.43
NIHSS Day 1: NIHSS at admission; HAD: Hospital Anxiety and Depression scale; Spatial WM Owen’s test: spatial working memory Owen’s test
Interpretation of odds ratios in ordinal logistic regression is close to binary logistic regression. For example, for an increase of 1 point in the NIHSS going from 0 to 1, the odds from a lower WSAS category compared with a higher category are changed by a factor 1.17, holding all other variables constant.[34]We tested a possibility of interaction between Owen’s SWM and the level of education in the ordinal logistic model. The interaction did not reach statistical significance (P=0.09), the patients with a low level of education were more severely affected than those with a high level.
Discussion
As high as 70% (95% CI 58% – 80%) of our patients complained of significant impairment in work and social functioning. Each category of WSAS was evenly represented. In univariate comparisons between the different tests of each cognitive domain and the 3 categories of the WSAS (table 2). As we corrected with a conservative method the p-value threshold according to the number of comparisons, the results of the univariate analysis can be considered as
robust. All the cognitive domains, global cognitive functioning (PM38), memory (PRM - CANTAB®), instrumental functions (VOSP), executive functions (TMA) and working memory (backward digit span, Owen’s SWM test, visual patterns) were significantly associated to WSAS in at least one of their test. However, considering globally all the univariate comparisons, it may be stressed that depression and working memory were the main domains associated with WSAS. To our knowledge, it is the first time that such a clear contribution of cognition to social functioning has been shown. Moreover, it highlights the impact of cognition deficits in a subset of patients suffering a first ever mild to moderate stroke and in vocational age, representing the subset of the youngest stroke patients with a good outcome.[6]
When adjusting for initial stroke severity and depression with ordinal logistic regression, Owen’s spatial working memory test significantly contributed to WSAS (table 3). Working memoryrefers to the processes acting as “a system for temporary holding” and the
manipulation of this information ‘that operates on the contents of storage’[37] as part of a wide range of essential cognitive abilities, such as reasoning, planning and spatial processing. When considering the relation between MMSE and working memory, it has to be stressed that the most often failed item in MMSE was backward counting which obviously carries some working memory component.[11, 38]
It could be supposed that working memory was mainly impaired in patients with a pre morbid high order of functioning characterizing the sub population with pre morbid high percentiles in neuropsychological evaluations, usually associated with high educational levels. This sub group may be more sensitive to any deficit. However, when testing interaction between Owen’s SWM and educational level, we only found a trend toward significance, the low order functioning patients i.e. those with a low educational level, tended to be more affected. It has to be stressed that neuropsychological tests grading is adjusted to age and educational level, likely contributing to the absence of definite statistical significance. Furthermore, it can be supposed that a spatial test is less sensitive to educational training than a verbal one, and therefore is more appropriate for detecting abnormalities over the whole range of functioning. One can argue that concentration deficit or fatigue caused poor performance on
neuropsychological tests, working memory deficit being a confounder. However, it would be hard to defend that fatigue or loss of concentration may cause so predominantly working memory deficits. Moreover, the items of Beck’s depression inventory that relate to
concentration deficits (p=0.21) and fatigue (p=0.63) were not correlated to Owen’s SWM test, suggesting a direct relationship between social functioning and working memory impairment. The association between leucoaraïosis and executive functions impairment has been
demonstrated in many studies.[39, 40] The inclusion criteria of the study were stringent and we did not include patients with silent strokes or other cerebral diseases and the selection was based on T2, FLAIR and DWI MRI for all the patients. Therefore, patients with leucoaraïosis were not present in our population. Furthermore, our stroke population was in vocational age, had a mean age of 42.5 years and only 2 patients were older than 60 years. Therefore, our results cannot be biased by a confounder such as leucoaraïosis.
Our study confirms the high risk of cognitive impairment after mild stroke. However, as a complementary study to others[41] it also stresses that non focal deficits are major
contributors to cognitive impairment. This study shows that work and social functioning after a mild to moderate stroke receives contributions from initial neurological severity, mood and within cognitive functions a special contribution from working memory. To improve social functioning, treatments and trials focused on neurological deficit, mood and within cognitive rehabilitation, those focused on working memory training[42] may become of major
be inferred that cognition impairment, especially working memory impairment, represents a major contributor to quality of life in stroke patients.
Acknowledgments
This study was supported by a grant of the DRCI of the University Hospital of Grenoble VASCO 2004.
This study was supported by academic funding only. None of the authors has conflict of interest.
References
[1] Brott, T., Adams, H. P., Jr., Olinger, C. P., Marler, J. R., Barsan, W. G., Biller, J., Spilker, J., Holleran, R., Eberle, R., Hertzberg, V., Rorick, M., Moomaw, C. and Walker, M. Measurements of acute cerebral infarction: a clinical examination scale. Stroke 1989; 20:864-870.
[2] van Swieten, J. C., Koudstaal, P. J., Visser, M. C., Schouten, H. J. and van Gijn, J. Interobserver agreement for the assessment of handicap in stroke patients. Stroke 1988;
19:604-607.
[3] Duncan, P. W., Samsa, G. P., Weinberger, M., Goldstein, L. B., Bonito, A., Witter, D. M., Enarson, C. and Matchar, D. Health status of individuals with mild stroke. Stroke 1997;
28:740-745.
[4] Lai, S. M., Studenski, S., Duncan, P. W. and Perera, S. Persisting consequences of stroke measured by the Stroke Impact Scale. Stroke 2002; 33:1840-1844.
[5] Edwards, D. F., Hahn, M., Baum, C. and Dromerick, A. W. The impact of mild stroke on meaningful activity and life satisfaction. J Stroke Cerebrovasc Dis 2006; 15:151-157. [6] Hommel, M., Trabucco-Miguel, S., Joray, S., Naegele, B., Gonnet, N. and Jaillard, A. Social dysfunctioning after mild to moderate first-ever stroke at vocational age. J. Neurol.
Neurosurg. Psychiatry 2008; published online 14 Nov 2008
[7] Zigmond, A. S. and Snaith, R. P. The hospital anxiety and depression scale. Acta
Psychiatr Scand 1983; 67:361-370.
[8] Folstein, M., Folstein, S. and McHugh, P. Mini-Mental State : A practical method for grading the cognitive state of patients for the clinician. Journal of Psychiatric Research 1975;
12:189-198.
[9] Nys, G. M., van Zandvoort, M. J., de Kort, P. L., Jansen, B. P., Kappelle, L. J. and de Haan, E. H. Restrictions of the Mini-Mental State Examination in acute stroke. Arch Clin
Neuropsychol 2005; 20:623-629.
[10] de Jager, C. A., Milwain, E. and Budge, M. Early detection of isolated memory deficits in the elderly: the need for more sensitive neuropsychological tests. Psychol Med 2002; 32:483-491.
[11] Banos, J. H. and Franklin, L. M. Factor structure of the Mini-Mental State Examination in adult psychiatric inpatients. Psychol Assess 2002; 14:397-400.
[12] Mundt, J. C., Marks, I. M., Shear, M. K. and Greist, J. H. The Work and Social Adjustment Scale: a simple measure of impairment in functioning. Br J Psychiatry 2002;
180:461-464.
[13] Oldfield, R. C. The assessment and analysis of handedness: the Edinburgh inventory.
Neuropsychologia 1971; 9:97-113.
[14] Aben, I., Verhey, F., Lousberg, R., Lodder, J. and Honig, A. Validity of the beck depression inventory, hospital anxiety and depression scale, SCL-90, and Hamilton depression rating scale as screening instruments for depression in stroke patients.
Psychosomatics 2002; 43:386-393.
[15] Dérouesné, C., Poitreneau, J., Hugonot, J., Kalafat, M., Dubois, B. and Laurent, B. Au nom du groupe de Recherche sur les Evaluations Cognitives (GRECO). Le Mini-Mental State Examination (MMSE) : un outil pratique pour l'évaluation de l'état cognitif des patients par le clinicien. Version française consensuelle. Press Med 1999; 28:1141-1148.
[16] Raven, J., Raven, J. C. and Court, J. H. Test des matrices progressives de Raven
[17] Beauregard, M., Chertkow, H., Gold, D., Karama, S., Benhamou, J., Babins, L. and Faucher, A. Word priming with brief multiple presentation technique: preservation in amnesia. Neuropsychologia 1997; 35:611-621.
[18] Grober, E., Buschke, H., Crystal, H., Bang, S. and Dresner, R. Screening for dementia by memory testing. Neurology 1988; 38:900-903.
[19] Van der Linden, M., Coyette, F., Poitrenaud, J., Kalafat, M., Calicis, F., Wyns, C. and Adam, S. L'épreuve de rappel libre et de rappel indicé à 16 items. In: Evaluation des troubles
de la mémoire. (Ed M. Van der Linden). Solal, Marseille (France). 2004.
[20] Sahakian, B. J. and Owen, A. M. Computerized assessment in neuropsychiatry using CANTAB: Discussion paper. Journal of the Royal Society of Medicine 1992; 85:399-402. [21] Warrington, E. K. and James, M. (Eds) The Visual Object and Space Perception
Battery, Thames Valley Test Company, Bury St Edmunds, 1991.
[22] Gauthier, L., Dehaut, F. and Joannette, Y. The bells test: a quantitative and qualitative test for visual neglect. Int J Clin Neuropsychol 1989; 11:49-54.
[23] de Partz , M.-P., Bilocq, V., de Wilde, V., Séron, X. and Pillon, A. (Eds) LEXIS. Tests
pour le diagnostic des troubles lexicaux chez le patient aphasique., Solal, Marseille (France),
2002.
[24] Cardebat, D., Doyon, B., Puel, M., Goulet, P. and Joanette, Y. Evocation lexicale et sémantique chez les sujets normaux. Performances et dynamique de production en fonction du sexe, de l'âge et du niveau d'étude. Acta Neurologica Belgica 1990; 90:207-217.
[25] Saint Cyr, J. A. Tour de Toronto. Procedural learning and neostriatal dysfunction in man. Brain 1982; 111:941-959.
[26] Army Individual Test Battery Manual of Directions and Scoring, War Department, Adjudant General Office, Washington DC, 1944.
[27] Giovagnoli, A. R., Del Pesce, M., Mascheroni, S., Simoncelli, M., Laiacona, M. and Capitani, E. Trail making test: normative values from 287 normal adult controls. Ital J Neurol
Sci 1996; 17:305-309.
[28] Meulemans, T. L’évaluation des fonctions exécutives. In: Fonctions exécutives et
pathologies neurologiques (Ed O. G. e. G. (Eds.)). Solal, Marseille, 2008: pp. 179-229.
[29] Wechsler, D. Wechsler Adult Intelligence Scale-Revised Manual, Éditions du Centre
de Psychologie Appliquée, Paris, 1981.
[30] Baddeley, A. Working memory and language: an overview. J Commun Disord 2003;
36:189-208.
[31] Gronwall, D. Paced Auditory Serial-Addition Task : A measure of recovery from concussion. Perceptual and Motor Skills 1977; 44:367-373.
[32] Naegele, B. and Mazza, S. Paced auditory serial-addition test. Une version française, Solal, Marseille, 2003.
[33] Owen, A. M., Downes, J. J., Sahakian, B. J., Polkey, C. E. and Robbins, T. W. Planning and spatial working memory following frontal lobe lesions in man.
Neuropsychologia 1990; 28:1021-1034.
[34] Long, J. C. and Freese, J. Regression models for categorical dependent variables
using stata, StataCorp LP, College Station, Texas, 2006.
[35] Brant, R. Assessing proportionality in the proportional odds model for ordinal logistic regression Biometrics 1990; 46:1171-1178.
[36] Poi, B. From the help desk: some bootstrapping techniques. Stata Journal 2004;
4:312-328.
[37] Baddeley, A. Working Memory, Oxford University Press, Oxford, 1986.
[38] Han, S. H. and Kim, M. S. Visual search does not remain efficient when executive working memory is working. Psychol Sci 2004; 15:623-628.
[39] Leys, D., Henon, H., Mackowiak-Cordoliani, M. A. and Pasquier, F. Poststroke dementia. Lancet Neurol 2005; 4:752-759.
[40] Libon, D. J., Price, C. C., Giovannetti, T., Swenson, R., Bettcher, B. M., Heilman, K. M. and Pennisi, A. Linking MRI hyperintensities with patterns of neuropsychological impairment: evidence for a threshold effect. Stroke 2008; 39:806-813.
[41] Srikanth, V. K., Thrift, A. G., Saling, M. M., Anderson, J. F., Dewey, H. M., Macdonell, R. A. and Donnan, G. A. Increased risk of cognitive impairment 3 months after mild to moderate first-ever stroke: a Community-Based Prospective Study of Nonaphasic English-Speaking Survivors. Stroke 2003; 34:1136-1143.
[42] Westerberg, H., Jacobaeus, H., Hirvikoski, T., Clevberger, P., Ostensson, M. L., Bartfai, A. and Klingberg, T. Computerized working memory training after stroke--a pilot study. Brain Inj 2007; 21:21-29.