HAL Id: hal-03036514
https://hal.uca.fr/hal-03036514
Submitted on 2 Dec 2020
HAL is a multi-disciplinary open access archive for the deposit and dissemination of sci-entific research documents, whether they are pub-lished or not. The documents may come from teaching and research institutions in France or abroad, or from public or private research centers.
L’archive ouverte pluridisciplinaire HAL, est destinée au dépôt et à la diffusion de documents scientifiques de niveau recherche, publiés ou non, émanant des établissements d’enseignement et de recherche français ou étrangers, des laboratoires publics ou privés.
Bounding Surface Modeling of Compacted Silty Sand
Exhibiting Suction Dependent Post-peak Strain
Softening
Ujwalkumar Patil, Laureano Hoyos, Mathilde Morvan, Anand Puppala
To cite this version:
Ujwalkumar Patil, Laureano Hoyos, Mathilde Morvan, Anand Puppala. Bounding Surface Modeling of Compacted Silty Sand Exhibiting Suction Dependent Post-peak Strain Softening. International Journal for Numerical and Analytical Methods in Geomechanics, Wiley, 2018, 42 (14), pp.1741-1761. �hal-03036514�
Bounding Surface Modeling of Compacted Silty Sand Exhibiting
1Suction Dependent Post-peak Strain Softening
23 4
Ujwalkumar D. Patil1, Laureano R. Hoyos2, Mathilde Morvan3 and Anand J. Puppala4
5 6
SUMMARY
7
This article focuses on modeling the strain hardening-softening response of statically compacted
8
silty sand as observed from a comprehensive series of suction-controlled, consolidated-drained
9
triaxial tests accomplished in a fully-automated, double-walled triaxial test system via the
axis-10
translation technique. The constitutive model used in this work is based on the theory of
11
Bounding Surface (BS) plasticity, and is formulated within a critical state framework. The
12
essential BS model parameters are calibrated using the full set of triaxial test results and then
13
used for predictions of compacted silty sand response at matric suction states varying from 50 to
14
750 kPa. Complementary simulations using the Barcelona Basic Model (BBM) have also been
15
included, alongside BS model predictions, in order to get further enlightening insights into some
16
of the main limitations and challenges facing both frameworks within the context of the
17
experimental evidence resulting from the present research effort. In general, irrespective of the
18
value of matric suction applied, the BBM performs relatively well in predicting response at peak
19
1
Faculty Research Associate (Corresponding Author), Department of Civil Engineering, University of Texas at Arlington, Arlington, Texas 76019. E-mail: [email protected]
2
Professor, Department of Civil Engineering, University of Texas at Arlington, Arlington, Texas 76019. E-mail: [email protected]
3
Assistant Professor, Clermont Université, Université Blaise Pascal, Institut Pascal, BP 10448, F-63000 Clermont-Ferrand , CNRS, UMR 6602, Institut Pascal, F-63171 Aubière, France. E-mail:
4
and critical state failure under low net confining pressure while the BSM performs relatively well
20
under high net confining pressures.
21
Keywords: unsaturated soil, matric suction, triaxial testing, dilatancy, strain-softening,
22
elastoplasticity
23 24
1. BACKGROUND AND SCOPE
25
Over-consolidated and compacted silty sand type soil upon shearing are most likely to
26
manifest the strain-induced post-peak softening along with the suction-induced dilatational
27
volume change. Strain softening in saturated soil during shearing has been attributed to either
28
damage to the soil structure, i.e. localization, or to the dilation, i.e. increase in volume [1].
29
However, hydro-mechanical response of unsaturated soil becomes complicated due to
multi-30
phase interaction between air-solids, water-solids and air-water interface within void space of the
31
soil skeleton. The variation of pressure difference across air-water interface at grain point contact
32
varies with degree of saturation and contributes largely to hydro-mechanical response of soil,
33
provided the water phase is continuous.
34
However, at high suction, i.e. beyond residual suction, the water phase is no longer
35
continuous and hence the same cannot hold true. Key data set on stress-strain response,
36
especially the one obtained via suction-controlled triaxial testing, not only plays a crucial role in
37
accurate assessments of unsaturated soil strength-deformation but is also essential in subsequent
38
validation of predictive models. The experimentally validated model could further be
39
incorporated within finite element codes to study complex soil-structure interaction of man-made
40
structures.
Alonso et al. [2] extended the classic Cam-Clay model to unsaturated soils based on
42
critical state framework and could explain the wetting induced collapse phenomenon along with
43
being able to reasonably simulate the compressive volume change and strain-hardening type
44
triaxial response. Since then, despite efforts by many researchers in fine tuning and improving
45
this seminal model, none of them have been able to successfully reproduce the strain-induced
46
softening and the stress-induced dilatancy observed in heavily overconsolidated soils when
47
compacted and tested under unsaturated state.
48
Bounding Surface (BS) plasticity theory was initially developed to simulate plasticity in
49
metals [3] and was soon extended to different geomaterials such as cohesive soils [4‒6]; sands
50
[7, 8]; pavement base materials [9]; geosynthetic reinforced material [10, 11]; concrete [12]; and
51
rockfill materials [13, 14]. The BS theory underwent further simplification and refinement by
52
several researchers [5‒7, 15‒19].
53
Bardet [7] introduced a comprehensive BS framework for soils, including nine material
54
constants, and was quite successful in reproducing the complex post-peak strain softening and
55
dilatational response of dry and saturated sands under conventional triaxial stress paths.
56
However, unsaturated soil behavior differs from that of saturated soil because of the presence of
57
a contractile air-water interphase across which a pressure balance is created between the pore-air
58
and pore-water phases within the soil matrix, also known as matric suction [20]. Extensive
59
experimental evidence has clearly demonstrated the paramount influence of matric suction on the
60
stress-strain-strength response of unsaturated soils.
61
Russell and Khalili [21] were among the first to extend the BS plasticity theory to
62
unsaturated soils within a critical state framework using concept of effective stress and taking
63
into account the particle crushing associated with shearing. The model was calibrated using
results from triaxial compression tests on speswhite kaolin reported by Wheeler and Sivakumar
65
[22], as well as triaxial compression and oedometric tests on kurnell sand with no fines reported
66
by Russell [23].
67
More recently, Morvan et al. [24] presented an extension of Bardet’s [7] original BS
68
framework with the aim of simulating post-peak softening of unsaturated soils using 12
69
constitutive parameters. The extended BS framework allowed them to reproduce, with
70
reasonable accuracy, all the following: 1) increase in shear strength with increasing suction; 2)
71
volumetric collapse or slight rebound upon wetting, depending on mean stress level; and 3)
post-72
peak softening and gradual transition from contractant to dilatant nature of volume change
73
during continuous shearing. However, the calibration and validation of the extended BS
74
framework have been based on a limited set of experimental data obtained from
suction-75
controlled triaxial tests on dense Kurnell sand [23], Jossigny silt [25], and Speswhite Kaolin [26,
76
27]. These limited studies suggest a need for additional experimental evidence on different types
77
of soils, particularly heavily overconsolidated soils, for a more thorough and conclusive
78
validation of the extended BS framework, a chief motivation for the present work.
79 80 2. EXPERIMENTAL PROGRAM 81 2.1. Test Material 82
The soil used in the present work is an intermediate geomaterial, hence neither a perfect sand, silt
83
or clay, and tested in a very dense state, thus making it a suitable material to assess the suitability
84
of the extended BS framework introduced by Morvan et al. [24] for overconsolidated,
cohesive-85
frictional soils.
The test material used is classified as a poorly graded silty sand (SM) with clay, according to the
87
Unified Soil Classification System (USCS), with a standard proctor dry density of 1.87 g/cm3,
88
optimum water content of 12.2% and specific gravity of soil solids, Gs = 2.67. It is well known
89
that the structure and fabric of a test specimen gets altered by the type of compaction method and
90
hence tends to influence the subsequent shear response. In the present work, a stress-controlled
91
approach was used to produce compacted specimen with an artificially induced
over-92
consolidated stress history. Target density of approximately 1.87g/cm3, corresponding to +2%
93
wet of Proctor optimum, was achieved by compacting each specimen in nine equal lifts, each lift
94
being axially stressed in a split mold to a maximum vertical stress equal to 1600 kPa. The
95
specimen produced had initial voids ratio varying between 0.46-0.48 and approximate air entry
96
value between 8-10 kPa [28].
97 98
2.2 Experimental Variables 99
Strength tests were conducted using a fully-automated double-walled triaxial test equipment that
100
accommodates the essential modifications for unsaturated soil testing, including high-air-entry
101
(HAE) ceramics in the bottom pedestal; pore-water pressure control; pore-air pressure supply via
102
the top cap; and diffused-air flushing assembly, as shown in Fig. 1. A panoramic view of the
103
entire test set-up is shown in Figure 2.
104
A comprehensive series of saturated and unsaturated consolidated drained (CD) triaxial
105
tests on statically compacted silty sand specimens was performed. The axis-translation technique
106
was used to impose and control matric suction in the range of 0 to 750 kPa (s = 0, 50, 250, 500
107
and 750 kPa). Three net confining pressures, (σ3 – ua) = 100, 200 and 300 kPa, were applied.
108
Detailed protocols on soil preconditioning, pore-fluid equalization, s-controlled isotropic loading
and monotonic shear loading, capability of test equipment to replicate test results and other test
110
related methodology are described by Patil [28].
111 112
3. SILTY SAND RESPONSE FROM SUCTION-CONTROLLED TRIAXIAL TESTING
113
3.1. Effect of Net Confining Pressure at Constant Matric Suction 114
Test results from suction-controlled CTC (Conventional triaxial compression) tests under
115
constant matric suction, s = 250 kPa, and under three net confining pressures, (σ3 – ua) = 100,
116
200 and 300 kPa, are shown in Figure 3. A negative sign in the volumetric strain response
117
represents dilating volume change, while a positive sign indicates compressive type behavior.
118
The convention used to designate the specimen is CDx-y where “CD” denotes the consolidated
119
drained test; “x” represents the net confining pressure (σ3 – ua), while “y” represents the imposed
120
constant suction (s).
121
As expected, Figure 3(a) clearly indicates an increase in stiffness (initial and subsequent
122
tangent modulus), as well as brittleness, with increasing confinement. Post-peak reduction in
123
deviator stress, also known as strain-softening type behavior, was also observed. Moreover, an
124
increase in net confinement pressure is expected to cause higher compression of the specimen
125
and hence suppress the amount of dilation. This is clearly manifested in Figure 3(b), where
126
dilation is significantly suppressed with an increase in confining pressure from 100 to 300 kPa.
127
Such type of stress-strain and volume change response are typical of relatively dense and
128
overconsolidated soils, as is the case of statically compacted silty sands [21, 29]. On the other
129
hand, triaxial tests performed on saturated specimens of compacted silty sand (s = 0) resulted in
130
compressive type behavior. Similar response was observed by previous researchers [21, 30‒33].
131 132
3.2. Effect of Matric Suction at Constant Net Confining Pressure 133
Results from suction-controlled CTC tests conducted on compacted silty sand specimens, under
134
varying matric suction states, s = 0, 50, 250, 500, and 750 kPa, and constant net confining
135
pressure, (σ3 – ua) = 100, are shown in Figure 4. In these figures, the change from
strain-136
hardening type behavior, as seen in saturated specimens (s = 0), to strain-softening type
137
response, due to the introduction of matric suction in all unsaturated specimens, is readily
138
manifest. The amplitude of strain-softening increases and the specimen fails at lower axial strain,
139
while taking less axial strain to reach critical state, with increasing matric suction, as shown in
140
Fig. 4(a).
141
Figure 4(b) shows a rather drastic change in volumetric response, from compressive to
142
dilational type behavior, with the imposition of a matric suction of magnitude as low as 50 kPa.
143
Matric suction tends to increase the initial stiffness and the apparent cohesion between individual
144
soil particles so that the particles all together during shearing tend to ride over one another
145
instead of undergoing slippage, resulting in an increase in volume (i.e. dilation). However, the
146
rate of dilation decreases as the air-water menisci gets destroyed with continued shearing beyond
147
peak stress, and the specimens get softened back to critical state, at which point they are
148
expected to exhibit only shear deformations (plastic flow) without further change in strength or
149
volume. All the test specimens were observed to develop multiple shear bands while
150
simultaneously bulging at the center as the shearing continued [28].
151
In addition, experimental results indicate that an increase in matric suction has more
152
influence on peak shear stress than on critical shear stress. Continued shearing beyond peak
153
shear stress tends to weaken and subsequently destroy the matric suction effect around soil grains
154
due to perturbation caused to air-water menisci interface. This phenomenon can be attributed to
the observed experimental softening of stress, the amplitude of which depends largely on the
156
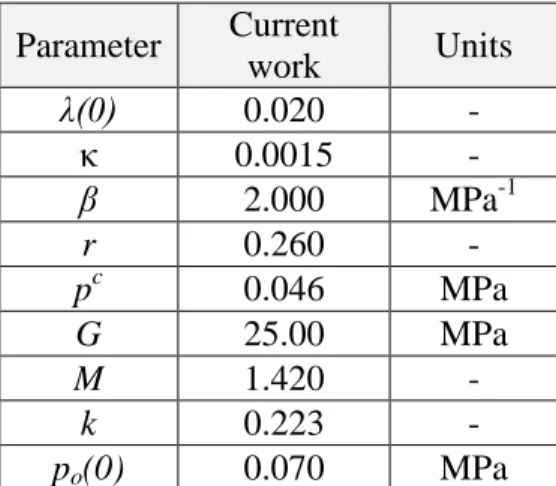
magnitude of suction imposed, ultimately resulting in peak strength being more affected by
157
matric suction than by critical or large strain strength.
158 159
4. CONSTUTIVE MODELING OF OVERCONSOLIDATED SILTY SAND RESPONSE
160
4.1. Bounding Surface Model: General Framework 161
The original framework of the Bounding Surface Model (BSM), particularly the one introduced
162
by Morvan et al. [24] for unsaturated soils, has proved reasonably efficient in modeling both
163
compressive volumetric response and strain-induced hardening. These behaviors are typically
164
observed in normally and lightly overconsolidated soils. However, this BSM framework also has
165
the potential to reproduce dilational volumetric response and strain-induced softening that are
166
typically observed in heavily overconsolidated soils subjected to suction-controlled monotonic
167
shearing. Furthermore, it is possible with BSM to capture the gradual transition between elastic
168
and elasto-plastic soil response. The chief motivation for present work was to finetune and refine
169
the original BSM to predict the stress-strain and volume change response and compare it with the
170
one obtained via suction-controlled triaxial testing from present research. Since the tests to be
171
modeled are performed at constant suction and the volumetric variations of the sample are low,
172
we chose not to use the fully coupled version taking into account water retention curve hysteresis
173
and its dependency on void ratio.
174 175
4.2. Effective Stress: Definition and Radial Mapping 176
The effective stress, σʹ, is expressed in terms of the equivalent pore pressure, π, as defined by
177
Pereira et al. [34], and hence is given as follows:
As previously mentioned, the model introduced by Morvan et al. [24] to simulate unsaturated
179
soil response is essentially an extension of the BS model postulated by Bardet [7] for saturated
180
soils, and hence is based on the bounding surface theory within a critical state framework.
181
Therefore, due consideration is given to the existence of a limit state line (LSL) in the pʹ, q plane
182
that defines an upper bound to the stress ratio ηp = q/pʹ, as illustrated in Fig. 5. The plastic 183
modulus is forced to be dependent on the distance δ between the current stress state σʹ and its
184
image-point, σ obtained by projection on the distance δ between the current stress state σʹ and its
185
image-point, obtained by projection on a surface called bounding surface, as shown in Figure 5.
186
Radial mapping technique [7], also illustrated by Yu [29], is used to define the
image-187
point σ ʹ of the actual stress σʹ on the bounding surface BS, via a translation vector, by extending
188
the line linking the origin to the point σʹ until it cuts the bounding surface (Fig. 5). Further details
189
on the classic BS formulation have been presented by Dafalias and Herrmann [5], Crouch et al.
190
[35], Manzari and Dafalias [36], Russell and Khalili [21], and Yu [29].
191 192
4.3. BSM Framework in Triaxial Stress Space 193
Classic triaxial test variables are used for cylindrical symmetry and triaxial stress space to define
194
the mean net stress (pʹ), deviatoric stress (q), peak state line (PSL) slope (ηp), and critical state 195
line (CSL) slope (M), which are expressed as follows:
196
Different variables/parameters used are defined in the list of symbols at the end of paper. In this
197
work, peak state line (PSL) is used exchangeable to limit sate line (LSL), as shown in Fig. 5. A
198
third line, identified as the characteristic state line (CL), which marks a transition from
199
contractant to dilatant volume change behavior during initial stages of shear loading, is also
200
postulated.
201
The conjugated variables in pʹ, q plane is volumetric and deviatoric strains, εp and εq, 202
which are respectively defined as follows:
203
The total strain is assumed to be divided into elastic and plastic parts:
204
The BS yield function represents an ellipse-shape yield surface in pʹ:q plane (Fig. 5), beyond
205
which plastic compression occurs on account of increased stress or decreased suction, and is
206 defined as follows: 207 The stress image obtained by the radial mapping, as shown in Fig. 5, can be defined as follows:
208
Employing the regular concept and the definitions of plastic multiplier ζ and plastic modulus Hb, 209
the following can be established:
210
The gradient of f contains 3 terms, i.e. the partial derivatives with respect to p ʹ, , and s: 211 After few simplifications, the 3 components of the exterior normal at the image-point can be
212 expressed as follows: 213 When the stress point is on the bounding surface, the plastic modulus is given by:
214
where ĸ is the volumetric deformability and e0 is the initial void ratio. On the other hand, if the 215
stress point lie within the bounding surface, an additional term Hf is added to Hb. The plastic 216
modulus H is then expressed as follows:
217
Hf is related to the plastic modulus H by the distance δ between the current stress state σʹ and its 218
projected image-point σ ʹ on the bounding surface, as illustrated in Fig. 5, and is expressed as
219 follows: 220
Inclusion of hardening of the unsaturated soil due to an increase in matric suction and
222
plastic volumetric strains is essential for the development of a consistent hardening rule. The
223
plastic flow is assumed to take the same direction as the onset of yielding by adopting an
224
associative flow rule relating the incremental plastic components of volumetric and shear strains,
225
which are expressed as follows:
226
while the elastic strains are defined by the classic relations:
227 where ν is the poisson’s ratio.
228
Considering the present experimental data, the suction-dependence of Aπ can be 229
expressed as follows:
230
where, Sr is the degree of saturation. In order to ensure continuity at full saturation state and be 231
able to reproduce wetting induced collapse curve, the following conditions must be satisfied:
232
The slope of CSL in the e-log pʹ plane is assumed to be identical to that of the normal
233
compression line (NCL) at constant suction, and is defined as follows:
234
235
4.4. Essential BSM Constitutive Parameters 236
The modified BS model postulated in the present work requires 12 material parameters, 8 of
237
which are necessary to define the behavior at full saturation: (1) Two elastic constants, ν and ĸ;
238
(2) Six constants for plastic behavior, out of which three are required to determine the position
239
and the shape of the bounding surface ρ, M and A0, two for the plastic modulus, ηp and h0, and 240
one for the volumetric compressibility, λ0.Four other constants are needed to account for suction: 241
(1) Two constants, se and α, to define the water retention curve, information required to 242
determine the equivalent pore pressure so that the effective stress can be obtained; (2) One
243
constant, k1, to account for suction effects on the hardening parameter Aπ, and (3) the last one, k3, 244
to define the function λ(s).
245
Systematic calibration procedure was followed to extract BS model parameters for
246
compacted silty sand from conducted experiments. First, the parameters se and α are needed to be 247
able to obtain effective stress. To achieve this, water retention curve in term of degree of
248
saturation is used. These parameters are those given by Brooks and Corey [37]. M and ηp that 249
define critical state and limit state are determined by plotting results of saturated triaxial tests in
250
pʹ,q plane. Volumetric stiffness λ(s) was obtained byplotting isotropic tests results in e-log pʹ
251
plane, which is necessary to obtain the initial value λ0, and its variation with suction (k3). The 252
variation of Aπ with suction is determined using loading collapse curves. 253
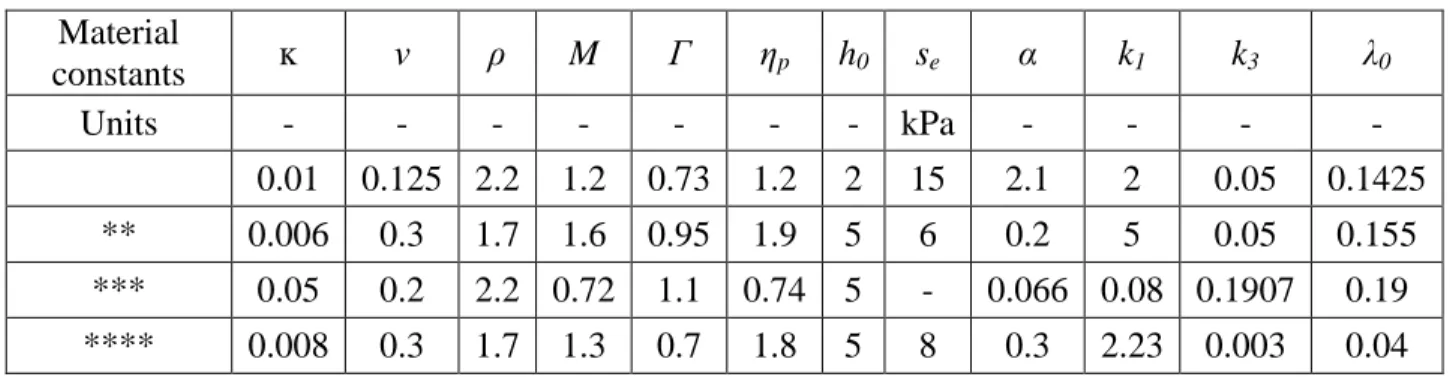
Only a few types of compacted geomaterials have been reported as being modeled with
254
the BS framework as summarized in the above sections. Table 1 summarizes the values of all
255
essential BS model parameters calibrated by previous researchers, along with those from present
256
research. In the present work, results were thoroughly analyzed to gain critical insight into some
of the most essential elastoplastic features of compacted intermediate geomaterials under
258
controlled suction states, including the effect of suction on yield stress, apparent cohesion, tensile
259
strength, critical state line, post-peak softening and strain-induced dilatancy under
suction-260
controlled monotonic shearing.
261
It is also worth noting, however, that the mechanical properties of unsaturated soils can
262
be greatly influenced by repeated wetting and drying cycles, commonly termed as hydraulic
263
hysteresis. This hydraulic hysteresis could be taken into account by including few modifications
264
to the BS model, as proposed by Morvan et al. [38]. Nevertheless, in case of sandy soils, such as
265
the test soil used in the present work, hydraulic hysteresis effects could be reasonably neglected.
266 267
4.5. Loading Collapse Locus using BS Model 268
Unsaturated soil could undergo volumetric collapse or slight rebound upon wetting, depending
269
on the mean stress level. The functions l1(s) and l2(s), along with , define the classic
270
loading collapse (LC) curve in the pʹ, s plane, as shown in Figure 6, including the limiting values
271
of pʹ (pʹlim) on the bounding surface. The BSM predicted LC curve ensures continuity at 272
saturation and satisfies conditions in Eq. (24).
273
In the BSM framework, and in contrast with the original BBM presented by Alonso et al.
274
[2], the stress state, while moving forward along an imposed triaxial stress path, can cross the
275
CSL and hence access the domain η > M. However, the plastic modulus “H” changes sign,
276
somewhere between the CSL and the LSL, to satisfy the condition M < η < ηp. This means that 277
the stress state can never reach LSL. The parameter “η” is the lower limit of ηpeak and, if properly 278
chosen, imparts the ability to reproduce the post-peak decrease in stress (softening). The value of
279
η can then be obtained by plotting the experimental values of peak deviator stress and 280
corresponding mean net pressure at s = 0, 50, 250, 500, and 750 kPa under three net confining
281
pressures, (σ3 – ua) = 100, 200 and 300 kPa, as shown in Figure 7. Thus, the best-fit line in Figure
282
7 defines the lower value of limit state line slope. A value of η = 1.77 was obtained and it was
283
rounded off to ηp = 1.8. This value represents an upper bound to the physically possible domain
284
for stress.
285 286
4.6. Parametric Investigation of BS Model Predictions 287
Figure 8 shows the results of a parametric investigation of BS model predictions with five
288
different values of slope ηp for triaxial testing at constant suction, s = 50 kPa, and net confining 289
pressure, (σ3 – ua) = 300 kPa. It can be clearly observed that the BS model is capable to simulate
290
a rather smooth transition of the nature of soil volume change, from contractant to dilatant, as
291
well as the corresponding transition of soil response from initial hardening to post-peak strain
292
softening. The parametric study also identifies a limiting case with ηp = M = 1.3, beyond which 293
any further increase in ηp will initiate dilatancy and the stress-strain curve will exhibit a distinct 294
peak stress.
295 296
4.7. Barcelona Basic Model: Essential Features 297
Alonso et al. [2] postulated a unified, critical state based, constitutive framework for unsaturated
298
soils by extending the modified Cam-Clay model [39], from saturated to unsaturated form, using
299
suction as an independent stress variable, while introducing the concept of the loading-collapse
300
(LC) yield surface. Consequently, constitutive parameters postulated by both the BBM and BSM
301
frameworks were experimentally calibrated from the series of suction-controlled triaxial tests
(Tables 1 and 2), and then used for predicting compacted silty sand suction-controlled
303
axisymmetric shearing response at constant matric suction states varying from 50 to 750 kPa.
304
Further details regarding the explicit, step by step integration of BBM constitutive
305
relations are given by Macari et al. [40] and Hoyos et al. [41]. Also, implementation of BBM
306
theory to calibrate the essential constitutive model parameter via experimental tests can be
307
obtained from Patil [28]. Complementary simulations using the Barcelona Basic Model (BBM)
308
have also been included, alongside BS model predictions, in order to get further enlightening
309
insights into some of the main limitations and challenges facing both frameworks within the
310
context of the experimental evidence resulting from the present research effort.
311 312
5. IMPLICIT INTEGRATION OF BSM CONSTITUTIVE RELATIONS
313
The present section illustrates the adopted protocol for implicitly integrating all the BSM
314
constitutive relations as summarized by equations (1)-(24) presented in the earlier sections.
315
Calibrated BSM parameters from Table 1 are used in order to simulate silty sand behavior for
316
matric suction, s = 250 kPa, and net mean pressure, (σ3 – ua) = 300 kPa. Figures 9(a) and 9(b)
317
show the corresponding stress-strain and volume change simulations along with observed
318
experimental response. Figure 9(c) clearly depicts the suction-induced growth experienced by the
319
initial yield surface of an unsaturated soil, as compared to the saturated case. Further, it
320
illustrates the progression of yield surfaces [i.e. (1)-(6)] as the specimen is loaded monotonically
321
under consolidated drained condition along an 1H:3V stress path, i.e. conventional triaxial
322
compression (CTC) stress path, in p-q space. The evolution of yield surface is largely governed
323
by change in plastic volumetric strains.
Point “1” corresponds to the initial state of a fictitious BS surface prior to shear loading,
325
with its equation calculated from the post-consolidation void ratio and mean net stress using
326
Bardet [7] equation, as expressed below: 327
328
where e = current voids ratio, p = mean net pressure, and A0 = unit pressure. The evolution of the 329
variable Aπ in Eq. (5) is described by the classic Cam-Clay hardening rule [38]. Bounding 330
surface equation (Eq. 5) depends on “A” as well as “Aπ”, so it permits to obtain mechanical 331
hardening as well as suction hardening,
332
333
For the sake of better understanding, the typical stress-strain curve is embedded to the
334
right of the BS yield curves in Fig. 9(c). As the specimen is loaded, the induced plastic strains
335
cause the bounding surface to move during plastic flow, but the BS must always envelope the
336
current state. The bounding surface expands in size isotropically as specimen is loaded between
337
stress state 1-2-3, inducing compressive volumetric strains. Point 3 on the stress-strain curve
338
identifies the onset of dilation and is also known as the characteristic state (i.e. CL). It marks a
339
transition state of volumetric behavior from contracting to dilating. The yield surface (BS) attains
340
its maximum size at characteristic state (point 3). As the loading continues further beyond
341
characteristic point 3, the stress state continues to move upwards towards peak failure line.
342
However, it cannot cross LSL (point 4), as explained earlier. Concomitantly, the test soil starts
343
dilating, and the BS starts to shrink in size as the plastic volumetric strains starts to decrease.
344
It should be noted that the observed peak dilatancy is attained far before reaching the
345
peak shear strength. Upon reaching the peak stress state, the specimen undergoes strain-softening
points 4 and 5, at a rate faster than corresponding decrease in stress state. According to Bardet
348
[7] theory for saturated soil, the stress state continues to decrease while the yield surface
349
continues to shrink further, until they both reach a common point, and thereafter they both move
350
together towards and stop at a point (point 6) that represents critical state, which correspond to a
351
state of no volume change, no stress change, and hence zero plastic volumetric strains. In these
352
simulations, critical state gives an asymptote to the stress path but is not reached. The same goes
353
for the bounding surface (BS), which keeps shrinking slowly but does not reach the stress state
354
along stress path, even with imposed axial strains of up to 40%.
355 356
6. BSM AND BBM PREDICTIONS OF COMPACTED SILTY SAND RESPONSE
357
BSM and BBM simulations were compared with the experimental results obtained from the
358
series of suction-controlled CD-triaxial shear tests. All specimens were sheared along CTC stress
359
paths. Figs. 10-14 show comparisons between BSM and BBM predictions and experimentally
360
observed deviator stress vs. axial strain response of compacted silty sand from fully drained
361
(constant suction) CTC tests conducted at four different values of matric suction, s = 0, 50, 250,
362
500 and 750 kPa, and for initial values of net mean stress, p = (σ3 – ua) = 100, 200, and 300 kPa,
363
respectively.
364
In general, no close agreement is observed between experimental behavior and BBM
365
predictions for overconsolidated silty sand, primarily given the largely brittle and dilatant nature
366
of the test soil before it reaches critical state. For hardening materials, continued shearing along a
367
suction-controlled CTC stress path (Fig. 5) is expected to cause the elliptical yield surface in p:q
368
plane to move outward (or increase in size) from the current point, while it would move inward
(or shrink in size) for softening materials. The relative position of the current stress state with
370
respect to the CSL governs whether the material sustains plastic dilatancy or contractancy.
371
The original BBM framework, however, does not contemplate a stress state that lies
372
beyond the CSL at which all induced deformation is plastic, since the peak stress is always
373
assumed to be reached at critical state. Therefore, it is not expected to be suitable for reproducing
374
the transition from initial contractancy to dilatancy, and hence the post-peak strain softening
375
commonly observed in dense or overconsolidated geomaterials (Figs. 11-14). For this reason,
376
only BBM predictions of stress-strain response are shown in Figures 10-14, obviating the
377
corresponding volume change response.
378
In effect, although predictions of deviatoric stress (end values) at critical state still proved
379
to be reasonably close to those experimentally observed (Figs. 10-14), BBM predictions
380
considerably deviate from the stress-strain response of compacted silty sand, particularly at
381
higher matric suctions and net confining pressures, which are precisely the stress state for which
382
the test soil exhibits largest post-peak softening, accompanied by significant dilation. From a
383
qualitative standpoint, however, reasonably good predictions are generally observed for most of
384
the initial shearing stage, up to about 1-2% shear strain, and at considerably large values of shear
385
strain, i.e., critical state.
386
On the contrary, the BSM is able to reproduce the stress-strain and volume change
387
response of compacted silty sand, under both saturated and unsaturated conditions, with
388
reasonable accuracy. It is worth noting that saturated silty sand samples showed compressive
389
type volume change response, which turned into dilating type as soon as the soil was subjected to
390
a matric suction as low as 50 kPa. The BSM was able to capture this drastic transition in volume
391
change quite smoothly. Furthermore, the BSM is able to simulate the increase in dilation with
increasing matric suction, rather smoothly as well, and with reasonable accuracy, as shown in
393
Figs. 10(c)-14(c). This transition is possible because of the term added to the plastic modulus
394
when the stress point lies inside the surface (Eqs.15 and 16).
395
On the other hand, saturated silty sand samples showed hardening type stress-strain
396
response, which quickly changed to post-peak softening type behavior under suction-controlled
397
conditions (s = 50, 250, 500 and 750 kPa). Likewise, the BSM was able to capture this transition
398
rather smoothly and successfully. The increase in magnitude of post-peak softening with
399
increasing matric suction is also closely captured by the BSM, as shown in Figs. 11(a)-14(a).
400
This close prediction of post-peak strain softening can be attributed to the incorporation of two
401
state lines into the BSM framework: the commonly used CSL (critical state line) and the LSL
402
(limit state line), as shown in Fig. 5. The stress path can cross the CSL, but the LSL limits the
403
accessible domain and whether it is crossed or not, the CSL will be the asymptote of the stress
404
path.
405
Figs. 11(a & b)-14(a & b) indicate that although the BBM is not able to closely capture
406
the typical stress-strain response, it performs relatively well in predicting deviator stress at peak
407
and critical state under low net confining pressure irrespective of magnitude of matric suction
408
applied. On the other hand, BSM performs relatively well in predicting peak and critical deviator
409
stress under high net confining pressures irrespective of magnitude of matric suction applied.
410
Finally, good correlations were obtained, for the tested suction and confining pressure
411
range, between experimental and the extended BSM predicted deviator stress values, both at
412
critical state failure (R2 = 0.91), and peak state failure (R2 = 0.85), as shown in Figure 15(a) and
413
(c). Although, relatively better correlations were obtained with BBM as compared to BSM at
414
critical state failure (R2 = 0.96), and peak state failure (R2 = 0.93) as shown in Fig. 15(b) and (d),
it cannot closely reproduce the continuous stress-strain and volume change response (Figs.
10-416
14). The slope of the critical state line in pʹ-q plane did not significantly changed with suction,
417
and thus can be considered to remain virtually constant and non-sensitive to changes in suction.
418
Figure 16 shows the variation of the slopes of critical state lines in pʹ-q plane for different soils
419
as reported from current and previous research works [22, 42‒44].
420
During suction-controlled experiments, the practical range of applying matric suction
421
inside soil specimen is only up to 1500 kPa, due to limitations of ceramic disk in using
axis-422
translation technique [20]. In addition, increase in magnitude of induced suction, well beyond
423
residual suction, will dramatically escalate the magnitude of drop in post-peak strength and
424
hence softening upon monotonic shearing as well as reduce the overall amount of dilational
425
volume change [28].
426
Incorporating such a dramatic variation in stress-strain response into modeling, that alters
427
from strain-hardening for saturated soil to strain-softening with introduction of matric suction
428
and which further tends to show increase in amplitude of softening with further increase in total
429
suction for test soil (i.e. silty sand), poses a great challenge. Currently, the authors are
430
investigating into experimental response at high suction to improvise the existing model,
431
especially to incorporate additional parameters to reflect high suction impact on response, to
432
enable possible better predictions, particularly above residual suction, where any change in
433
moisture content is merely due to vapor-phase exchange.
434 435
7. SUMMARY AND CONCLUSIONS
436
12 consolidated drained (CD), conventional triaxial compression (CTC) tests were conducted on
437
statically compacted specimens of unsaturated silty sand (SM) under four suction-controlled
conditions and three net confining pressures. Experiments were performed in a fully-automated
439
double-walled triaxial test system and target matric suction states varying from 50 to 750 kPa
440
was induced via the axis-translation technique. Experimental results from present research
441
showed persuasive evidence of augmentation in shear strength, stiffness, yield strength, tensile
442
strength, post-peak strain-softening and dilatancy with increase in matric suction. A distinct,
443
experimental compaction induced loading-collapse (LC) locus was readily identified in the p:s
444
plane and comparison was made with BS model predicted LC locus.
445
Essential constitutive parameters postulated by the BBM and the extended BS model
446
framework were then calibrated and used for prediction of peak deviator stress at matric suction
447
states varying from 50 to 750 kPa. There were no good agreements between the observed
448
experimental and predicted BBM stress-strain responses, especially the post-peak softening
449
behavior. BBM predictions, however, hold reasonably well mostly during the early shearing
450
stage (i.e. 1-2% axial strain) and at higher values of shear strain, i.e. critical state.
451
On the other hand, the extended BS model was able to simulate the stress-strain and
452
volume change response reasonably well. The BS model was able to capture smoothly the
453
transition of stress-strain response from strain-hardening to post-peak strain softening along with
454
the contemporaneous transition of volume change from compressive to dilatant type on account
455
of suction with reasonably well captured simulations. The major advantage of BS model is its
456
flexibility to allow for shrinking of yield surface based on value of (ηpeak – ηcritical), to
457
accommodate the post-peak softening behavior, which otherwise, was not possible with classical
458
model such as BBM. In general, irrespective of the value of matric suction applied, the BBM
459
performs relatively well in predicting response at peak and critical state failure under low net
confining pressure while the extended BSM performs relatively well under high net confining
461
pressures.
462
With additional testing in future, the current version of generalized BS model framework
463
that seems to have promising applications to unsaturated soil mechanics and shear strength
464
applications could be further generalized and made more flexible to accommodate experimental
465
response from more soil types applied over broader suction range.
466
ACKNOWLEDGEMENTS
467
The experimental work described in this paper is part of an ongoing research project funded by
468
the National Science Foundation under MRI Award No. 1039956. This support is gratefully
469
acknowledged. Any findings, conclusions, or recommendations expressed in this material are
470
those of the authors and do not necessarily reflect the views of the National Science Foundation.
471 472
REFERENCES
473
1. Guo R, Li G. Elasto-plastic constitutive model for geotechnical materials with strain-softening
474
behavior. Computers and Geosciences 2008; 34: 14-23.
475
2. Alonso EE, Gens A, Josa AA. constitutive model for partially saturated soils. Géotechnique
476
1990; 40(3): 405-430.
477
3. Dafalias YF, Popov E. (1976). Plastic internal variables formalism of cyclic plasticity. J. Appl.
478
Mech. 1976; 43(4): 645-651. 479
4. Anandarajah A, Dafalias YF. Bounding surface plasticity. III: Application to anisotropic
480
cohesive soils. J. Eng. Mech 1986; 112(12): 1292-1318.
481
5. Dafalias YF, Herrmann LR. Bounding surface plasticity: II. Application to isotropic cohesive
482
soils.” J. Eng. Mech. 1986; 112(12): 1263-1291.
483
6. Ling HI, Yue D, Kaliakin,VN, Themelis NJ. Anisotropic elastoplastic bounding surface model
484
for cohesive soils. J. Eng. Mech. 2002; 128(7): 748-758,
http://dx.doi.org/10.1061/(ASCE)0733-485
9399(2002)128:7(748).
7. Bardet JP. Bounding surface plasticity model for sands. J. Eng. Mech 1986; 112(11):
1198-487
1217.
488
8. Wang ZL, Dafalias YF, Shen CK. Bounding surface hypoplasticity model for sand. J. Eng.
489
Mech. 1990; 116(5): 983-1001. 490
9. Mc Vay M, Taesiri Y. Cyclic behavior of pavement base materials.” J. Geotech. Eng. 1985;
491
111(1): 1-17.
492
10. Ling HI, Liu HB, Mohri Y, Kawabata T. Bounding surface model for geosynthetic
493
reinforcements. J. Eng. Mech. 2001; 127(9): 963-967, DOI:
http://dx.doi.org/10.1061/(ASCE)-494
0733-9399-(2001)127:9(963).
495
11. Liu H, Ling HI. Unified elastoplastic-viscoplastic bounding surface model of geosynthetics
496
and its applications to geosynthetic reinforced soil-retaining wall analysis. J. Eng. Mech. 2007;
497
133(7): 801-815, DOI: http://dx.doi.org/10.1061/(ASCE)0733-9399(2007)133:7(801).
498
12. Yang BL, Dafalias YF, Herrmann LR. A bounding surface plasticity model for concrete. J.
499
Eng. Mech. 1985; 111(3): 359-380. 500
13. Luan MT, Wu XG. Li XS. Bounding-surface hypoplasticity model for rockfill materials and
501
its verification (in Chinese). Chin. J. Rock Mech. Eng. 2001; 20(2): 164-170.
502
14. Xiao Y, Liu HL, Zhu JG, Shi WC, Liu MC. A 3-D bounding surface model for rockfill
503
materials. Sci. China Tech. Sci. 2011; 54(11): 2904-2915.
504
15. Hashiguchi K, Ueno M. Elasto-plastic constitutive laws of granular materials. Speciality
505
session 9 – Constitutive Equations of Soils. 9th Int. Conf. Soil mech. Found. Eng. 1977; Tokyo, 506
Japan, 73-82.
507
16. Aboim CA, Roth WH. Bounding surface plasticity applied to cyclic loading of sand.
508
International symposium on Numerical Models in Geo-mechanics 1982; Zurich, Switzerland, 65-509
72.
510
17. Dafalias YF, Herrmann LR. Bounding surface formulation of soil plasticity. Soil Mechanics
511
– Transient and Cyclic Loads 1982; G. Pande and O. C. Zienkiewicz, Eds., John Wiley and Sons,
512
Inc., London, U.K.: 253-282.
513
18. Kaliakin VN, Dafalias YF. Simplifications to the bounding surface model for cohesive soils.
514
International Journal for Numerical and Analytical Methods in Geomechanics 1989; 13(1): 91-515
100.
19. Jiang J, Ling HI, Kaliakin VN. An associative and non-associative anisotropic bounding
517
surface model for clay. J. Applied Mech. 2012; 79(3): 031010, DOI:
10.1115/1.4005958-1-518
131010-10.
519
20. Fredlund DG, Rahardjo H. Soil mechanics for unsaturated soils. Wiley: New York, 1993.
520
21. Russel AR, Khalili N. A unified bounding surface plasticity model for unsaturated soils.
521
International Journal for Numerical and Analytical Methods in Geomechanics 2006; 30(3): 181-522
212.
523
22. Wheeler SJ, Sivakumar V. An elasto plastic critical state framework for unsaturated soil.
524
Geotechnique 1995; 45(1): 35-53. 525
23. Russell AR. Cavity expansion in unsaturated soils. Ph.D. dissertation, The University of New
526
South Wales, Australia, 2004.
527
24. Morvan M, Wong H, Branque D. An unsaturated soil model with minimal number of
528
parameters based on bounding surface plasticity. International Journal for Numerical and
529
Analytical Methods in Geomechanics 2010; 34: 1512-1537. 530
25. Cui YJ, Delage P. Yielding and plastic behaviour of an unsaturated compacted silt.
531
Géotechnique 1996; 46(2): 291-311. 532
26. Gallipoli D, Wheeler SJ, Karstunen M. Modelling the variation of degree of saturation in a
533
deformable unsaturated soil. Geotechnique 2003; 53(1): 105-112.
534
27. Raveendiraraj A. Coupling of mechanical behavior and water retention behavior in
535
unsaturated soils. Ph.D. dissertation 2009; Department of Civil Engineering, University of
536
Glasgow, Scotland.
537
28. Patil UD. Response of unsaturated silty sand over a wider range of suction states using a
538
novel double-walled triaxial testing system. Doctoral dissertation, University of Texas at
539
Arlington, Arlington, TX, 2014.
540
29. Yu HS. Plasticity and geotechnics. Springer: New York, 2006.
541
30. Cattoni E, Cecconi M, Pane V. An experimental study on a partially saturated pyroclastic
542
soil: the Pozzolana Nera from Roma. Proceedings of The Second Workshop on Unsaturated
543
Soils. Tarantino and Mancuso (eds), Capri: Italy, 29-42. 544
31.Hossain MA, Yin JH. Shear strength and dilative characteristics of an unsaturated compacted
545
completely decomposed granite soil. Canadian Geotechnical Journal 2010; 47: 1112-1126.
32. Ng CWW, Sadeghi H, Jafarzadeh, F. (2016). Compression and shear strength characteristics
547
of compacted loess at high suctions. Canadian Geotechnical Journal 2017; 54: 690-699,
548
dx.doi.org/10.1139/cg.
549
33. Houston SL, Parez-Garcia N, Houston WN. Shear strength and shear-induced volume change
550
behavior of unsaturated soils from a triaxial test program. Journal of Geotechnical and
551
Geoenvironmental Engineering 2008; 134(11): 1619-1632. 552
34. Pereira JM, Wong H, Dubujet P, Dangla, P. Adaptation of existing models to unsaturated
553
states: application to CJS model. Int. J. Numer. Anal. Meth. Geomech. 2005; 29(11): 1127-1155.
554
35. Crouch RS, Wolf JP, Dafalias YF. (1994). Unified critical-state bounding-surface plasticity
555
model for soil. J. Eng. Mech 1994; 120(11): 2251-2270.
556
36. Manzari MT, Dafalias YF. A critical state two-surface plasticity model for sands.”
557
Geotechnique 1997; 47(2): 255-272. 558
37. Brooks RH, Corey AT. Hydraulic properties of porous media. Hydrology Papers 3 1964;
559
Colorado State University, Fort Collins, Colorado, USA, 27 p.
560
38. Morvan M, Wong H, Branque D. Incorporating porosity-dependent hysteretic water retention
561
behavior into a new constitutive model of unsaturated soils. Can. Geotech. J. 2011; 48(12):
562
1855-1869.
563
39. Schofield A, Wroth CP. Critical state soil mechanics. McGraw-Hill: London, U.K, 1968.
564
40. Macari EJ, Hoyos LR, Arduino P. Constitutive modeling of unsaturated soil behavior under
565
axisymmetric stress states using a stress/suction-controlled cubical test cell. Int. J. Plast. 2003;
566
19(10): 1481-1515.
567
41. Hoyos LR, Perez-Ruiz DD, Puppala AJ. Modelling unsaturated soil response under
suction-568
controlled true triaxial stress paths. Int. J. Geomech. 2012; ASCE, 12(3): 292-308.
569
42. Hoyos LR. Experimental and computational modeling of unsaturated soil behavior under true
570
triaxial stress states. Ph.D. dissertation, Georgia Institute of Technology, Atlanta, USA, 1998.
571
43. Laikram A. Modeling unsaturated soil response under suction-controlled multi-axial stress
572
states. Ph.D. dissertation, University of Texas at Arlington, Arlington, TX, 2007.
573
44. Perez-Ruiz DD. A refined true triaxial apparatus for testing unsaturated soils under
suction-574
controlled stress paths. Ph.D. dissertation, University of Texas at Arlington, Arlington, TX,
575
2009.
List of Tables
Table 1. Essential BSM parameters calibrated from past and present works Table 2. Essential BBM Parameters for current test material
Table 1. Essential BSM parameters calibrated from past and present works Material constants ĸ ν ρ M Γ ηp h0 se α k1 k3 λ0 Units - - - kPa - - - - 0.01 0.125 2.2 1.2 0.73 1.2 2 15 2.1 2 0.05 0.1425 ** 0.006 0.3 1.7 1.6 0.95 1.9 5 6 0.2 5 0.05 0.155 *** 0.05 0.2 2.2 0.72 1.1 0.74 5 - 0.066 0.08 0.1907 0.19 **** 0.008 0.3 1.7 1.3 0.7 1.8 5 8 0.3 2.23 0.003 0.04 Notes: * – Cui and Delage [25]; Triaxial compression test on compacted jossigny silt and BS Model parameters extracted by Morvan et al. [24].
** – Russell [23]; Drained triaxial test on Kurnell sand and BS Model parameters extracted by Morvan et al. (2010).
*** – Raveendiraraj [27] and Gallipoli et al. [26]; Triaxial test on speswhite kaolin and BS Model parameters extracted by Morvan et al. (2010).
Table 2. Essential BBM Parameters for current test material Parameter Current work Units λ(0) 0.020 - κ 0.0015 - β 2.000 MPa-1 r 0.260 - pc 0.046 MPa G 25.00 MPa M 1.420 - k 0.223 - po(0) 0.070 MPa
List of Figures
Figure 1. Schematic layout of suction-controlled triaxial system Figure 2. Panoramic view of actual unsaturated soil triaxial set up
Figure 3. Experimental response of SM soil from s-controlled CTC tests at matric suction, s =
250 kPa, and different net confining pressures: (a) stress-strain response, (b) volume change response
Figure 4. Experimental response of SM soil from s-controlled CTC tests at net confining stress,
σ3 – ua = 100 kPa and matric suctions, s = 0, 50, 250, 500, and 750 kPa
Figure 5. Radial mapping defining image point on the unsaturated bounding surface BS
(modified from Bardet [7] model)
Figure 6. Comparison in pʹ-s plane between experimental yield stress (pʹlim ) and predicted
loading collapse curve (ρAπ), with right side limiting the bounding surface
Figure 7. Experimental values of peak deviator stress and corresponding mean net pressure at s
= 0, 50, 250, 500, and 750 kPa at three net confining pressures (i.e., σ3 – ua = 100, 200 and 300
kPa), defining limit state line slope
Figure 8. Parametric study of BS model predictions showing effect of LSL slope ηp: (a)
stress-strain response, (b) volume change response
Figure 9. Experimental and BSM predicted a) Stress strain; b) Volume change response and c)
Explanatory sketch: modeling strain-softening and dilatancy via swell-shrink of bounding surfaces with induced loading along CTC stress path using CD300-250 test results and presented BS model
Figure 10. Experimental and BSM/BBM predictions of saturated silty sand response at different
net confining pressures: (a), (b) stress-strain response, and (c) volume change response
Figure 11. Experimental and BSM/BBM predictions of unsaturated silty sand response at matric
suction, s = 50 kPa, and different net confining pressures: (a), (b) stress-strain response, and (c) volume change response
Figure 12. Experimental and BSM/BBM predictions of unsaturated silty sand response at matric
suction, s = 250 kPa, and different net confining pressures: (a), (b) stress-strain response, and (c) volume change response
Figure 13. Experimental and BSM/BBM predictions of unsaturated silty sand response at matric
suction, s = 500 kPa, and different net confining pressures(a), (b) stress-strain response, and (c) volume change response
Figure 14. Experimental and BSM/BBM predictions of unsaturated silty sand response at matric
suction, s = 750 kPa, and different net confining pressures: (a), (b) stress-strain response, and (c) volume change response
Figure 15. Comparison of predicted and measured values of deviator stress at peak and critical
state failure as postulated by the BSM and BBM framework
Figure 16. Current and previously reported values of critical state line slope variation with
Following is the list of symbols used in this paper:
π equivalent pore pressure η stress ratio q/p
ηp, ηcr maximum stress ratio at peak state and critical state failure σ projection of stress state i.e., image point on bounding surface δ distance between stress state and image stress
p, , pʹ mean pressure, deviator stress, and net mean pressure p , mean pressure and deviator stress at image point pʹcr, qcr mean net pressure and deviator stress at critical state εi i = 1, 2, 3 components of strain in triaxial space
εp, εq volumetric and deviator strain
elastic volumetric and deviator strain plastic volumetric and deviator strain
A, Aπ position of bounding surface summit on the p-axis Kp elastic bulk modulus
e, ec, e0 present, critical, and initial voids ratio G, Kq elastic shear moduli
g amplitude of gradient of bounding surface at image stress H, Hb, Hδ plastic moduli
K1, k2, K3 material constants to account for unsaturated state l1, l2 material constants to account for unsaturated state M, Mπ position of bounding surface summit on the p-axis
np, nq, ns components of unit vector normal to bounding surface at image point s suction
S1 degree of saturation
x, y normalized stress ratio, variable defining image position
ζ plastic multiplier
α, se constants defining water retention curve
ĸ elastic volumetric deformability
λ0, λ, Γ, 0 values determining position of the critical state ν elastic poisson ratio
ρ aspect ratio of ellipse