Supplementary figures
Qrel/Norm.
0 1 2
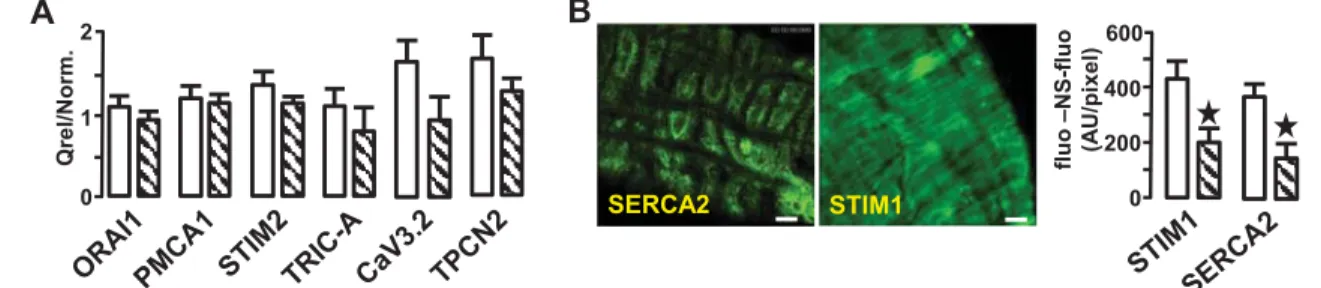
Figure S2: (A) Mean of gene expression levels quantified after RT-q-PCR in posterior cerebral arteries (PCA) from young (open bars) and old (hatched bars) mice. (B) Evaluation of protein expression by immunolabelling. Immunohistofluorescence obtained in PCA from mice and mean fluorescence in young (open bars) and old mice (hatched bars). Means calculated with 6 different mice for each age; scale bar: 5 μm. fluo –NS-fluo (A U/pi x e l) 0 200 600 400 SERCA2 STIM1
A
B
Ca2+ RYR InsP3R Ca2+ CaV1.2 SERCA G Ca2+ PLC Hormone/neuromediator GPCR InsP3 CICR CD38 cADPR NAADP BP TPCN Ca2+ Cal-2 Ca2+ PMCA STIM1 Orai TRPC SARAF TRIC GPCRSR
L/E
PM PMFigure S1: Ca2+channels and pumps implicated in Ca2+signalling in VSMC. GPCR (G-protein coupled receptors) located in plasma membrane (PM) activate transduction pathways to produce InsP3 (via activation of phospholipase C, PLC) or cADP (via CD38 activation) evoking a Ca2+signal by the
binding on their receptors (InsP3R and RyR respectively). They can also activate the production of NAADP that binds on a specific binding protein (BP) to activate RyR and TPCN located in SR
(sarcoplasmic reticulum) and L/E (lysosome or endosome) membranes, respectively. The voltage-gated Ca2+channels (CaV1.2) activated by GPCR or depolarization evoked a Ca2+entry responsible for the
Ca2+-induced Ca2+release mechanism (CICR). After activation of Ca2+signals, the return to the basal
level is due to the activation of SERCA and PMCA, two Ca2+ATPases located in SR and plasma
membrane (PM). The SR Ca2+refilling is thus the sum of SERCA activation and store operated Ca2+entry
(SOCE) due to Orai and TRPC channels, as well as STIM, SARAF and TRIC proteins located in PM and SR, respectively.
Figure S3: (A) Means of amplitude of Ca2+ responses induced by caffeine and KCl in control condition and in presence of ryanodine. (B) Means of area of cADPR-induced Ca2+response. (C) Means of amplitude of two successive caffeine-evoked calcium responses separated by 60 s (left) and 210 s (right). p<0,05 between young (open bars) and old (hatched bars) mice. p<0,05 between the 1stand the 2ndresponses.
2-3 months 20-22 months 10 s 100V F/F0 1 3 5 150V 200V 250V 300V F/F0 1 5
B
(V) 100 150 200 250 300A
3 7 Qrel/Norm. 0 1 2C
TPCN1 fluo –NS-fluo (A U/pi x e l) 0 200 600 400 TPCN1 30 sA
NAADP NAADP 2-3 m. 20-22 m. F/F0 1 3 5 Qrel/Norm. 0 1 2C
TPCN1 F/F0 1 3 5 NAADPB
D
Figure S6: (A) Typical NAADP-induced Ca2+ response observed in middle cerebral arteries (MCA).
(B) Means of amplitude of Ca2+responses induced by NAADP. (C) Means of TPCN1 expression measured by RT-qPCR. (D) Mean fluorescences emitted by immunostaining with anti-TPCN1 antibody in young (open bars) and old (hatched bars) mice. Data are expressed as mean ±sem, p < 0.05.
Figure S5: (A) Typical InsP3-induced Ca2+response observed in middle cerebral arteries (MCA). (B) Means of amplitude of Ca2+responses induced by InsP3 photolysis observed in young (S) and old mice (U). (C) Means of expression of InsP3R subtypes measured by RT-qPCR in young (open bars) and old (hatched bars) mice. Data are expressed as mean ±sem, p < 0.05.
A
F/F0 7 1 3 5 caffeine KCl +ry anodi n e A re a (F/F0).s 0 1 3 2 cADPRB
F/F0 7 1 3 5 't = 60 s 1st 2ndC
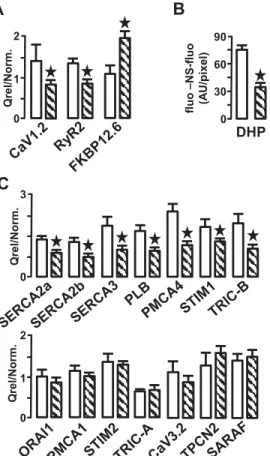
F/F0 7 1 3 5 1st 2nd 't = 210 sFigure S4: (A, C) Means of expression of pumps and
channels responsible for Ca2+signals measured by RT-qPCR in young (open bars) and old (hatched bars) mice. (B) Means of fluorescence emitted by ST-bodipy(-)-DHP in middle cerebral arteries (MCA). Data are expressed as mean ±sem, p < 0.05.
fluo –NS-fluo (A U/pi x e l) 0 30 90 60 DHP Qrel/Norm. 0 1 2
A
B
C
Qrel/Norm. 0 3 Qrel/Norm. 0 1 2Supplementary methods
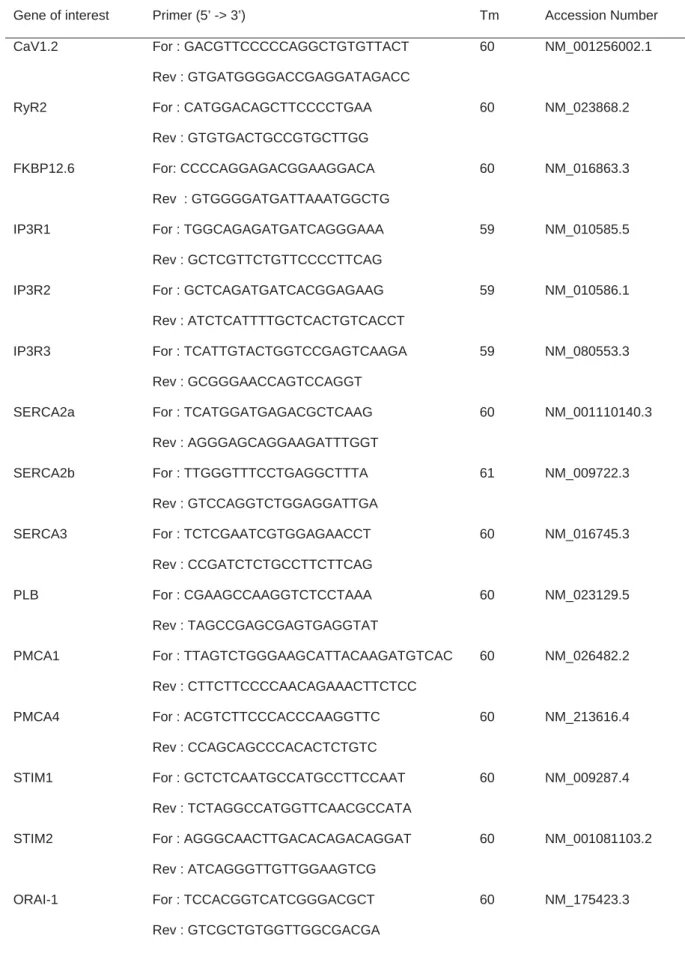
Table of primers: The efficiency, optimal Tm and dimerization of primers were tested and
verified before qPCR experiments.
Gene of interest Primer (5’ -> 3’) Tm Accession Number
CaV1.2 For : GACGTTCCCCCAGGCTGTGTTACT
Rev : GTGATGGGGACCGAGGATAGACC
60 NM_001256002.1
RyR2 For : CATGGACAGCTTCCCCTGAA
Rev : GTGTGACTGCCGTGCTTGG
60 NM_023868.2
FKBP12.6 For: CCCCAGGAGACGGAAGGACA
Rev : GTGGGGATGATTAAATGGCTG
60 NM_016863.3
IP3R1 For : TGGCAGAGATGATCAGGGAAA
Rev : GCTCGTTCTGTTCCCCTTCAG
59 NM_010585.5
IP3R2 For : GCTCAGATGATCACGGAGAAG
Rev : ATCTCATTTTGCTCACTGTCACCT
59 NM_010586.1
IP3R3 For : TCATTGTACTGGTCCGAGTCAAGA
Rev : GCGGGAACCAGTCCAGGT
59 NM_080553.3
SERCA2a For : TCATGGATGAGACGCTCAAG
Rev : AGGGAGCAGGAAGATTTGGT
60 NM_001110140.3
SERCA2b For : TTGGGTTTCCTGAGGCTTTA
Rev : GTCCAGGTCTGGAGGATTGA
61 NM_009722.3
SERCA3 For : TCTCGAATCGTGGAGAACCT
Rev : CCGATCTCTGCCTTCTTCAG
60 NM_016745.3
PLB For : CGAAGCCAAGGTCTCCTAAA
Rev : TAGCCGAGCGAGTGAGGTAT
60 NM_023129.5
PMCA1 For : TTAGTCTGGGAAGCATTACAAGATGTCAC
Rev : CTTCTTCCCCAACAGAAACTTCTCC
60 NM_026482.2
PMCA4 For : ACGTCTTCCCACCCAAGGTTC
Rev : CCAGCAGCCCACACTCTGTC
60 NM_213616.4
STIM1 For : GCTCTCAATGCCATGCCTTCCAAT
Rev : TCTAGGCCATGGTTCAACGCCATA
60 NM_009287.4
STIM2 For : AGGGCAACTTGACACAGACAGGAT
Rev : ATCAGGGTTGTTGGAAGTCG
60 NM_001081103.2
ORAI-1 For : TCCACGGTCATCGGGACGCT
Rev : GTCGCTGTGGTTGGCGACGA
TPCN1 For : ACCTCGCTCTGTCTTCCTGA Rev : GAGGGCTTCCAGAGTTTTCC 60 NM_145853.2 TPCN2 For : ATGAAGCACAGGACCAGGAG Rev: ATCAGGGTTGTTGGAAGTCG 60 NM_146206.4
SARAF For : CTTGAGCTAGGTGGCTTTGG
Rev : AGTAGTCGGCACTGGGCTTA
60 NM_026432.3
TRIC-A For : GTGTCCAAGGCCAGCCTCAT
Rev : CCAAACAGCACTGGGCAGAT
60 NM_144534.1
TRIC-B For : AAGGTGATGAATGGCTGAAGATGTC
Rev : ATGCTTTGAGATCGCCAGGTG
60 NM_028053.2