HAL Id: halshs-02505320
https://halshs.archives-ouvertes.fr/halshs-02505320
Preprint submitted on 11 Mar 2020
HAL is a multi-disciplinary open access
archive for the deposit and dissemination of
sci-entific research documents, whether they are
pub-lished or not. The documents may come from
teaching and research institutions in France or
abroad, or from public or private research centers.
L’archive ouverte pluridisciplinaire HAL, est
destinée au dépôt et à la diffusion de documents
scientifiques de niveau recherche, publiés ou non,
émanant des établissements d’enseignement et de
recherche français ou étrangers, des laboratoires
publics ou privés.
market
Luc Arrondel
To cite this version:
WORKING PAPER N° 2020 – 12
Financial literacy and French behaviour on the stock market
Luc Arrondel
JEL Codes:
Financial literacy and French behaviour
on the stock market
Luc Arrondel
Corresponding author: arrondel@pse.ens.fr
CNRS-PSE
Abstract: This article looks back over the different dimensions of financial literacy: theoretical,
methodological and empirical. First, the theoretical foundations of the notion of financial literacy are presented with reference to recent contributions by psychological or behavioural economics: “household finance” refers to the concept of financial literacy based on the empirical dead-ends of standard saver theory. This raises the question as to how to measure and evaluate it. Is the “standard” methodology, based on a few straightforward questions (interest calculations, notion of inflation and risk diversification), adequate or do other definitions need to be developed? As is often said, are the French really “useless at finance” ? Is their financial behaviour, in terms of their portfolio choices, affected by it ? And last but not least, how effective are economic education programmes and is a public financial literacy policy required?
Key words: Household finance, financial literacy, stock ownership,
Acknowledgements: The author would like to thank the ELIPSS team for conducting the FLIP survey.
E. Duwez’s assistance was key. The survey drew largely on the questionnaire developed by G. Nicolini (University of Rome). This research received funding from the Public Policy and Redistribution Area of the Centre for Economic Research and its Applications (CEPREMAP). The Europlace Institute of Finance (EIF) also provided funding for the study.
“You don’t need to know your times tables to be a great mathematician”
Cédric Villani, Les Matins de France Culture, 15 November 2017
The French public’s economic knowledge has been the focus of particular attention and regular polls for some twenty years (e.g. Banque de France, 2018). The recurrent observation made by these studies is that, although a small majority (50% to 60%) of French people say they are “interested” in the economy, their economic knowledge is generally regarded as highly inadequate. This state of affairs was summed up by a headline in Le Figaro (15 May 2018): “The French people are interested in the economy… but don’t know much about it”: a very rough idea of GDP and public debt, poor approximation of the national minimum wage, false impression of inequalities, and so on. Many experts argue that these gaps in their knowledge are one of the reasons why the French are reluctant to consider what are seen as necessary reforms for the country: “How can the French support reforms they do not understand?” (F. de Saint-Pierre of the Cercle J.B. Say, Les Echos, 20 June 2018). In terms of public policy, therefore, it is regarded as urgent and vital to improve their economic and financial knowledge.
This argument about the French public’s economic ignorance re-emerged very recently in criticism of the gilets jaunes’ demands and as a proposed explanation for the political crises. In her editorial published on 20 December 2018, Christine Kerdellant, Editor-in-Chief of L’Usine Nouvelle, wrote about the “Gilets Jaunes and Economic Knowledge”, saying that, “The best weapon against populism would be to provide good education on the economy,” (author’s underlining).
This observation of financial “illiteracy” extends beyond the economic press, however, as it is also the subject of a vast body of academic literature (Lusardi & Mitchell, 2014). Elsa Fornero (2015), economist and professor at the University of Turin, and also Monti government Minister for Labour and Social Policies behind the pensions reform in Italy, shows that financial literacy improves the understanding (and hence acceptance) of public policies and helps counter a certain “populism”. Economic knowledge was also raised in the recent past as a possible remedy for financial crises. In his reading of the “Great Recession” of 2008, Robert Shiller, 2013 Nobel Prize in Economics, explains certain savers’ economic incompetence, especially the “poor”, as being due to their lack of economic knowledge (2008, p. 95): “Low-income individuals who took out risky subprime mortgages, with interest rates that would soon be adjusted upward, were often unaware of the known risks inherent in such mortgages,” (author’s underlining).
Savers, then, are seen as having “behaved badly” during the crisis, whether out of irrationality or incompetence, and a solution to prevent future crises would, here too, be to improve their economic and financial literacy so that they do not make the same mistakes again. The message put across by Annamaria Lusardi, the great academic “ambassador” for financial literacy, is particularly explicit on this point: “Financial literacy is an essential piece of knowledge that every student should have… Just as reading and writing became skills that enabled people to succeed in modern economies, today it is
impossible to succeed without being able to ‘read and write’ financially.” (NY Times, April 2010, author’s underlining).
Some even take the observation further considering that, structurally, economies have everything to gain from investing in economic knowledge. With her co-authors, Lusardi (2017) puts it that financial literacy explains 30% to 40% of wealth inequality. In an inverse line of reasoning, Edmund Phelps (2017), 2006 Nobel Prize in Economics, calculates that the French people’s financial illiteracy costs the country one point of GDP per year. These illustrious economists hence see economic and financial knowledge as eminently virtuous: the construction of a “financial democracy” will prevent a new crisis (Shiller), reduce inequality and increase well-being (Lusardi), and generate growth (Phelps). Nevertheless, this concept is subject to ideological criticism.
This stated need to develop savers’ economic knowledge is part of the broader purpose of the individual “activation” policies conducted since the 1980s, mainly at the instigation of the OECD (Castel, 2011), designed to make each of us behave as our own Chief Financial Officer (“You are your own CFO”, Lusardi, 2009).
These activation policies have come under criticism from both sides of the political fence. The “left”, such as Robert Castel (2011, p. 24), carp that they “unsubscribe” the individual from the collective welfare systems: “The individual does not stand alone and, without guaranteed support points, risks social death.” Liberal thinkers, such as Gilles Saint Paul (2012, p. 12), take exception to this post-utilitarian desire to make individuals happy despite themselves and propose, “… re-establishing individual autonomy, freedom and responsibility as the fundamental values of our society and consequently setting strict boundaries on the reach of government interventions.” This is the spirit in which to reread the famous metaphor made by Milton Friedman in the 1950s, in which he suggested that just as billiard players do not need to be experts in physics to play well, individuals do not need to be financial experts as they can learn optimal behaviour through trial and error (1953, p. 22). So what is the point of financial literacy? That is the question …
This article looks back over the different dimensions of financial literacy: theoretical, methodological and empirical. First, the theoretical foundations of the notion of financial literacy are presented with reference to recent contributions by psychological or behavioural economics: “household finance” refers to the concept of financial literacy based on the empirical dead-ends of standard saver theory (§ 1). This raises the question as to how to measure and evaluate it (§ 2). Is the “standard” methodology, based on a few straightforward questions (interest calculations, notion of inflation and risk diversification), adequate or do other definitions need to be developed? As is often said, are the French really “useless at finance” (Le Parisien, 9 November 2011) or at least more “useless” than the others (§ 3)? Is their financial behaviour, in terms of their portfolio choices, affected by it (§ 4)? And last but not least, how effective are economic education programmes and is a public financial literacy policy required (§ 5)?
Although the economist’s modern concept of financial literacy seems to be relatively recent, the idea of familiarising individuals with savings, especially at a young age, is ancient.
School savings banks were established in many countries back in the early 20th century (Garon, 2011). Closer to home in France, savings banks (Caisses d’Epargne et de Prévoyance) were handing out “savings picture books” in primary schools to develop “school savings” in the 1960s. Yet it was probably not until the early 2000s, in an “individual promotion” policy-friendly climate, that what we mean by “financial literacy” today really emerged, namely with the launch of the OECD Financial Literacy programme. This movement took shape in France with the creation of the Public Financial Literacy Institute (IEFP) in 2006, the Cité de l’Economie et de la Monnaie (economics museum) in 2011 and, more recently, the Banque de France My Money Questions website in early 2017.1 The
OECD Council (2005, p.14) defines financial education as, “the process by which financial consumers/investors improve their understanding of financial products, concepts and risks and, through information, instruction and/or objective advice, develop the skills and confidence to become more aware of financial risks and opportunities, to make informed choices, to know where to go for help, and to take other effective actions to improve their financial well-being.”
In the academic literature, a lack of financial literacy is put forward to explain certain biases or irrationality in saver behaviour predicted by the “standard” model (life-cycle hypothesis and portfolio choice theory): a good education produces good conduct. This “standard” framework is based on dual rationality: rational decision-making based on the maximisation of a utility function and rational expectations where economic agents’ beliefs, based on all the available information, are supposed to correctly represent future uncertainties. Hence the most widely accepted model in the profession, the
life-cycle hypothesis, postulates that individuals adopt forward-looking, time-consistent (not
contradictory over time) behaviour and consume in accordance with their preferences, albeit constrained by their total resources over their entire lifetimes (Modigliani & Brumberg, 1954). Individuals use assets, as a reserve of deferred consumption, to smooth their consumption over their life cycle in keeping with their income profile (permanent income). It is also possible to study the optimal composition of these assets over time (Merton, 1969). This basic model’s initial message has moreover been enriched by considering other savings motives: precautionary savings to provide for future contingencies, especially income incidents (Kimball, 1993); and a bequest motive in terms of transferring an inheritance to offspring (Arrondel & Masson, 2006). This standard theory posits, at least implicitly, that individuals have knowledge of certain financial principles to be able to make their decisions, in particular to determine their constraints, such as discounting, inflation and calculation of interest, and that they have a certain amount of information on the financial and economic environment. Psychological economics research programmes on information, financial literacy and cognitive ability tend to show that this is not the case (Lusardi & Mitchell, 2014).
They find that savers are financially illiterate and have limited cognitive abilities (Lusardi, 2009; Guiso & Sodini, 2013). They do not have a command of the economic principles required (rational formation
of expectations, discounting calculation, valuation of assets, etc.) or they suffer from inadequate knowledge of financial products and the economic environment (interest rates, stock markets, pensions system, etc.). They make all kinds of “mistakes” of calculation and strategy, but also of expectations in information collection and processing and the formation of their beliefs: non-Bayesian revisions and overconfidence in their judgements. They fall prey to “emotions” at odds with their own interests (lack of self-control, impulsiveness, overconfidence, unjustified regret or disappointment, etc.).
These different “biases” put forward by behavioural economics (Thaler, 2000) are supposed to explain, at least in part, certain empirical puzzles. With respect to saving (Guiso & Sodini, 2013, Jappelli & Padula, 2013), standard theory fails to explain why certain households display an inadequacy of savings able to maintain their consumption level in retirement (approximately 20% in France) and little use of annuity. Similarly, in portfolio choice, standard theory finds it hard to justify the low level of asset diversification, especially in risky assets, as much in terms of amount (Mehra & Prescott, 1985; Kocherlakota, 1996) as holdings (Haliassos, 2003). Lastly, in addition to saver theory, biases observed in household securities portfolio management also take issue with standard theory: “home” biases in favour of national shares, “naïve” (uniform) diversification, the “disposition” effect whereby investors part with winning assets too soon and losing assets too late, the status quo bias, inertia, excessive trading (Vissing-Jorgensen, 2004), etc.
Ignorance about assets and all kinds of information costs are evidently behind the observed incompleteness and diversity of portfolios. A large body of recent literature looks into factors related to this information that appear to play an important role in stock participation: cognitive abilities (Christelis
et al., 2010, Grinblatt et al., 2011), trust (Guiso et al., 2008), financial “awareness” (Guiso & Jappelli,
2005), time spent obtaining information (Guiso & Jappelli, 2007), social interactions (Hong et al., 2004, Guiso et al., 2004, Arrondel et al., 2019), optimism (Jouini et al., 2006) and financial literacy (van Rooij
et al., 2011b, Lusardi & Mitchell, 2014). However, the precise mechanism by which these factors
influence households’ financial choices (via the pool of information or expectations, etc.) largely remains to be formalised (Grinblatt et al. 2011).
Behavioural economics criticises savers’ omniscience not only in terms of the rationality of their behaviour, but also in terms of the rationality of their expectations. The hypothesis of rational expectations, especially the homogeneity of beliefs, has been in question for the last thirty years. Behavioural finance cites different cognitive biases in the formation of expectations. Gollier (2013, p. 3) states that, “It allows people to dream of impossible returns, to refuse [relevant] information that they do not like, or agree to disagree among themselves.” These psychological biases could therefore help explain “the bubbles, cycles and crashes”, especially if they are reinforced by media coverage that is itself biased. The field is also concerned about the “extreme pessimism of economic agents during phases of [acute] crisis”, produced by strong aversion to ambiguity combined with increasingly gloomy expectations of stock prices.
Financial literacy is generally defined as a specific component of human capital whereby individuals are able to use relatively simple concepts to make suitable financial decisions (savings, investment and debt). This concept therefore covers various aspects: cognitive abilities, financial culture, and information collection and processing capacities. One of the problems, then, is how to measure it as a whole.
The Big Three basic questions (see below) introduced by Lusardi & Mitchell (2014) in the 2004 American Health and Retirement Study have rapidly become the standard international format for doing so. They ask respondents to: 1) calculate compound interest, 2) find the gross or real rate of return after inflation, and 3) assess the risky nature of assets. Although this composite measure makes for comparative analyses across countries, it has come under some criticism, especially with regard to its simplicity (Hastings et al., 2013). Yet few studies actually seek to find out whether this simple measurement is the best, or even if it is simply better than others with more questions or covering more varied areas. The relevance of these variables might therefore depend on the socioeconomic environments in which they are measured.
The second, relatively widespread survey measurement is to simply ask individuals to rate themselves on a scale of financial knowledge. The main criticism of this method is that it is allegedly biased upwards, as individuals tend to be “optimistic” about their level (Hasting et al., 2013).
The empirical part of this article draws on an original survey conducted by ELIPSS: FLIP (Financial Literacy and Assets). The aim of this questionnaire was to propose other, more sophisticated assessments than the two abovementioned measurements of financial literacy. In addition, given that the purpose of this experiment was to explain saving and asset behaviour, it provides an entire set of information on household assets and their saving preferences (risk aversion and time preference). These data concern France, but the questionnaire developed by Gianni Nicolini (2019) draws largely on information collected in other countries using the same methodology, enabling comparative analyses to be conducted. The sample is the ELIPSS panel set up by the Socio-Political Data Centre (CDSP).
The survey conducted via the Internet put the FLIP questionnaire to over 2,783 people in early 2018, and received 2,300 responses. This response rate of over 80% is the rate usually observed for other panel surveys. In addition, less than 2% of the panel abandoned the questionnaire mid-survey. Given that the questionnaire was relatively complicated and took the form of a quiz (with, however, the possibility of not having to systematically answer all the questions), it is interesting to note that very few respondents were discouraged by the survey’s nature. Moreover, 80% of respondents looked up the answers to the quiz once they had filled in the questionnaire, which again shows a certain amount of interest in the survey.
The high number of questions on financial literacy (approximately 50) made for a larger number of financial literacy measurements. Although the standard measurements (Big Three and self-assessment) were used for reasons of comparison with existing studies, numerous variants can be envisaged. In particular, one of the FLIP survey’s originalities is that it proposes four levels of difficulty
for answers to the Big Three basic questions. The wording of the questions put by level of difficulty is reported in Table 1 (correct answers in bold type).
Insert Table 1
The questions allow for respondents to say that they do not know the answer (“Don’t Know” option) or to refuse to answer (“ReFuse to answer” option). Answers to the risk diversification questions score correct when “shares” are ranked as the riskiest investment, and incorrect otherwise.
This article focuses on these different Big Three levels of difficulty to study the French public’s economic knowledge, choosing just twelve questions to measure the level of financial literacy.
3. Are the French “useless at finance”?
Detailed results of the financial literacy measurements are given in Table 2, differentiating between the four levels of difficulty for the Big Three questions.
Insert Table 2 The Big Three and financial literacy
Level 1 corresponds to precisely the measure adopted in the international literature (Lusardi, 2019). Approximately 84% of the people interviewed answered the interest rate question correctly and 64% understood the impact of inflation on their purchasing power. A total of 40% of respondents ranked the investments correctly by risk. Overall, less than one-third of the individuals were able to answer all three questions correctly. These results confirm the measurements and conclusions of other French studies (Hass, 2012, Arrondel et al., 2013).
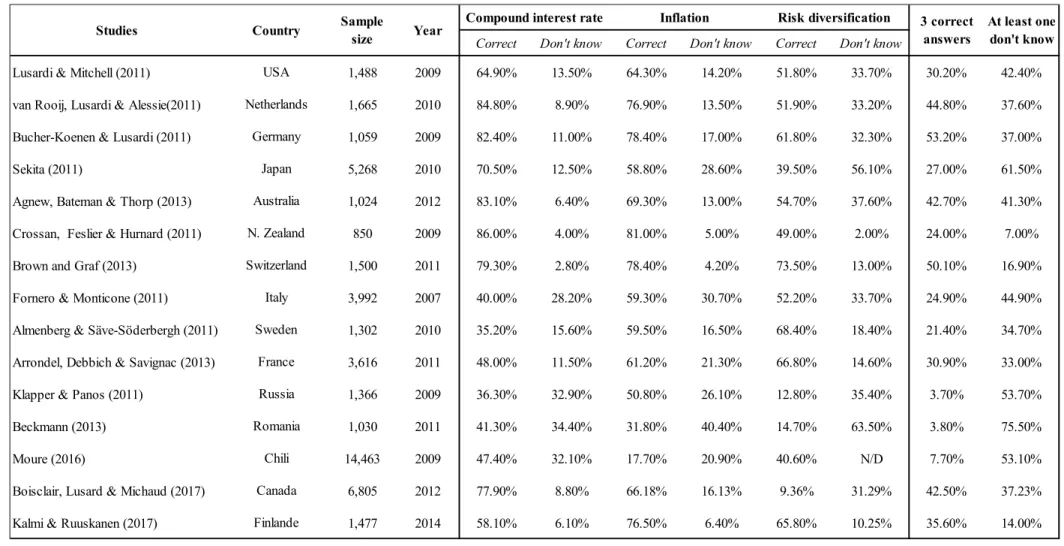
One of the advantages of the Big Three is that their simplicity allows for international comparisons, as presented in Table 3 taken from Lusardi and Mitchell (2014) and updated by Lusardi (2019). On the financial literacy podium are the Germans (53.2% obtained top marks), followed by the Swiss (resp. 50.1%) and the Dutch (resp. 44.8%). Among the stragglers are the Swedish (21.4%) and, lagging far behind, the Chileans (7.7%), Romanians (3.8%) and Russians (3.7%) right at the bottom of the league table. The French are found at the median level, close to the United States (30.2%). The FLIP survey confirms this figure.
Insert Table 3
Other classifications sometimes return highly contrasting rankings. For example, an OECD report (2017) on adults’ financial literacy competencies proposes the following podium based on three scores (knowledge, behaviour and attitude): France wins the gold medal and Finland the silver, with Norway and Canada joint bronze medallists! Contrary to the popular refrain, the French would not appear to be so useless at finance after all …
It is hard to explain these differences without a detailed analysis of the countries’ heterogeneity in terms of economic history, welfare and pensions system, financial market development, level of education, demographic structure, and so on. Nevertheless, a few elements could provide some
reasons for these differences in levels of financial literacy across countries. For example, there is less knowledge of inflation in countries that have seen more periods of deflation (59% in Japan) than inflation (78% in Germany and 80% in New Zealand). The investment risk questions can be better understood in countries with highly developed financial markets and banking systems (France, Switzerland, etc.). Ideological references (“market” supporters or detractors) may also be at work behind these differences. This hypothesis of the influence of ideology and economic environment on an individual’s “stock” of financial literacy is the focus of a study by Bucher-Koenen & Lamia (2018), who seek to explain the accumulation of financial literacy in Germany by separating former East Germans from former West Germans. The most interesting conclusion is that, even considering individual characteristics, there still remains an (unexplained) difference between the two Germanys wherein the former West Germans are found to be more financially “literate” than the former East Germans …
Financial literacy and individual characteristics
Yet these aggregate results mask strong disparities within the populations by age, level of education, gender and employment situation, as is the case in France (Arrondel et al., 2013). Some sociodemographic groups have particularly low levels of financial literacy, other things being equal.
Insert Chart 1
Not surprisingly, level of education and financial literacy are positively correlated (nearly 45% of higher education graduates answered all three questions correctly as opposed to one-quarter for the least qualified). This effect is strengthened by having taken an economics course. Yet qualifications alone are not enough to explain these financial literacy differences. The youngest individuals answer correctly less often than individuals in a higher age bracket, making for a growing financial literacy curve over the life cycle. There are significant differences between men and women: men answer all three questions correctly more often than women (41% versus 23%), and women more frequently say that they do not know the answer to a question.
Insert Chart 2
This phenomenon, already observed in the literature, may reflect the men’s overconfidence in their answers, unlike the women who may refrain from answering when they are not sure (Barber & Odean, 2001). This could also be what Chart 2 tends to show with its representation of the distribution of self-assessment of financial literacy on a scale of 1 to 7: the men believe they are better equipped to manage the household’s finances.
Insert Table 4
Table 4 presents an econometric ordinary least squares (OLS) regression analysing the effects of respondents’ characteristics on their level of financial literacy as assessed by the different measurements (Big Three and self-assessment), other things being equal. This regression confirms the abovementioned effects: a better financial literacy score among men, qualified and older
individuals. Note that having taken lessons in economics also raises the score obtained (for an equivalent level of education). The survey also contains a variable indicating the number of books read in the last twelve months. This would appear to evidence complementarity between “general” knowledge and “financial” knowledge as measured by the Big Three, where the number of books read is associated with better financial knowledge.
More originally, ideological and cultural factors such as political opinions could explain test performance (Arrondel et al., 2013). The survey asked individuals to position themselves on a political scale from left to right wing (eleven positions): the individuals who positioned themselves as more right wing obtained better financial literacy scores than the others (even when controlling for the level of household resources). In France, more right-wing voters tend to have more of a “free market” view of the economy and be more sensitive to “individual activation” policies. Their financial literacy performance may therefore tie in with their opinion of the respective roles of the welfare state and individual responsibility.
What the other measures say
To prevent wording biases, three other measures similar to the basic Big Three were considered and ranked by level of difficulty (see Table 2). Overall, individuals’ performances decrease as a function of the questions’ supposed level of difficulty: e.g. less than 5% of individuals answer the three Level 4 questions correctly. Nevertheless, this relation is not always observed when the answers are analysed question by question: Level 4’s diversification question appears much less tough than the other levels’ diversification questions. Hence the difficulty of arriving at an indisputable measurement of individuals’ financial literacy, since it depends to a large extent on the wording of the questions put.
Insert Chart 3
Another measure was therefore used to enhance our assessment of French households’ financial literacy: it consists of using a scoring method to add up the number of correct answers to the twelve questions put for the four levels of difficulty. This indicator presents good internal consistency, since Cronbach’s alpha coefficient is 0.81 (an alpha value of over 0.7 is considered as an acceptable indicator). Chart 3 represents the distribution of the population by this measure: the distribution presents two peaks (bimodal distribution) with nearly 12% of respondents obtaining a score of 4 or 8.
Insert Table 5
When the value of the economic knowledge score is analysed by the individuals’ sex, age and level of education (Table 5), the effects are the same as with the other financial literacy measures: women are less financially literate, as are young people and individuals with a low level of education. Table 4’s regression (5th and 7th columns) for this variable statistically validates these conclusions. The other
variables introduced into the explanatory model for the score also confirm the previous effects: the score value is higher for “right wingers” and “readers”.
Nicolini (2019), who developed this questionnaire on economic knowledge, has taken his measurement further by comparing the different European countries’ rates of success at answering the 50 survey questions on financial literacy. He obtains the following statistics: the Spanish score 62% of correct answers, the Germans 49%, the Italians 47%, the English 43% and, lastly, the Swedish and French 39%.
4. Does financial literacy influence behaviour?
“Standard” saver theory states that portfolio choices are based on dual rationality of choices and expectations. This theory has it that individuals’ investments depend on three basic factors: present resources, (rational) expectations of asset return and risk, but also of earned income, and agents’ preferences, especially with respect to risk (aversion and temperance). It predicts that all savers will hold at least a small quantity of risky assets, unless fixed asset-holding costs constrain investors on the stock market (Haliassos & Bertaut, 1995). As observed previously, shareholding is low in many countries, including in France. Here, we have the famous “stock participation puzzle”, which asks why savers turn their backs on risky assets. The standard framework provides initial explanations for this: costs of holding and managing a risky portfolio, exposure to other risks, especially professional risks, future debt constraints, lack of labour supply flexibility, etc. (Gollier, 2001). Psychological (or behavioural) economics, for its part, puts forward certain cognitive “biases” or “emotions” to explain this “puzzle” such as ambiguity aversion, loss aversion, pessimism, distrust and lack of economic literacy (Guiso & Sodini, 2013). The low level of household financial literacy is therefore described as one of the factors that could explain it (van Rooij et al., 2011b, Arrondel et al., 2015).
This hypothesis is tested here in the case of France by analysing the determinants of share investment based on one variable measured in the FLIP survey. This variable considers the weight of shares in households’ portfolios: is it (or not) the largest investment in their financial assets? It is the largest in the case of 8.6% of the panel’s households.
Representativeness of the data
The study of these questions nonetheless calls for an analysis of the representativeness of the FLIP survey from the point of view of wealth and financial assets. To this end, it is interesting to compare the survey’s data with data from the INSEE (French National Institute of Statistics and Economic Studies) Household Wealth Surveys.
Insert Table 6
Table 6 compares the amounts of gross wealth and financial assets found by the two sources (in 2014 for INSEE). The first observation to be drawn from these statistics is the high rate of missing data in the FLIP survey: 22.8% of respondents did not know how to answer the question on gross wealth and 24.4% refused to; and 23.1% of respondents could not give any information on their financial assets, while 16.9% did not want to. The asset variables can therefore be used solely for half of the sample.
The distributions observed for FLIP survey respondents are relatively similar to the INSEE distributions: the value of median gross wealth in the INSEE Household Wealth Survey (158,001 euros) tallies with the FLIP survey bracket, as does the value of the upper decile (595,723 euros); and the same observation can be made with respect to financial assets (11,639 euros for the median and 109,035 euros for the tenth decile). An average value can be calculated for these two variables based on the centres of the brackets: although the values obtained are lower, they are relatively similar to those found by the Household Wealth Surveys. The good quality of the FLIP survey’s wealth variables is also reflected in terms of holding the different assets. For example, the proportion of savers who say they are “considering investing” in shares (15.7%) is consistent with the number of shareholders observed in France by INSEE (8.8%). The rates of owners of their usual residence are comparable in both surveys, even though the FLIP survey presents a four-percentage-point overestimation: 61.8% compared with 57.8% in the 2017 Household Wealth Survey (Cazenave-Lacrouts et al., 2018). The rates of holders of retirement savings and life assurance products are also overestimated in the FLIP survey: 58.4% vs. 45.6%. These differences can most likely be explained by differences in the question wording and calibration variable.
The demand for shares: first results
Table 7 presents the results of the econometric analysis of explanatory variables for the demand for shares (with reference to the optimal portfolio choice model): level of wealth, level of income per consumer unit, age, qualifications, saver preferences on scales from 0 to 10 (high to low risk aversion and high to low time preference), and financial literacy measured either by the score of the number of correct answers to the twelve questions or, alternatively, the usual Big Three indicator (Level 1). The coefficients given in the table represent the marginal effects of the different variables estimated by Probit models, i.e. their quantitative impact on the dependent variable: the probability that shares will be dominant in financial assets.
Insert Table 7
Financial literacy clearly significantly raises the demand for shares irrespective of the financial literacy measure. When individuals answer the Big Three variables correctly, the probability that the majority of their financial assets will be shares increases 9.5 points. A one-point increase in the 12-position financial literacy score increases the frequency of the dependant variable by 2.3 probability points. This effect is to be compared with other variables’ effects, which are sometimes quantitatively greater, especially the level of assets: the probability of individuals investing the bulk of their assets in shares is 23,5 points higher among the richest (wealth over 750,000 euros) than among the less well-off (wealth less than 150,000 euros). As expected, the least risk-averse households have a greater demand for shares: +2.1 probability points per level of aversion (across eleven positions from 0 to 10) for a risky portfolio.
One criticism that could be made of Table 7’s regressions concerns the statistical biases induced by the introduction of the measurements of financial literacy with respect to the variable studied (Lusardi & Mitchell, 2014). First, there is the causality bias in that it could be the fact of investing in shares that actually increases financial knowledge (reverse causality). Second, there is the endogeneity bias since certain individual characteristics affect both the level of financial literacy and the demand for shares. Lastly, there is the measurement error bias, since the variables used here are merely “proxies” of the “real” level of financial knowledge.
These biases can be corrected by conducting the same regressions as those in Table 6, but using what is termed an instrumental variables estimation method. This said, dealing with endogeneity implies to have valid and relevant instruments for the advanced financial literacy index. According to the results of table 4, we choose two instruments for financial literacy: the level of education of the respondent and the existence of an economic curriculum. While these variables are relevant instruments meaning that they are correlated with the endogenous variable and not correlated with the exogenous variable, their validity is to be discussed.
Insert Table 8
Table 8 reports GMM regression results for stock asset demand. Instrumenting financial literacy increases its coefficient (see table 7 with OLS estimates), thereby correcting for a global downward bias. In both regressions, the Hansen J statistic test shows that the instruments are valid but the endogeneity test concludes that advanced financial literacy is exogenous. First stage regressions reveal a significant correlation between advanced financial literacy and the instruments. The F-statistics uncover a strong joint significance of the instruments as it is above the threshold recommended to avoid weak instruments problem (Staiger and Stock, 1997)
Instrumenting for the level of financial literacy shows that the previous conclusions are robust: the positive effect of financial literacy remains positive and significant to explain the demand for shares. To sum up, Table 7 and 8 shows that although financial literacy clearly plays a role in investors’ portfolios, it is one determinant among others. If public policymakers seek to steer savings toward riskier savings, they might consider improving the economic knowledge of young savers. However, this is far from a miracle cure (Arrondel & Masson, 2014) … Other leverage could be used: taxation, transaction costs, information, risk culture, optimism, etc.
5. Financial literacy: a cure-all?
Some of the most illustrious economists have put forward the role of financial literacy as a “cure” for certain economic problems: lack of growth (Phelps), financial crises (Shiller) and wealth inequalities (Lusardi). Some even suggest that governments should provide for financial education for the public to improve national economic knowledge. Others propose putting in place education programmes from a young age. Yet is all this effective? Some studies doubt it (Hasting et al., 2013).
On a more modest level, this article has studied the question of the low level of risky investments in household portfolios. This concerns, more generally, the issue of the allocation of household savings and long-term investments (Arrondel & Masson, 2017).
Although the French public present a high level of financial savings (around 15% of households’ disposable income), these savings are considered overcautious and insufficiently risky. The subprime mortgage crisis strengthened this tendency: direct share purchasing fell by approximately 50% from 2008, the start of the great recession, to 2016. Although 2017 saw a slight trend upturn, the number of individual shareholders stands at some 3.5 million today, at just over 7% of the adult population. This lack of interest in risky investments is not specific to France, as less than 9% of households in the euro area hold listed shares. This perplexes political and economic players who are concerned about the lack of financing for the productive sector and long-term investment in our economy.
Why do savers prefer risk-free investments to such an extent and how can they be drawn back to the stock market? The answers are to be sought in the causes, beyond the simple reasons usually put forward of too much taxation and excessive transaction costs. Why are the French too risk averse? Is their perception of their financial or professional prospects so gloomy that they have turned their backs on the stock exchange? Do they really have the “level” for it? Are they just “scared”? These questions are of interest as much to academic circles as financial players (Arrondel & Masson, 2017).
The reasons commonly advanced by professionals can be summed up in six points. The first two concern household demand: (1) lack of financial knowledge and literacy and a lack of appetite for risk, if not “desire for” long-term risky financial savings for ideological reasons; and (2) French households’ lack of trust, whether “general” (pessimism about their personal situation or the economic climate) or “specific” (distrust of their bank). The next two points have to do with tax and regulatory constraints: (3) heavy taxation on income from shares in France; and (4) increasingly restrictive prudential regulations. The last two points concern the investment supply: (5) mismatch of the supply of banking and financial advice (lack of transparency and information on the products offered and flawed or biased customer knowledge); and (6) overly timid product innovation, where products need to be developed based on the concept of “savings for projects” tailored to the different phases of the saver’s life cycle (housing, professional career, preparation for retirement, with French-style pension funds, dependency, and even inheritance).
Academic research, based on field surveys, can be used to check and measure the relevance of these answers. The studies covered in this article put forward the French people’s low level of financial literacy as a brake on risky investments by savers. Legislation could then improve financial literacy, even if it takes time and would appear to more effectively target the young. Statistically, financial illiteracy does appear to be one of the factors explaining the low level of household investment in shares. Yet other factors also appear to be determinants, in particular the level of wealth and risk tolerance. In addition, international comparisons have not found a clear relationship between the overall level of financial literacy and the number of shareholders: for example, German households appear to be less financially illiterate than French households, but are no greater in number to invest in shares.
A public incentive policy in support of risky investments should therefore consider other solutions: trust shock, social insurance for certain risks (retirement, longevity, etc.), and so on. However, it should also focus not only on the general public’s financial literacy, but also on the financial literacy of financial consultants.
The French Financial Market Authority (AMF) explains the steady drop in the number of shareholders since the 2008 crisis as being due in part to advice from banks being decreasingly share-oriented (Castanet, 2018). Financial consultant training therefore emerges as an important objective, at least as much as savers’ financial literacy (Debbich, 2016).
So should savers’ financial literacy be improved? Why not? Yet let’s not take this “You are your own CFO” idea too far: if you ask individuals to improve their financial knowledge to manage their finances, why not study medicine to manage their health or take a course in car mechanics to repair their car? Nothing should replace the expertise of a doctor, a car mechanic or, and this is what interests us here, a financial consultant. However, it is becoming increasingly complicated in our societies to “read the financial world”, and we therefore need to improve the financial knowledge of financial consultants. This argument ties in with Joseph Stiglitz (Nouvel Observateur, March 2010) who, echoing Shiller (2008) with respect to saver incompetence prior to the crisis (see the introduction), also chose to seek the causes on the other side of the equation, considering that financiers failed out of incompetence and avarice: they set up a remuneration system encouraging excessive risk-taking and short-sighted behaviour!
References
Agnew J. R., Bateman H. & Thorp S. 2013. Financial Literacy and Retirement Planning in Australia, Numeracy, 6, No. 2.
Almenberg, J. & Säve-Söderbergh, J. 2011. Financial literacy and retirement planning in Sweden. Journal of
Pension Economics & Finance, 10(4), 585–598.
Arrondel, L., Calvo-Pardo H., Giannitsarou C. & Haliasos, M. 2019. Informative Social Interactions, mimeo. Arrondel, L., Debbich, M. & Savignac, F. 2013. Financial Literacy and Financial Planning in France. Numeracy, 6:2, Article 8.
Arrondel, L., M. Debbich, & Savignac, F. 2015. Stockholding in France: the Role of Financial Literacy and Information, Applied Economics Letters, 22, No.16, 1315-1319.
Arrondel, L. & Masson, A. 2006. Altruism, Exchange or Indirect Reciprocity: What Do the Data on Family Transfers Show?, in The Economics of Giving, Reciprocity and Altruism, Mercier-Ythier J. & S. C. Kolm eds., North Holland, Chapter 14, 971-1053.
Arrondel, L. & Masson, A. 2014. Mesurer les préférences des épargnants : comment et pourquoi (en temps de crise) ?, Economie et Statistique, 467-468, 5-49.
Arrondel, L. & Masson A. 2017. Why does household demand for shares decline during the crisis? The French case, Economics and Statistics, 494-495-496, 155-178.
Banque de France. 2018. Publication des résultats du sondage : « Les Français et l’économie », 1 page.
Barber, B. M. & Odean T. 2001. Boys will be boys: gender, overconfidence, and common stock investment.
Quarterly Journal of Economics, 116(1): 261–292.
Beckmann, E. 2013. Financial literacy and household savings in Romania. Numeracy, 6(2).
Boisclair, D., Lusardi, A. & Michaud, P.C. 2017. Financial literacy and retirement planning in Canada. Journal of
Pension Economics & Finance, 16(3), pp. 277-296.
Bucher-Koenen, T. & Lusardi, A. 2011. Financial literacy and retirement planning in Germany. Journal of
Pension Economics & Finance, 10(4), 565–584.
Bucher-Koenen, T. & Lamla B. 2018. The Long Shadow of Socialism: On East-West German Differences in Financial Literacy, Economic Notes, 47(2-3), pp. 413-438.
Castel R. (2011). Les ambiguïtés de la promotion de l’individu, in Refaire Société, P. Rosenvallon (ed.) Paris, La République des idées.
Castanet, C. 2018. AMF : « Il est indispensable de prendre un peu de risque ». Revue Banque, n°826, 20-22. Cazenave-Lacrouts, M. C., Guillas, D. & Lebrault, G. 2018. Le patrimoine des ménages en 2018 : Repli de la détention de patrimoine financier, Insee Première, n° 1722.
Christelis, D., Jappelli, T., Padula M., 2010. Cognitive abilities and portfolio choice, European Economic Review. 54, 18-38.
Crossan, D., Feslier, D. & Hurnard, R. 2011. Financial literacy and retirement planning in New Zealand. Journal
of Pension Economics & Finance, 10(4), 619–635.
Debbich, M. 2016. Why Financial Advice Cannot Substitute for Financial Literacy?, Banque de France Working
Paper, 534.
Fornero E. 2015. Economic-financial Literacy and (Sustainable) Pension Reforms: Why the Former is a Key Ingredient for the Latter, Bankers, Markets & Investors, 134, January-February, p. 6-16
Fornero, E., & Monticone, C. 2011. Financial literacy and pension plan participation in Italy. Journal of Pension
Economics & Finance, 10(4), 547–564.
Friedman, M. 1953. Essays in Positive Economics. University of Chicago Press.
Kalmi, P. & Ruuskanen, O. P. 2017. Financial literacy and retirement planning in Finland. Journal of Pension
Economics & Finance, 17(3), 1–28.
Moure, N. G. 2016. Financial literacy and retirement planning in Chile. Journal of Pension Economics & Finance, 15 (2), p. 203-223.
Garon, S. 2011. Beyond Our Means: Why America Spends While the World Saves, Princeton University Press. Gollier, C. 2001. The Economics of Risk and Time, MIT Press, Cambridge.
Gollier C. 2013. "Édito", Les cahiers Louis Bachelier, n°8, février.
Guiso, L. & Jappelli, T. 2005. Awareness and Stock Market Participation. Review of Finance 9, 537-567 Guiso, L. & Jappelli, T. 2007. Information Acquisition and Portfolio Performance. EUI WP ECO 2007/45. Guiso, L., Sapienza, P. & Zingales, L. 2004. The Role of Social Capital in Financial Development. American
Economic Review. 94(3), 526-556.
Guiso, L., Sapienza, P. & Zingales, L. 2008. Trusting the Stock Market. Journal of Finance. 63(6), 2557-2600. Guiso, L. & Sodini, P. 2013. Household Finance: An Emerging Field, Handbook of the Economics of Finance,
chap. 21.
Grinblatt, M., Keloharju, M. & Linnainmaa, J. 2011. IQ and Stock Market Participation. Journal of Finance. 66 (6), 2121-2164.
Haas, P. 2012. Les Français et l’économie, Bulletin de la Banque de France, n° 190.
Haliassos, M. 2003. Stockholding: Recent Lessons from Theory and Computations, in Guiso, L., M. Haliassos, & T. Jappelli (Eds.), Stockholding in Europe, Palgrave Macmillan Publishers, 30-51.
Haliassos, M., Bertaut, C. 1995. Why Do So Few Hold Stocks? Economic Journal. 105(432),1110-1129.
Hasting, J. S. Madrian B. C. & Skimmyhorn W. L. 2013. Financial Literacy, Financial Education and Economic Outcomes, Annual Review of Economics, Annual Reviews, 5(1), 347-373.
Hong, H., Kubik, J. Stein, J. 2004. Social Interaction and Stock-Market Participation. Journal of Finance. 59(1), 137-163.
Jappelli, L. & Padula, M. 2013. Investment in financial literacy and saving decisions. Journal of Banking &
Finance. 37(8), 2779-2792.
Jouini, E., Benmansour, S. & Napp C. 2006. Is there a "pessimistic" bias in individual beliefs? Evidence from a simple survey, Theory and Decision, 61 (4), 345-362.
Kalmi, P. & Ruuskanen, O.P. 2017. Financial literacy and retirement planning in Finland. Journal of Pension
Economics & Finance, pp. 1-28.
Klapper, L. & Panos, G. A. 2011. Financial literacy and retirement planning: The Russian case. Journal of
Pension Economics & Finance, 10(4), 599–618.
Kocherlakota, N. R. 1996. The Equity Premium: It's Still a Puzzle, Journal of Economic Literature, 34 (1): 42–71. Lusardi A. (ed.), 2009. Overcoming The Saving Slump: How to Increase the Effectiveness of Financial Education
and Saving Programs, Chicago, University Of Chicago Press.
Lusardi A. 2019. Financial literacy and the need for financial education: evidence and implications, Swiss
Journal of Economics and Statistics, 155:1.
Lusardi, A. & Mitchell O. S. 2011. Financial Literacy and Retirement Planning in the United States, Journal of
Pension Economics and Finance, 10, No. 4, pp. 509-525.
Lusardi, A. & Mitchell O. S. 2014. The Economic Importance of Financial Literacy: Theory and Evidence.
Journal of the Economic Literature, 52 (1), 5-44.
Lusardi, A. Michaud, P. C. & Mitchell, O. S. 2017. Optimal Financial Knowledge and Wealth Inequality, Journal
of Political Economy, 125(2), 431-477.
Mehra, R. & Prescott, E. C. 1985. The Equity Premium: A Puzzle, Journal of Monetary Economics 15 (2): 145– 161.
Merton, R.C.1969. Lifetime Portfolio Selection under Uncertainty: the Continuous Time Case. Review of
Economic Studies. 51, 247-257.
Modigliani, F. & Brumberg, R. 1954. Utility Analysis and the Consumption Function: an Interpretation of Cross-section Data, in Post-Keynesian Economics, K.K. Kurihara ed., Rutgers University Press, 388-436.
Nicolini, G. 2019. Financial Literacy in Europe: Assessment Methodologies and Evidence from European Countries, Routledge, 284 pages.
OCDE 2005. Pour une meilleure éducation financière : enjeux et initiatives, 178 pages. OECD 2016. International Survey of Adult Financial Literacy Competencies, 96 pages. Phelps, E. S. 2017. La Prospérité de masse, Odile Jacob, Paris.
Saint-Paul, G. 2012. Liberté et société post-utilitariste, TSE Working Papers 12-339.
Sekita, S. 2011. Financial literacy and retirement planning in Japan. Journal of Pension Economics & Finance, 10(4), 637–656.
Shiller R. J. 2008. The Subprime Solution: How Today's Global Financial Crisis Happened, and What to Do about
It, Princeton University Press.
Staiger, D. & J. H. Stock. 1997. Instrumental Variables Regression with Weak Instruments. Econometrica, 65, 557–586.
Thaler, R. H. 2000. From Homo Economicus to Homo Sapiens. Journal of Economic Perspectives, 14(1): 133-141. van Rooij, M. C., Lusardi, A. & Alessie, R. J. 2011a. Financial literacy and retirement preparation in the Netherlands. Journal of Pension Economics and Finance, 10(4), 527–545.
van Rooij, M. C., Lusardi A. & Alessie R. J. 2011b. Financial literacy and stock market participation. Journal of
Financial Economics, 101,449-472.
Vissing-Jorgensen, A. 2004. Perspectives on Behavioural Finance: Does Irrationality Disappear with Wealth? Evidence from Expectations and Actions, in M. Gertler and K. Rogoff eds., The NBER Macroeconomics Annual, Cambridge: MIT Press.
QB1 – quiz_01
Suppose you had $100 in a savings account and the interest rate was 2% per year. After 5 years, how much do you think you would have in the account if you left the money to grow?
1. More than €102
2. Exactly €102 3. Less than €102
[DK][RF]
QB2 – quiz_02
Imagine that the interest rate on your savings account was 1% per year and inflation was 2% per year. After 1 year, how much would you be able to buy with the money in this account?
1. More than today
2. Exactly the same as today
3. Less than today
[DK][RF]
QB4 – quiz_04
Buying a single company’s stock usually provides a safer return than a stock mutual fund. 1. True
2. False
[DK][RF]
QB6 – quiz_06
Let’s say you borrow €200 over two years from a bank that charges you 2% interest. After two years, how much do you think you will have to pay to reimburse your loan?
1. More than €204
2. Exactly €204 3. Less than €204
[DK][RF]
QB7 – quiz_07
Let’s say that your savings account earns an annual interest rate of 4% and the annual rate of inflation is 4%. After a year, your savings will buy you
1. More than today
2. Exactly the same amount as today
3. Less than today [DK][RF]
QB9 – quiz_09
Compared with an investment in shares, the risk of investing in a mutual fund is… 1. Higher
2. The same
3. Lower
[DK][RF]
QB16 – quiz_16
Let’s say that you have €100 in a savings account earning an annual interest rate of 10%. After two years, how much do you think you would have if you left this money to grow?
1. €110 2. €120
3. €121
[DK][RF]
QB17 – quiz_17
If your bank pays an interest rate of 4% per year on your savings account in which you have invested €100, what do you think the rate of inflation should be for you to maintain your purchasing power over the next two years?
1. 0% per year
2. No more than 4% per year
3. No more than 8% per year [DK][RF]
QB19 – quiz_19
Which of the following investment strategies should you choose as an investor if you want to double your financial assets in a very short space of time?
1. A money market mutual fund 2. A stock mutual fund
3. Shares in a single company
[DK][RF]
QB21 – quiz_21
What is the annual rate of interest (annual percentage rate, APR) for a €100 loan on which you have to pay back €110 the following month? 1. 10% 2. Around 120% 3. More than 200% [DK][RF] QB22 – quiz_22
Let’s say the rate of inflation was 20% last year. If an underground train ticket (index-linked to the cost of living) costs €2.40 today, how much did it cost last year?
1. €1.92
2. €2.00
3. €0.48 [DK][RF]
QB24 – quiz_24
Let’s say you invested €1,000 last year in a highly diversified stock mutual fund. If, over the same period, the stock market index (i.e. the index for the market in which this fund is invested) increases 5%, how much should you earn on your investment?
1. Less than €5 2. More than €500
3. Around €50
Financial literacy in France: different measures
Source: FLIP Survey
Interpretation: 63.12% of respondents answered Question 07 of the quiz correctly.
Level 1 Big_three_1
quiz_01 Frequency quiz_02 Frequency quiz_04 Frequency Frequency
More than €102 84.08 More than today 6.72 TRUE 7.84
Exactly €102 5.51 Exactly the same as today 10.73 FALSE 40.66 No correct answer 9.01
Less than €102 3.65 Less than today 63.95 Refuse to answer 1.11 1 correct answer 23.89
Refuse to answer 1.51 Refuse to answer 1.07 Don't know 48.73 2 correct answers 35.21
Don't know 5.07 Don't know 16.10 Did not answer 1.67 All correct 31.89
Did not answer 0.17 Did not answer 1.43
Total 100.00 100.00 100.00 100.00
Level 2 quiz_06 quiz_07 quiz_09 Big_three_2
More than €204 63.62 More than today 6.79 Higher 10.11
Exactly €204 18.12 Exactly the same amount as today 63.12 The same 7.64
Less than €204 5.14 Less than today 6.84 Lower 26.42 No correct answer 14.61
Refuse to answer 0.93 Refuse to answer 1.33 Refuse to answer 1.48 1 correct answer 31.82
Don't know 9.75 Don't know 20.54 Don't know 53.34 2 correct answers 38.37
Did not answer 2.44 Did not answer 1.39 Did not answer 1.01 All correct 15.20
Total 100.00 100.00 100.00 100.00
Level 3 quiz_16 quiz_17 quiz_19 Big_three_3
€110 5.10 0% per year 8.04 A money market mutual fund 8.23
€120 34.23 No more than 4% per year 51.19 A stock mutual fund 16.02
€121 51.26 No more than 8% per year 3.06 Shares in a single company 13.29 No correct answer 30.06
Refuse to answer 0.98 Refuse to answer 1.51 Refuse to answer 1.37 1 correct answer 31.22
Don't know 7.41 Don't know 35.35 Don't know 59.64 2 correct answers 30.97
Did not answer 1.01 Did not answer 0.84 Did not answer 1.45 All correct 7.75
100.00 100.00 100.00 100.00
Level 4 quiz_21 quiz_22 quiz_24 Big_three_4
10% 42.08 €1.92 21.69 Less than €5 2.66
Around 120% 22.65 €2.00 51.28 More than €500 2.94
More than 200% 6.57 €0.48 2.32 Around €50 54.07 No correct answer 27.56
Refuse to answer 1.46 Refuse to answer 1.31 Refuse to answer 2.21 1 correct answer 35.46
Don't know 25.20 Don't know 22.60 Don't know 37.40 2 correct answers 33.57
Did not answer 2.05 Did not answer 0.81 Did not answer 0.72 All correct 3.41
100.00 100.00 100.00 100.00
Table 3: Descriptive statistics on financial literacy questions worldwide
Source: Lusardi (2019)
Interpretation: 44.80% of Dutch individuals answered the Big Three questions correctly.
Correct Don't know Correct Don't know Correct Don't know
Lusardi & Mitchell (2011) 1,488 2009 64.90% 13.50% 64.30% 14.20% 51.80% 33.70% 30.20% 42.40%
van Rooij, Lusardi & Alessie(2011) 1,665 2010 84.80% 8.90% 76.90% 13.50% 51.90% 33.20% 44.80% 37.60%
Bucher-Koenen & Lusardi (2011) 1,059 2009 82.40% 11.00% 78.40% 17.00% 61.80% 32.30% 53.20% 37.00%
Sekita (2011) 5,268 2010 70.50% 12.50% 58.80% 28.60% 39.50% 56.10% 27.00% 61.50%
Agnew, Bateman & Thorp (2013) 1,024 2012 83.10% 6.40% 69.30% 13.00% 54.70% 37.60% 42.70% 41.30%
Crossan, Feslier & Hurnard (2011) 850 2009 86.00% 4.00% 81.00% 5.00% 49.00% 2.00% 24.00% 7.00%
Brown and Graf (2013) 1,500 2011 79.30% 2.80% 78.40% 4.20% 73.50% 13.00% 50.10% 16.90%
Fornero & Monticone (2011) 3,992 2007 40.00% 28.20% 59.30% 30.70% 52.20% 33.70% 24.90% 44.90%
Almenberg & Säve-Söderbergh (2011) 1,302 2010 35.20% 15.60% 59.50% 16.50% 68.40% 18.40% 21.40% 34.70%
Arrondel, Debbich & Savignac (2013) 3,616 2011 48.00% 11.50% 61.20% 21.30% 66.80% 14.60% 30.90% 33.00%
Klapper & Panos (2011) 1,366 2009 36.30% 32.90% 50.80% 26.10% 12.80% 35.40% 3.70% 53.70%
Beckmann (2013) 1,030 2011 41.30% 34.40% 31.80% 40.40% 14.70% 63.50% 3.80% 75.50%
Moure (2016) 14,463 2009 47.40% 32.10% 17.70% 20.90% 40.60% N/D 7.70% 53.10%
Boisclair, Lusard & Michaud (2017) 6,805 2012 77.90% 8.80% 66.18% 16.13% 9.36% 31.29% 42.50% 37.23%
Kalmi & Ruuskanen (2017) 1,477 2014 58.10% 6.10% 76.50% 6.40% 65.80% 10.25% 35.60% 14.00%
Russia
Finlande Romania Chili Canada
Studies Country Sample size
Australia N. Zealand Switzerland Italy Sweden France 3 correct answers At least one don't know USA Netherlands Germany Japan
Source: FLIP Survey
Interpretation: 41.10% of individuals less than 35 years old answered the standard Big Three questions correctly (Big_three_1). Chart 2 0 5 10 15 20 25 30 35 40 45 50
Big_three_1 Big_three_2 Big_three_3 Big_three_4
<Sec Sec Higher
0 5 10 15 20 25 30 35 40 45
Big_three_1 Big_three_2 Big_three_3 Big_three_4
Male Female 0 5 10 15 20 25 30 35 40 45
Big_three_1 Big_three_2 Big_three_3 Big_three_4
Self-assessment of level of financial literacy (%)
Source: FLIP Survey
Interpretation: 21.46% less women assess their financial knowledge at Level 4
Table 4
Financial literacy and individual characteristics (OLS)
Note: Reference categories: Less than 35 years old, Less than secondary education qualification, Left wing, No book read in the last year.
Interpretation: Being over 65 years old increases the average number of correct answers to the Big Three by 0.6075.
0 5 10 15 20 25 30 1 2 3 4 5 6 7 Male Female
Coef. t Coef. t Coef. t
Male 0.4482 12.54 0.3817 6.80 1.608 14.29 35 to 50 years 0.2855 4.77 0.0833 0.88 0.777 4.35 50 to 65 years 0.5119 8.38 0.3373 3.50 1.420 7.97 Over 65 years 0.6075 8.97 0.4390 4.12 1.777 8.94 Secondary education 0.2610 5.09 0.0170 0.21 0.786 4.87 Higher education 0.5147 11.54 0.1135 1.62 1.941 14.06 Economics course 0.2943 7.41 0.6226 10.00 0.879 7.32 Centre 0.0193 0.49 0.2921 4.71 0.109 0.87 Right-wing 0.0910 1.92 0.3862 5.21 0.622 4.16 One book read in the last year 0.1307 2.77 -0.0606 -0.81 0.488 3.38 Two books read in the last year 0.2576 4.61 0.0152 0.17 0.890 5.18 More than two books read in the last year 0.1996 3.23 -0.0284 -0.29 0.737 3.89 Constant 0.8992 12.59 2.3626 20.89 2.327 11.06 Number of observations
R2
Big three Self-assessment Score
2233 0.250 2233 0.210 2233 0.093
Chart 3
Number of correct answers to the four levels of questions (%)
Source: FLIP Survey
Interpretation: 11.78% of individuals obtain a score of 8.
Table 5
Number of correct answers to the four levels of questions (average)
Source: FLIP Survey
Interpretation: The men answered 5.05 (of 12) questions correctly on average. 0 2 4 6 8 10 12 14 0 1 2 3 4 5 6 7 8 9 10 11 12
Average
Male
6.45
Female
5.05
<35 years
4.70
35-50 years
5.79
50-65 years
5.91
>65 years
6.42
<Sec
5.05
Sec
5.41
>Sec
6.91
Table 6
Distribution of gross wealth and financial assets
Source: FLIP Survey
Interpretation: 4.8% of households have financial assets in the €75 000-150 000 bracket
Interpretation: Median gross wealth is €158,001 Table 7
Overall wealth Total Respondents
Cumulative respondents Less than €8,000 10.0 19.0 19.0 €8,000 to €14,999 2.8 5.3 24.3 €15,000 to €39,999 2.2 4.2 28.5 €40,000 to €74,999 1.7 3.2 31.7 €75,000 to €149,999 4.9 9.3 40.9 €150,000 to €224,999 8.7 16.4 57.3 €225,000 to €299,999 6.3 11.9 69.2 €300,000 to €449,999 8.0 15.1 84.3 €450,000 to €749,999 4.9 9.3 93.6 €750,000 and over 3.4 6.4 100.0 Don't know 22.8 Refuse to answer 24.4 100.0 266,000 Financial assets Less than €1,500 12.6 21.1 21.1 €1,500 to €2,999 7.9 13.2 34.2 €3,000 to €7,999 8.1 13.5 47.7 €8,000 to €14,999 5.6 9.3 57.0 €15,000 to €29,999 7.6 12.7 69.8 €30,000 to €44,999 4.6 7.7 77.5 €45,000 to €74,999 4.1 6.8 84.3 €75,000 to €149,999 4.8 8.0 92.3 €150,000 to €249,999 2.5 4.2 96.5 €250,000 and over 2.1 3.5 100.0 Don't know 23.1 Refuse to answer 16.9 100.0 43,500
Estimated value (centre of bracket)
Estimated value (centre of bracket)
Percentiles Minimum Average Minimum Average
0-25 -389 7,220 -8,899 667 25-50 20,950 81,320 1,952 5,749 50-70 158,001 215,829 11,639 20,197 70-90 277,963 391,382 31,300 59,688 90-99 595,723 930,876 109,035 223,057 99-100 1,953,081 4,111,445 578,333 1,754,677 Total 269,053 55,337
Source: 2014 INSEE Household Wealth Survey
Gross Wealth Financial Assets
Financial literacy and demand for shares (probit model)
Note: Reference categories: Assets of less than €150,000, Income per unit of account less than €1,650, Less than 35 years old, Less than secondary education qualification.
Interpretation: Answering the Big Three questions correctly increases the probability that shares will predominate in financial assets by 9.47 points.
Table 8
Financial literacy and demand for shares: IV regressions (linear probability model)
Probit Marginal
effect t
Probit Marginal
effect t OLS effect t OLS effect t
Assets from €150,000 to €225,000 0.030 0.94 0.029 0.88 0.015 0.52 0.015 0.55
Assets from €225,000 to €300,000 0.066 1.87 0.074 2.05 0.041 1.30 0.048 1.52
Assets from €300,000 to €450,000 0.070 2.10 0.083 2.40 0.060 1.94 0.067 2.17
Assets from €450,000 to €750,000 0.158 3.84 0.196 4.58 0.153 4.32 0.172 4.88
Over €750,000 0.234 4.82 0.272 5.40 0.257 6.37 0.273 6.79
Income per UA from €1,650 to <€1,900 -0.010 -0.30 -0.002 -0.06 -0.010 -0.31 -0.007 -0.21 Income per UA from €1,900 to <€2,200 0.013 0.42 0.025 0.74 -0.003 -0.10 0.009 0.28 Income per UA from €2,200 to <€2,500 0.017 0.51 0.029 0.81 0.003 0.08 0.012 0.34 Income per UA from €2,500 to <€3,200 0.022 0.75 0.031 1.01 0.013 0.41 0.022 0.70
Income per UA €3,200 and over 0.048 1.69 0.061 2.07 0.054 1.79 0.062 2.07
35 to 50 years -0.070 -2.34 -0.067 -2.20 -0.065 -1.91 -0.060 -1.77 50 to 65 years -0.033 -1.08 -0.034 -1.10 -0.022 -0.65 -0.022 -0.66 Over 65 years -0.028 -0.90 -0.031 -0.98 -0.025 -0.67 -0.026 -0.71 Risk aversion (0 to 10) 0.021 5.56 0.021 5.55 0.024 5.67 0.023 5.53 Time preference (0 to 10) 0.007 1.65 0.008 1.85 0.006 1.41 0.007 1.59 FL score (0 to 12) 0.023 5.83 0.022 5.83 Big_three_1 0.095 4.99 0.096 4.87 Number of observations Pseudo-R2or R2 0.158 0.165
Preponderance of shares in financial assets
1241 1241 1241 1241
0.200 0.189
Coef. t Coef. t Coef. t Coef. t
Assets from €150,000 to €225,000 0.232 1.10 0.012 0.55 0.049 1.18 0.009 0.41 Assets from €225,000 to €300,000 0.911 4.00 0.032 0.95 0.145 3.10 0.032 0.95 Assets from €300,000 to €450,000 1.050 4.44 0.050 1.41 0.179 3.87 0.046 1.24 Assets from €450,000 to €750,000 1.562 5.93 0.138 2.80 0.191 3.76 0.148 3.12
Over €750,000 1.482 5.52 0.241 4.15 0.214 3.85 0.244 4.14
Income per UA from €1,650 to <€1,900 0.328 1.26 -0.014 -0.49 0.054 1.11 -0.014 -0.47 Income per UA from €1,900 to <€2,200 0.608 2.51 -0.010 -0.29 0.034 0.72 0.003 0.09 Income per UA from €2,200 to <€2,500 0.411 1.45 -0.001 -0.04 0.015 0.29 0.009 0.23 Income per UA from €2,500 to <€3,200 0.765 3.46 0.006 0.16 0.104 2.27 0.009 0.26
Income per UA €3,200 and over 0.813 3.76 0.045 1.21 0.129 2.95 0.046 1.23
35 to 50 years 0.726 2.70 -0.070 -2.07 0.118 2.50 -0.070 -2.08 50 to 65 years 0.861 3.22 -0.025 -0.75 0.166 3.49 -0.032 -0.92 Over 65 years 0.985 3.44 -0.027 -0.71 0.195 3.73 -0.035 -0.90 Risk aversion (0 to 10) 0.060 1.81 0.023 5.13 0.019 3.17 0.021 4.45 Time preference (0 to 10) 0.083 2.49 0.005 1.31 0.011 1.83 0.006 1.40 Constante 3.792 11.35 -0.199 -2.62 -0.039 -0.69 -0.079 -2.10 FL score (0 to 12) 0.030 1.99 Big_three_1 0.197 1.98 Secondary education 0.257 1.21 0.030 0.73 Higher education 1.045 5.71 0.112 3.22 Economics curriculum 0.580 3.89 0.139 4.74 Number of observations R2
F-statistic 1st stage reg. Hansen J test p-value Endogeneity test p-value
First step GMM First step GMM
Preponderance of shares in financial assets
1241 1241 0.147 0.140 1241 1241 0.222 0.162 23.38 0.9205 0.5897 15.54 0.9867 0.2889