HAL Id: hal-01461902
https://hal.inria.fr/hal-01461902
Submitted on 8 Feb 2017
HAL is a multi-disciplinary open access
archive for the deposit and dissemination of
sci-entific research documents, whether they are
pub-lished or not. The documents may come from
teaching and research institutions in France or
abroad, or from public or private research centers.
L’archive ouverte pluridisciplinaire HAL, est
destinée au dépôt et à la diffusion de documents
scientifiques de niveau recherche, publiés ou non,
émanant des établissements d’enseignement et de
recherche français ou étrangers, des laboratoires
publics ou privés.
Neuroscience
Marianne Allanic, Alexandre Durupt, Marc Joliot, Benoît Eynard, Philippe
Boutinaud
To cite this version:
Marianne Allanic, Alexandre Durupt, Marc Joliot, Benoît Eynard, Philippe Boutinaud. Application
of PLM for Bio-Medical Imaging in Neuroscience. 10th Product Lifecycle Management for Society
(PLM), Jul 2013, Nantes, France. pp.520-529, �10.1007/978-3-642-41501-2_52�. �hal-01461902�
Application of PLM for Bio-Medical Imaging in
Neuroscience
Marianne Allanic1,2,3 , Alexandre Durupt1 , Marc Joliot2 , Benoit Eynard1 ,
Philippe Boutinaud3
1 Universit´e de Technologie de Compi`egne, Department of Mechanical Systems Engineering CNRS UMR 7337 Roberval, 60200 Compigne, France, 2 UMR5296 GIN CNRS CEA Universit´e de Bordeaux, 33000 Bordeaux, France,
3 CADeSIS, 37 rue Adam Ledoux, Bat. B, 92400 Courbevoie, France marianne.allanic@utc.fr
http://www.plm-conference.org
Abstract. Bio-medical imaging (BMI) is currently confronted to simi-lar issues than those of manufacturing industries twenty years ago : the growing amount of data, the heterogeneity and complexity of informa-tion coming from diverse disciplines, have to be handled by various actors belonging to different organizations. The researchers of the GIN (Neu-roimaging Functional Group) laboratory study brain maps of anatomical and functional cognitive activation of hundred-subject cohorts, acquired with Magnetic Resonance Imaging (MRI). Therefore they want to man-age the whole process of their research studies, from raw data to analysis results. Even if some data management systems have been developed to meet the requirements of BMI large-scale research studies, there are still many efforts to do in the integration of all the data and processes along a research study, from raw to refined data. So, the use of the Product Life-cycle Management (PLM) concepts to handle the complexity and charac-teristics of BMI data is proposed. A PLM neuroimaging datamodel that has been designed in collaboration between the GIN laboratory, Rober-val laboratory and Cadesis company to meet the needs of the GIN, is described.
Keywords: PLM ; bio-medical imaging (BMI) ; knowledge management ; neuroscience
1
Introduction
Bio-medical imaging (BMI) domain is currently confronted to similar issues than those of manufacturing industries twenty years ago. The inherent complexity of biological data has always challenged researchers, as they have to deal with many data sources, natures and types of processing [6]. However, with the recent tech-nological improvements in imaging devices, but also networking and computing, the data handled by researchers has remarkably evolved. The size and amount of data have increased significantly, as huge cohorts of patients are required to
draw strong inferences. In addition, more and more crossing analyses (eg. imag-ing, behavioral and genetics data together) are performed. Thus, there is a need of a unique, efficient and mature data management system.
The imaging technologies have reach a plateau which guarantee BMI data consistency at least for several years; it allows the data to be reused for longitu-dinal studies or any other purpose. However, costs, time and difficulty of leading BMI studies are not decreasing. So researchers would be rewarded to move to-ward a more synthesis-oriented research strategy: some types of studies should focus on the synthesis of previous findings [19]. Capitalizing the data among laboratories and institutions is an evident solution to get sufficient data, but it raises traceability, collaborative and confidentiality issues.
Product Lifecycle Management (PLM) software solve these issues, and per-mits manufacturing industry to stay efficient and competitive. Consequently, PLM systems promise to be adequate tools for the management of BMI data coming from large-scale studies that handle heterogeneous data. The data of a neuroimaging laboratory, the GIN1, is chosen as an application; the neuroscience
field is particularly active concerning imaging data management and constitutes a fertile ground for the work presented in this paper. Firstly, a state-of-the-Art of BMI efforts to design relevant data management tools is proposed. Secondly, interests of BMI field for PLM is developed. Thirdly, a proposal of a PLM neu-roimaging datamodel is presented. To end with, discussion and perspectives for future work conclude this paper.
2
State-of-the-Art
2.1 BMI data management tools
According to the authors of [18], the BMI scientific community must be provided with methods to query, analyze and crosslink the complex, heterogeneous and large-scale image data resources. Several sizeable database, with more or less success, show the commitment of the BMI research field.
For 15 years, the neuroimaging community has been aware of the need of neuroinformatics to advance its understanding of the brain (human and non-human): because of the growing amount of data to handle and the trend for collaborative studies, proper management and sharing has become crucial. Sev-eral solutions have been developed by networks of laboratories (BIRN, MRN, INCF, NIDAG2), aiming at designing adequate tools. In addition, projects
de-velop their own tools, combining design of a database and large-scale imaging acquisitions: the Human Connectome Project (HCP, [16]) and the Human Brain Project (HBP, [14]) are such projects.
1
Groupe d’Imagerie Neurofonctionnelle/ Neurofunctional Imaging Group
2 Biomedical Informatics Research Network http://www.birncommunity.org/, Mind
Research Network http://www.mrn.org/, International Neuroinformatics Co-ordinating Facility http://www.incf.org/, Neuroimaging Data Access Group http://www.nidag.org/
The IFIP WG5.1 10th International Conference - PLM13
All databases were not designed with the same purposes in mind, thus do not manage the data at the same stage of a study. A proposition of four phases of data analysis are presented in figure 1: 1 study specifications (everything that define a research study and its proceedings), 2 raw data (or acquired data),
3
derived data (both refined and final results), and 4 published data (peer-reviewed data recognized by the community). Neuroimaging databases can be divided in two categories; although many handle raw and processed data (phases
2
and 3 ) accompanied by associated metadata for study management, others aim to share published results (phase 4 ) for future reuse:
– The first category of database permits researchers to manage locally and to share between sites and laboratories during large-scale studies. The types of handled data are demographic data in addition to imaging data. The most often used database tools by individual and collaborative projects3are
XNAT4[9], LORIS [2], COINS [13] and IDA [17].
– The second category focuses on results coming from peer-reviewed published papers. Activation coordinates with associated metadata are the most fre-quent managed data in these databases. In some ways, published results databases, in particular BrainMap [4], supplement the literature by provid-ing a unusual consistency of description, required for reuse: it appears that the information provided by the authors of papers to meet the requirements of such databases are sometimes more complete and precise than what is written in the original papers [3].
Nevertheless, no data management tool enables heterogeneous data manage-ment from study specifications 1 to published results 4 . Currently no database handles phase 1 ; even LORIS, which seems to be the most completed, doesn’t manage it, neither published data 4 . The figure 1 shows the distribution of the existing neuroimaging database tools: they all stay focused on no more than two phases. Though, neuroimaging field has now a global understanding of its acquisition and processing workflows [5], [9], [12]. Few data management tools now integrate the management of workflows (XNAT, IDA, Connectome map-ping toolkit [5]) between phases 2 and 3 . In the figure 1, these workflows are represented by the arrow ”processing”.
2.2 Product Lifecycle management and BMI
Product Lifecycle management (PLM) is summarized by [15] as a ”product cen-tric - lifecycle-oriented business model, [...] in which product data are shared among actors, processes and organizations in the different phases of the product lifecycle”. Three phases define PLM [8]: the design and manufacturing phase is the Beginning-of-life (BOL), the distribution and use phase is the Middle-of-life (MOL), and the retired phase is the End-of-life (EOL). However, a common
3 As observed in published papers 4
http://xnat.org/about/xnat-implementations.php
Fig. 1. Distribution of the existing neuroimaging database tools, according to our proposition of four phases of data analysis and the three level of sharing: local, collab-orative and public. The area encompassed by dotted line represents the scope of our proposal in this paper
lifecycle model cannot be applied for all the product type, depending on their complexity.
Originated from the car industry, PLM has now been widely adopted by the whole manufacturing industry world, including pharmaceutical domain, for in-stance the Roche5 company. Nevertheless, PLM has not yet been widely set up
in the medical field, except for prosthesis design and manufacturing: each pros-thesis is one-patient customized and thus designed with BMI 3D reconstructions based on scanned images of the patient. Tornier, Groupe Lepine or Mount Kisco Medical Group 6 are example of companies using PLM to manage the lifecy-cle of each product, whatever the types of the documents: imaging, computer aided-design (CAD) or text.
3
PLM for BMI data management
3.1 Interests of BMI field for PLM
Laboratories evolve in a competitive environment that can be compared to com-petitiveness in industry : researchers have to publish noteworthy papers to get
5
http://www.roche.fr
6 http://www.tornier.com/, http://www.groupe-lepine.com/,
The IFIP WG5.1 10th International Conference - PLM13
the financial grants that will allow them to lead the next studies. In addition, col-laborative research is crucial to obtain significant analysis and to take advantage of skills from other research teams. An efficient and integrated data management system is a solution to gain time and to produce more complex analysis. PLM is precisely used in industry to help producing better (innovative products) and faster (reduction of the duration of the product development cycle) to cut costs and stay competitive.
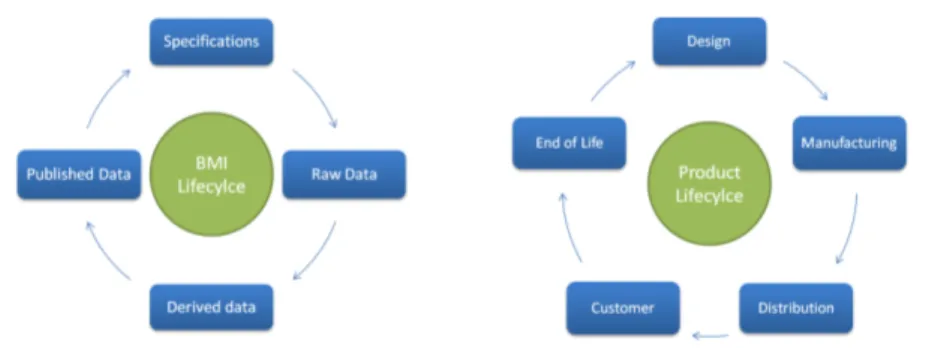
Although it is not recognized yet as a lifecycle by the community, BMI phases can be modeled from 1 to 4 as a cycle. Indeed, published results constitute a basis on which to design the next studies, from both definition and processing points of view. The figure 2 shows the parallel between BMI lifecycle and the traditional PLM lifecycle. Due to the non-material nature of BMI in fundamental research studies - there is no resulting material product, so no manufacturing phase -, the PLM EOL phase cannot be applied: as long as the images are consistent and can be read and processed, there is no obsolescence. BMI phases
1
to 3 are the BOL and phase 4 is the MOL.
The quality of information coming from the workflows between two phases (Acquisition, Processing and Peer-review, see figure 1) is essential for the reusing - or repurposing - of data at any stage in a new context. This information is called provenance by the BMI community. So, reuse of previous data is an aim shared by the BMI domain and the manufacturing industry, and is one of the features of a PLM system: providing the right information at the right time and in the right context. When PLM systems matured from PDM (Product Data Management), they went from managing documents to the management of enterprise concepts ; the purpose of the work presented in this paper is to bring forward a similar kind of evolution in the BMI field.
Other disciplines, such as genetics7demonstrated that large-scale public shar-ing is a requirement for fast scientific advances in a research field [19]. Not only the PLM has not been designed for public sharing, but there are still some prop-erty rights issues or Protected Health Information (PHI) constraints that slow down data exchanges. Nonetheless, PLM is dedicated to data sharing among sites and thus can handle access restrictions needed by BMI for local and collab-orative management (e.g. only a physician can access subject’s individual clinical data).
An important distinction between BMI and industry is the required flexibility for BMI concerning the data model. Design and manufacturing processes and methods are mature and remain globally the same, whereas imaging computing technologies (between phases 2 et 3 ) are continuously evolving, as well as research protocols.
3.2 PLM features applied to BMI
The following PLM features meet the needs of BMI data management and solve frequent issues:
7
GenBank: http://www.ncbi.nlm.nih.gov/genbank/
Fig. 2. Schemes of the BMI lifecycle and the traditional PLM lifecycle
– Business Object (BO) revision: keeps a track of the updates of processing definitions, computing codes...
– Workflow: notably allows the researchers to add BMI quality validation pro-cesses.
– Classification of BO: brings knowledge structuring but also flexibility to the data model, as the classification enables BOs to be associated with non-permanent attributes that can be easily defined by the users. This implies a reduction of the number of BO, and each BO represents a general concept that is robust enough to bear future changes of the data model.
– Advanced query and report generation: allows the user to run complex searches among the data and to export it for processing and analysis. – User roles and access management: manage Protected Health Information
(PHI) and property rights.
3.3 Deployment methodology
The following methodology is proposed to deploy a PLM-based data manage-ment system to the BMI field.
The existing data management system is taken as a basis for the design of the first implementation of the PLM solution. Some end-users (key experts in neuroimaging research) are trained with the resulting tool that is provided with data. This first step is required to understand the lacks of the previous data management system and the needs of the researchers, in addition to the study of the literature. On the other hand, it allows end-users to think about their own practices and to get involved in the design process, which is important to ensure that reluctant users to new tools will use them. Specifications are written from all these feed-backs.
Then a classical AGILE methodology is deployed to manage successive design loops, from the requirement definition to the functionality test by end-users. Processing and analysis worflows will be translated into the model progressively, so that an integrated data management and analysis system will be obtained in the end.
The IFIP WG5.1 10th International Conference - PLM13
4
Application
4.1 The BIL&GIN dataset and GINdb data management system The researchers of the GIN laboratory study brain maps of anatomical and functional cognitive activations of hundred-subject cohorts, acquired with MRI8.
Therefore they want to manage the whole process of their research studies, from raw data to analysis results. In 2010, the laboratory designed its own data man-agement system, called GINdb, and which is a relational database that manage metadata and paths to related files [7]. The GIN first Brain Imaging Laterality dataset (BIL&GIN1) includes 300 subjects, balanced by gender and handedness. This dataset was acquired between 2009 and 2011 and managed using GINdb [11].
However, the laboratory wants to improve its data management system, to get a more integrated environment that handle data and metadata during the whole life of a study, and that enables the data to be repurposed, e.g. for longi-tudinal studies.
4.2 PLM Neuroimaging datamodel
Based on the GINdb data management tool, the litterature and interviews of key-users of the GIN, a first PLM object-oriented neuroimaging datamodel is defined. Globally, the business objects (BOs) are divided in two categories which constitute a basis for data property rights and PHI preservation :
– The BOs that can be created at any time and used for any study: unique subject in database, imaging and non-imaging exam definition, processing definition, computing tool, acquisition device, imaging template and bib-liographical reference. All of these BOs are concepts and definitions that are used to justify all the data that is produced during the whole lifecycle of a study. The information resulting from the association of objects, via relations, is called provenance of data.
– The BOs that can be created only inside a study: these objects contain sub-ject’s individual context data (subject demographic and clinical information) and result data (non-imaging and imaging exam, processing) of subjects, as well as result data of groups of subjects (processing). The BO study gathers data such as ethical research comity reports and Protected Health Informa-tion (PHI) policy. Raw data is stored in a hierarchical structure of three BOs: exam (temporally uninterrupted row of acquisition), acquisition (indivisible period of data collection), and data unit (single data).
A visual summary of our proposal of a general neuroimaging data organiza-tion is given in figure 3; it highlights the category of BOs outside study (red), as well as subject’s individual BOs (green) and cross subjects BOs (blue). In figure
8 Magnetic Resonance Imaging: medical imaging technique to visualize internal
struc-tures of the body
Fig. 3. Schema of the proposed neuroimaging data model. The red Business Objects (BOs) are the ones created outside a study. The other ones are created only inside a study, and can be divided in two groups: the BOs related to subject’s individual data (green) and the BOs related to multi-subject’s data (blue).
4, a simplified UML schema of the relationships between the BO that are used in figure 3 is presented with their cardinalities. This data model supports BMI data management during the four phases of the BMI lifecycle; all needed metadata and information for a potential reuse can be stored in the BOs. The concepts associated to each BO are general enough to enable any type of subject’s data (e.g. imaging, genetics, behavioral...) to be managed.
Fig. 4. Simplified UML schema of the proposed neuroimaging data model: the relation-ships between the Business Objects (BOs) are shown, with their cardinality. A mention is added on each BO to indicate whether it can be created inside or outside a research study. Imagery, Genetics, Processing, and Analysis BO are representing groups of BO.
The IFIP WG5.1 10th International Conference - PLM13
5
Discussion and perspectives
In this paper, PLM was shown to fulfill most of the need of the neuroscience field in BMI data management. The proposed neuroimaging data model allows heterogeneous data of BMI studies to be stored from the specifications of the studies to the resulting publications. The model has been implemented into a PLM software tool, and test sessions of the resulting database by the researchers of the GIN laboratory with a real dataset are planned.
A limitation of our actual works is the sharing of the data to an extended community: even if a PLM light web client exists, licenses to connect to the database and users training are required, which prevents from occasional use. So in the future, a simplified and more adequate non-licensed user interface has to be developed.
Besides, traditional PLM systems are not as flexible as required by research practices, so as a following work we will propose a semantic enrichment, based on ontology, and that will handle the management of relationships between objects [1]. As the understanding of these relationships is complex, a second point in our upcoming works will be to visualize them by graphs, in order to improve navigation as well as the visualization of data provenance in the resulting data management tool.
By all these developments for neuroscience field, we aim at achieving a BMI-dedicated module for PLM and at enhancing some PLM features as a feedback.
Acknowledgments The authors wish to thank in particular the Association Nationale de la Recherche et de la Technologie (ANRT) for its financial support to their work (CIFRE 2012/0420).
References
1. I. Assouroko, G. Ducellier, B. Eynard, and P. Boutinaud. Semantic relationship knowledge management and reuse in collaborative product development. 9th In-ternational Conference on Product Lifecycle Management, Qu´ebec, 2012.
2. S. Das, A. P. Zijdenbos, J. Harlap, D. Vins, and A. C. Evans. LORIS: a web-based data management system for multi-center studies. Frontiers in neuroinformatics, 5:37, Jan. 2011.
3. P. T. Fox, A. R. Laird, S. P. Fox, P. M. Fox, A. M. Uecker, M. Crank, S. F. Koenig, and J. L. Lancaster. BrainMap taxonomy of experimental design: description and evaluation. Human brain mapping, 25(1):185–98, May 2005.
4. P. T. Fox and J. L. Lancaster. Mapping context and content: the BrainMap model. Nature reviews. Neuroscience, 3(4):319–21, Apr. 2002.
5. S. Gerhard, A. Daducci, A. Lemkaddem, R. Meuli, J.-P. Thiran, and P. Hagmann. The connectome viewer toolkit: an open source framework to manage, analyze, and visualize connectomes. Frontiers in neuroinformatics, 5:3, June 2011. 6. C. Goble and R. Stevens. State of the nation in data integration for bioinformatics.
Journal of biomedical informatics, 41(5):687–93, Oct. 2008.
7. M. Joliot, N. Delcroix, L. Zago, M. Vigneau, F. Crivello, G. Simon, L. Petit, M. R. Turbelin, M. Naveau, F. Lamberton, P.-Y. Herv, G. Jobard, E. Mellet, B. Mazoyer, and N. Tzourio-Mazoyer. GINdb: portable database for the storage and processing of human functional brain imaging data. Proceedings of the 16th Annual Meeting of the Organization for Human Brain Mapping Barcelona, Spain, 2010.
8. D. Kiritsis, A. Bufardi, and P. Xirouchakis. Research issues on product lifecycle management and information tracking using smart embedded systems. Advanced Engineering Informatics, 17(3-4):189–202, July 2003.
9. D. S. Marcus, T. R. Olsen, M. Ramaratnam, and R. L. Buckner. The Extensible Neuroimaging Archive Toolkit and Sharing Neuroimaging Data. Neuroinformatics, 00:11–34, 2007.
10. S. C. Neu, K. L. Crawford, and A. W. Toga. Practical management of heteroge-neous neuroimaging metadata by global neuroimaging data repositories. Frontiers in neuroinformatics, 6:8, Mar. 2012.
11. L. Petit, F. Crivello, E. Mellet, G. Jobard, L. Zago, M. Joliot, B. Mazoyer, and N. Tzourio-Mazoyer. BIL&GIN: a database for the study of hemispheric special-ization. Proceedings of the 18th Annual Meeting of the Organization for Human Brain Mapping, Beijing, China, 2012.
12. J.-B. Poline, J. L. Breeze, S. Ghosh, K. Gorgolewski, Y. O. Halchenko, M. Hanke, C. Haselgrove, K. G. Helmer, D. B. Keator, D. S. Marcus, R. a. Poldrack, Y. Schwartz, J. Ashburner, and D. N. Kennedy. Data sharing in neuroimaging research. Frontiers in neuroinformatics, 6:9, Apr. 2012.
13. A. Scott, W. Courtney, D. Wood, R. de la Garza, S. Lane, M. King, R. Wang, J. Roberts, J. a. Turner, and V. D. Calhoun. COINS: An Innovative Informatics and Neuroimaging Tool Suite Built for Large Heterogeneous Datasets. Frontiers in neuroinformatics, 5(December):33, Jan. 2011.
14. G. M. Shepherd, J. S. Mirsky, M. D. Healy, M. S. Singer, E. Skoufos, M. S. Hines, P. M. Nadkarni, and P. L. Miller. The Human Brain Project: neuroinformatics tools for integrating, searching and modeling multidisciplinary neuroscience data. Trends in neurosciences, 21(11):460–8, Nov. 1998.
15. S. Terzi, B. Abdelaziz, B. Butta, M. Garetti, and D. Kiritsis. Product lifecycle management from its history to its new role. International Journal of Product Lifecycle Management, 4(4):360–389, 2010.
16. D. C. Van Essen, K. Ugurbil, E. Auerbach, D. Barch, T. E. J. Behrens, R. Bucholz, a. Chang, L. Chen, M. Corbetta, S. W. Curtiss, S. Della Penna, D. Feinberg, M. F. Glasser, N. Harel, a. C. Heath, L. Larson-Prior, D. Marcus, G. Michalareas, S. Moeller, R. Oostenveld, S. E. Petersen, F. Prior, B. L. Schlaggar, S. M. Smith, a. Z. Snyder, J. Xu, and E. Yacoub. The Human Connectome Project: a data acquisition perspective. NeuroImage, 62(4):2222–31, Oct. 2012.
17. J. D. Van Horn and A. W. Toga. Is it time to re-prioritize neuroimaging databases and digital repositories? NeuroImage, 47(4):1720–34, Oct. 2009.
18. T. Walter, D. W. Shattuck, R. Baldock, M. E. Bastin, A. E. Carpenter, S. Duce, J. Ellenberg, A. Fraser, N. Hamilton, S. Pieper, M. a. Ragan, J. E. Schneider, P. Tomancak, and J.-K. H´erich´e. Visualization of image data from cells to organ-isms. Nature methods, 7(3 Suppl):S26–41, Mar. 2010.
19. T. Yarkoni, R. a. Poldrack, D. C. Van Essen, and T. D. Wager. Cognitive neu-roscience 2.0: building a cumulative science of human brain function. Trends in cognitive sciences, 14(11):489–96, Nov. 2010.