HAL Id: cea-02045950
https://hal-cea.archives-ouvertes.fr/cea-02045950
Submitted on 22 Feb 2019HAL is a multi-disciplinary open access archive for the deposit and dissemination of sci-entific research documents, whether they are pub-lished or not. The documents may come from teaching and research institutions in France or abroad, or from public or private research centers.
L’archive ouverte pluridisciplinaire HAL, est destinée au dépôt et à la diffusion de documents scientifiques de niveau recherche, publiés ou non, émanant des établissements d’enseignement et de recherche français ou étrangers, des laboratoires publics ou privés.
Renewal of the interfero-polarimeter diagnostic for
WEST
C. Gil, G. Colledani, M. Domenes, D. Volpe, A. Berne, F. Faisse, C. Guillon,
J. Morales, P. Moreau, B. Santraine
To cite this version:
C. Gil, G. Colledani, M. Domenes, D. Volpe, A. Berne, et al.. Renewal of the interfero-polarimeter diagnostic for WEST. Fusion Engineering and Design, Elsevier, 2019, 140, pp.81-91. �10.1016/j.fusengdes.2019.02.003�. �cea-02045950�
1
Renewal of the interfero-polarimeter diagnostic for WEST
C.Gil, G. Colledani, M. Domenes, D. Volpe , A. Berne , F. Faisse, C. Guillon, J. Morales, P. Moreau, B. Santraine and the WEST team
CEA, IRFM, F-13108 Saint-Paul-lez-Durance, France
Christophe.gil@cea.fr Key word: tokamak, FIR diagnostic, interferometry, polarimetry
In the frame of the WEST tokamak upgrade project, the Tore Supra combined interferometer-polarimeter diagnostic has been modified to fit the geometry and constraints induced by the implementation of divertor coils in the vacuum vessel. For a good spatial resolution of the plasma, as the vertical ports are now partially obstructed, 8 infrared beams go through a common horizontal port and are retro-reflected on an inner panel and 2 vertical port retro-reflected channels, with specific vacuum mirrors close to the divertor, could be implemented to diagnose the edge plasma.
The electronics and the data acquisition have also been renewed to improve the reliability and precision of the measurements. Novel digital electronics with embedded interferometric and polarimetric algorithms produce 1ms data outputs for real time control.
The diagnostic has routinely been operated during the first WEST campaigns. In this article, we detail the new arrangement and discuss the first results with plasma.
1) Introduction
On fusion plasma tokamak machines, the measurement of the electron and current density can be obtained by interferometry and polarimetry technics, using the information given by Far Infrared (FIR) laser beams crossing the plasma [1]. On the French Tore Supra tokamak, a ten channel poloidal Interfero-polarimeter routinely run till 2011, using the following principle of measurement [2-3]: There are 3 dedicated detectors for each channel. After exiting the plasma, each probing FIR beam is recombined with a 100 KHz frequency shifted beam in front of the detectors to deliver synchronous amplified signals that are measurable in phase and amplitude.
On the interferometry part, the line integrated electron density (LID) is calculated for each channel using the phase information Φ of two probing beams that have different wavelengths 𝜆 (195 and 119 microns). They are superposed to cross the plasma and then they are separated toward the detectors [ref 3 p. 1228]. This double phase information enables to calculate the LID by eliminating the path length component in equation (1).
Φ = 2.82 × 10⁻¹⁵ 𝜆 ∫ 𝑛𝑒(𝑙) 𝑑𝑙 + 2Π𝛿 𝜆 (1)
Where ne is the electron density, all parameters in MKSA unit.
On the polarimetry side, the Faraday Angle (FA) is obtained by measuring the rotation of polarization of a 195 micron wavelength beam through the plasma. A grid separates the 2 perpendicularly polarized output beams toward 2 distinct detectors, of which one is also used for interferometry [ref 3 p. 1237]. To take into account a possible elliptization of the beams, both amplitudes and relative phases are measured to calculate [4]:
2 tan (𝛼) = 𝐾abcos(ψ−ψ0)
a2 (
2
)Where a and b are the amplitudes of the 2 FIR beams, 𝜓 the relative phase and 𝜓0the initial one. K is a coefficient that is deduced from a quartz plate rotation calibration before each plasma.
Then one can calculate by the Ampere’s theorem the current density with the magnetic poloidal field that can be deduced from equation (3):
𝛼 = 2.62 × 10⁻¹³ 𝜆2∫ 𝑛
𝑒(𝑙) 𝐵//(𝑙) 𝑑𝑙 (3)
Where 𝐵// is the magnetic component parallel to the FIR beam propagation.
In the former Tore Supra configuration, there were five plasma traversing chords going through vertical ports and five chords through a horizontal port to be reflected on the inner wall by corner cube mirrors (CC). For WEST [6], a lower and an upper toroidal tungsten divertor, with their supporting structures implemented in the vertical ports, have been installed and the inner panels have been displaced. Therefore the chord trajectories of the beams inside the vessel had to be modified and optimized to recover a good spatial resolution. To minimize the cost, efforts have been done not to modify the optics in the laser source and detector areas.
To increase the precision and reliability of the diagnostic, a new digital electronics with FPGA processors has been installed. The embedded algorithms benefit from several year experiences on the JET tokamak, as they were initially developed and successfully tested for it [5]. An industrial PC has been configured to receive the output data from the boards, to calculate the LID and FA and to dispatch the results toward the WEST real time system and the WEST data base.
3 2) Mechanical modifications
2.1 Trajectories of the chords inside the vessel.
In order to reuse at most the former 10 channel diagnostic, 10 chords could be positionned to optimize the spatial resolution.The figure 1a shows the chord trajectories of the FIR beams inside the vessel with respect to a typical WEST plasma, in which the equally spaced in radius magnetic surfaces have been drown.
Figure 1: Beam chord trajectories in the plasma, a: Overview versus the magnetic surfaces, b: Normalized positions of the chords in the plasma
The chords are reflected by CC at approximately R=1.8 m, where R is the radial position in the torus vessel. 8 chords go through a common horizontal port. The windows are situated on the port flange at R= 4.5 m. The chords have been spaced in order to differently tangent the magnetic surfaces and thus to give a complete information on the plasma profile with a normalized spatial resolution of approximately 0.1 (figure 1b).
To complete the profile characterization and because the edge of the plasma cannot be seen from the 0.8 m high horizontal port, 2 chords go through a vertical port. The incoming beams are reflected by internal mirrors (chords 1 and 2 in figure 1b) before reaching a CC. One is for giving information on the plasma edge, the other one on the density inside the X point.
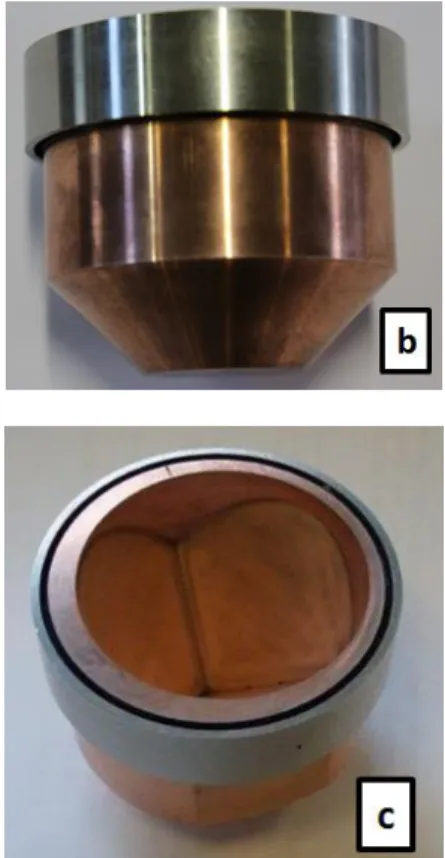
4 2.2 Corner cube mirrors
All the FIR beams are now reflected on CC inside the vessel. Figure 2a shows the 1300 mm high specific internal panel on which 9 CC could be fixed. Cooling water flows inside a sandwich of 2 stainless steel sheets at a temperature of 70-90°C during plasmas and up to 200°C when conditioning.
Figure 2: CC implantation, a: specific panel with the CC, b: outer CC view, c: inside CC view
To save space and ensure the water tightness, the CC are TIG welded onto the panel. Figure 2b and 2c show one CC. As in the previous Tore Supra configuration [2], the bulk part is made of Cu-Cr alloy to get a sufficient hardness. To allow the welding to the panel, a 62 mm Nickel ring is first welded outside the CC by electron beam. Then the print of the 3 perpendicular faces is dug by electro-erosion to obtain an optical diameter of 49 mm. The trihedral corners are dug perpendicularly to the incoming IR beams. But one CC is oriented on the bisector of the 8 degree angle formed by 2 incoming beams that share the same mirror. The 90 degree angles between the faces are manufactured with a precision of 50 second of arcs to obtain a low divergence of the reflected beam. Finally, the faces are manually polished down to a 10 micron peak to peak roughness. It is not good enough for visible reflection when alignment and thus movable optics had to be positioned outside the windows to send back the light and enable a visible alignment toward the detectors.
5 2.3 Windows
In the former Interfero-polarimeter set up, the windows were made of natural crystal quartz, brazed by gold bonding on the flanges [3]. 3 of them have been reused for the WEST configurations. As the number of channels increased in the horizontal port, one had to position 3 channels per window (figure 3).
Figure 3: Twin flange supporting the 2 synthetic quartz diameter 111.5 m disks
The quartz disks are now synthetic grown crystal, diameter 111.5 mm, optical axis perpendicular to the faces. They are tightened on by Helicoflex® joints and therefore can be easily replaced if failure.
To avoid spurious reflections that could reach the detector and spoil the measurement, the disks and supports are 1.5 degree oriented perpendicularly to the plane defined by the beams. The angles between the beams that share the same window vary from 3 to 5 degrees and the maximum incidence angle is 4.5 degrees on a quartz disk. Its thickness of 6959 microns is optimized by calculation of the transmission for the expected incident angles (figure 4).
Figure 4: Transmission of a 6959 micron thick Zcut crystal quartz,
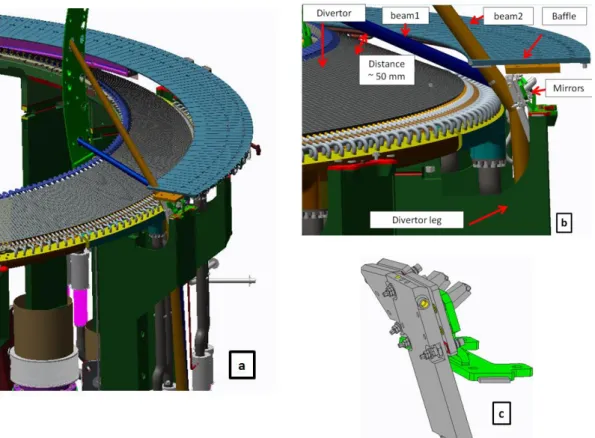
6 2.4 Edge channels
Although the WEST divertor support occults most of the vertical port and no direct line of sight to plasma is possible with the baffle, 2 channels could be installed to diagnose the edge plasma. Internal flat mirrors reflect the FIR beams towards the CC (figure 5).
Figure 5: Edge channels, a: General implantation, b: Zoom on the reflection under the baffle, c: Flat mirrors fixed on a common support
The 220X105mm and 110X85 mm flat mirrors are screwed on the divertor leg (figure 5b). They are made of stainless steel, polished at lambda for visible alignment and they can be orientated (figure 5c). They are presently inertial but will be actively cooled for the long pulse second phase of WEST. Channel 1 is almost parallel to the divertor, 50mm away, and thus the beam crosses the X point region. Channel 2 is pointing the 0.8-0.9 normalized radius plasma region and therefore completes the profile information, which is especially useful for electron density profile reconstruction. It crosses the baffle through a 30 mm diameter hole. Only interferometry signals are presently operational but polarimetry will be added in the future.
7 2.5 External FIR beam transport
The trajectory changes inside the vessel induced modifications of the ex-vessel FIR beam transport. Effort has been done to keep most of the diagnostic installation. The synoptic (figure 6) of the modified diagnostic is very similar with the former one given in [3].
Figure 6: Synoptic of the interfero-polarimeter adapted to the WEST configuration
8 The DCN and H2O laser sources remain unchanged as well as the analyser FIR beam set up and the 4K cryogenic detector installation. The former five traversing channels had to be transformed in reflected channels with new calibration tables and separating optics.
Out of the overall 450 existing optics, 90 had to be repositioned because of the different chord trajectories in plasma, among which 40 new mirrors, mainly the focusing ones. Their dimensioning has been done by considering the plasma refraction and the Gaussian beam expansion:
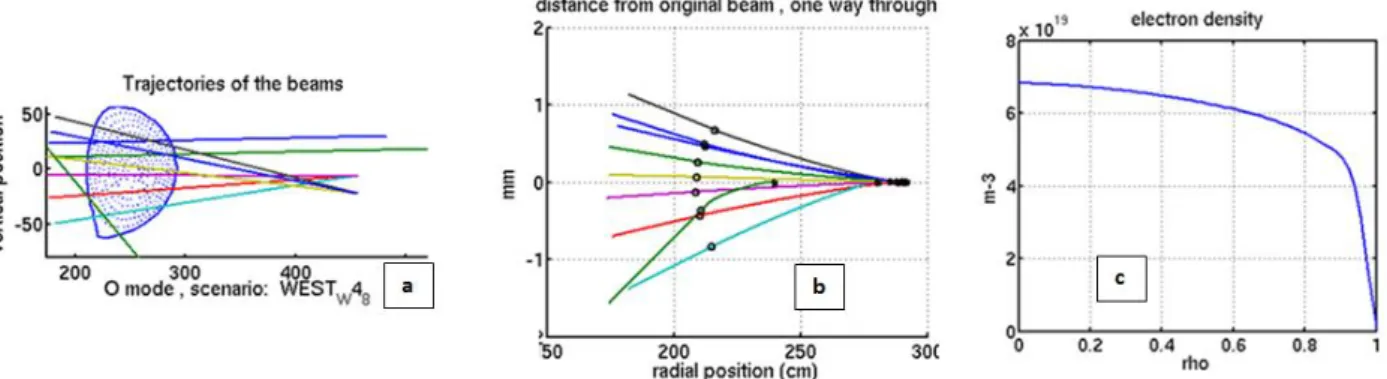
To calculate the refraction, the REMA raytracing code was used. It is adapted in wavelength from an electron cyclotron wave propagation code [8]. For the typical expected WEST electron density, the deviation is not more than 1.5 mm on the CC (figure 7 b) and therefore less than 3 mm on the output windows.
Figure 7: Calculated refraction, a: Chords in plasma, b: Beam deviation inside the plasma, c: Expected electron density profile
Gaussian beam calculations [1] were performed to focus on the CC while fitting the incoming FIR beam in size from the lasers and towards the detectors. Figure 8a gives an example for one channel at 195 micron wavelength: 4 new focus mirrors are needed. On the CC, the 1/e diameters of all the beams is always less than 14 mm. Therefore, the 3/e value of 42 mm, in which all the beam energy is contained, is lower than the 49 mm CC diameter. Possible refraction or misalignments will thus not induce beam losses. The external optics and windows have also been dimensioned at 3/e. Therefore the signals are not lost despite the induced deviations caused by 3 mm refractions in plasma. (figure 8b)
Figure 8: Channel 1 beam transport simulations from the laser the detector, a: Gaussian beam expansion, b: Induced deviation due to a 3 mm refraction
9 In the torus hall in front of the ports, 3 existing crates have been modified to position the new mirrors and their supports inside (figure 9) A new tower,2.5 m high, has been also added. It connects 3 channels to the former traversing channel detectors. It has an aluminium frame composed of welded 50 mm square section tubes. The base is screwed on steel girders that are fixed on the torus hall concrete to reduce at most the oscillations when plasma.
10 3) Modification of the signal processing
3.1 Electronics and acquisition system
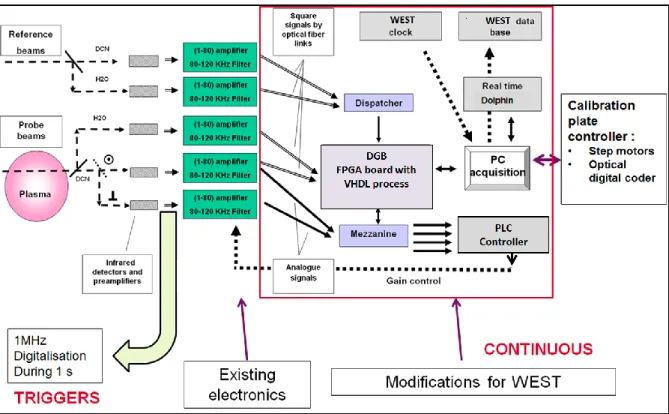
The new electronics arrangement is a mixing of the old electronics and acquisition with new ones, as seen in Figure 10:
Figure 10: Synoptic of the data processing for one channel
The detectors, the preamplifiers, the programmable amplifiers, the calibration system and the 1MHz data acquisition have been kept unchanged. But the first generation digital interferometric signal processing electronics had to be upgraded to implement more complex real time algorithms, in particular to correct fringe jumps. Moreover, the analogue polarimetric electronics and its 12 bit data acquisition was also to be improved to avoid long term component drifts and to gain precision. In the new settlement, for each channel, a unique digital board (DGB), which has been developed by CEA [7], calculates in real time the interferometric phases for the 2 wavelengths and the amplitude and phase values that are needed for polarimetry. A FPGA processor is embedded, which enables to program algorithms in VHDL language. For interferometry calculation, the inputs are the zero crossing times of the 100 KHz reference and probe sine signals. They are sent from the programmable amplifiers by optical fibres. For polarimetry, the analogue sine signals are digitalized in the Mezzanine and then are sent as inputs to the DGB. The Mezzanine also reconstructs the analogue amplitudes from the ones calculated in the DGB in order to control by industrial programmable logic controller the (1-80) amplifiers.
The DGB are connected to the WEST timing network to start the calculation and to date the measurements (figure 11). The sampling time of the output data is 1ms although the cycle time in the FPGA processor is governed by a 25 MHz clock, fast enough to both analyse the behaviour of the 100 KHz signals and to apply real time filtering
11 .
Figure 11: Interfero-polarimetry hardware integrated in the WEST network
The results are sent as dated packets via an Ethernet connection to a network switch and then transmitted to a new dedicated industrial PC computer, as the upgrade of the Real Time network in the frame of the WEST project required the old Tore supra VME units to be migrated to PC architecture. Its function is to transform the incoming measurements into the LID and FA values that are defined in equation 1 and 3. Algorithms check the result consistency before sending them at the sampling time of 1ms to the WEST real time shared memory network to be used as control and protection by other systems. The time delay that is induced by the PC calculations is at most 1ms. The PC also controls via FPGA acquisition boards the half-wavelength rotating quartz used for the polarimetry calibration that is performed before each pulse. At the end of the pulse, the PC transfers the DGB outputs to the WEST data base for post pulse analysis.
12 3.1 Methods of calculation employed in the DGB
The algorithms implemented in the DGB for WEST have been adapted from those initially developed for the JET tokamak interfero-polarimeter, which works at similar frequencies and wavelengths.
Figure 12: Principle of the of the interferometric phase real time calculation
The interferometric phase is reconstructed with the help of slow counters K and J and fast counters Nk and Ni (figure 12) that are trigged by the fronts generated when the sine signals cross zero : Φ = 2Π(K − J + Ni/Nk ) (4)
The K-J counting follows the 2 phase variations, which are called fringes. Non-physical fringe jumps can occur when the signal is lost or degraded. Therefore, an additional fast counter measures the probe signal time delay between 2 zero crossings to check the anomalies. When these are detected, the J counting is corrected, assuming that the phase change has been lesser than in 500 s [5]. From the experience of JET, where high frequency oscillations induced by plasma turbulence were observed on the probe signals and potentially could mislead the checking, a 5 KHz low pass filter is applied on the time delay counting before detecting the anomalies.
13 For polarimetry, the amplitudes and relative phase of the 2 perpendicularly polarized sine signals are calculated after digitalization (figure 13). After 80-120 KHz bandpass filtering, the 2 rectified signals are 586 Hz low pass filtered in 3 steps and 3 sub-samplings to obtain the amplitudes. Simultaneously, the straight multiplication of the 2 signals and low-pass filtering enables to obtain a value proportional to cos , where is the relative phase. The sin information is obtained by multiplying the first signal by the second one, whose value is taken some time steps before [4]. The 1.086 MHz
digitalization frequency has been chosen not to be an integer ratio of 100 KHz to avoid stroboscopic effects. Moreover, the sub-sampling ratios are defined to avoid layovers.
14 After the initial 16 bit digitalization, every second order filtering Sn at each time step n is done in 32 bits. It consists in a sum of polynomial terms that are calculated with the help of the previous n-i time values:
𝑆𝑛= 𝑎0𝑋𝑛+ 𝑎1𝑋𝑛−1+ 𝑎2𝑋𝑛−2+ 𝑏1𝑆𝑛−1+ 𝑏2𝑆𝑛−2 (5)
Where Xn is the initial signal, Sn the filtered signal and ai and bi the filter coefficients.
One can see in figure 13, in which the characteristics of the 80-120 KHz band pass filter are given, that the ai and bi coefficients are small and thus justify a 32 bit precision in the computation.
Figure 14: Real time 80-120 KHz band pass filter characteristics, a: High pass transmission, b: Low pass transmission, c: Transmission when the filtering is repeated twice.
The results of the multiplications of the 2 signals are in 64 bits not to lose the precision and then the low-pass filters are in 32 bits and the outputs as well.
15 4) Experimental results
The diagnostic has routinely been running during the 2017-2018 WEST restart campaigns and helped to improve the plasma performances up to a 10 s duration and a 3 × 10¹⁹ m-2 central LID.
4.1 Real time calculations.
Figure 15: WEST #53259 raw real time signals, a: Line integrated density, b: Faraday angles
As an example, on figure 15, one can see the 10 channel LID and the 8 channel FA that are calculated in real time in the PC. The 2 most central plasma LID (red curves almost superposed in fig15a) are routinely used for plasma gas injection control and to authorise the electromagnetic heating system power coupling. In figure 15 b, the 1ms rate FA have been averaged over 5 points
Figure 16: Averaged real time signals, a: Last Closed Surface at t=5s, b: Average electron densities (in 1019 m-3) and peaking factors.
With the help of the last closed surface (LCS) that is given in real time by the magnetics diagnostic [9] -figure 16a shows an example for pulse 53259 - , the distance of each chord in the plasma can be estimated to calculate the averaged LID. Moreover, the LID integration of the 8 almost horizontal channels along the vertical line defined by the centre of the plasma enables to calculate the volume average density by dividing by the surface, assuming that the LID is null on the LCS. The peaking
16 factor is the ratio of the average LID by the average volume density. It gives information on the peaking of the profile (figure 16 b).
The consistency of the measurements can be verified by plotting the LID and FA profiles versus the vertical position of the 8 almost horizontal chords found at radial position of 2.5 m (figure 17).
Figure 17: Vertical profile of the 8 almost horizontal channels, pulse 53259 at t= 5s, a: LID profile, b: FA profile.
As the LID information is mandatory to control the gas injection, it is important to have redundancy on the central LID information even when partial diagnostic failure. Channel 3 and 8 are almost central (superposed red curves on figure 15 a) and thus can be equally used if one fails. Moreover, if one of the lasers or detectors is out of order, the real time software automatically switches to the LID calculated with only one wavelength. The induced errors, due to the path length variations, are analysed in figure 18:
17 Figure 18: Path length variations during a pulse, a: 10 chord variations, b: Induced error on the central LID
Indeed, figure 18a shows there are significant path length oscillations only at the beginning and at the end of the pulse. They are correlated to sudden inversions of the current in the poloidal coils. The exceptions are the edge channels (figure 18a blue line) because the internal mirrors are fixed on a divertor leg and therefore vary with the divertor current. Therefore the central LID range error of a few 1018 m-2 (figure 18b) allows density control with one wavelength, except at the beginning of the pulse.
4.2 Post pulse processing
After each pulse, the LID and FA angles are recalculated. This allows correcting possible additional fringe jumps or failures not detected by the real time algorithms. During the first campaign, the plasmas were quiet enough, only L mode, not to generate fringe jumps that would be uncorrected by the DGB. The LID were only in default when the plasma was ending by a disruption, during which the FIR beams are strongly deviated from the detectors while the density strongly varies.
The 1MHz data acquisition is also used to diagnose fast variations of the electronic density. The interferometric phase is calculated with the digitalized sine signals by the same zero crossing technics as the electronics one. This allows a sampling time of 15 s. As the acquisition is not continuous but is composed of several triggered 1s data packets, the results of the calculations are mixed with the low acquisition to obtain an absolute LID. As an example, the slow and fast acquisitions are superposed during a ramp down (figure 19). A growing 6 KHz mode, followed by a crash, can be observed.
18 The post pulse calculated LID and FA are also used as inputs in equilibrium codes such as NICE [10]. They complete the magnetics diagnostic to constrain the equilibrium. Studies have started to validate the interfero-polarimetry contribution. The figure 20 is an example of the obtained magnetic surfaces with interfero-polarimetry inputs.
Figure 20: Magnetic surfaces obtained at t=5.1 s by the NICE code, red line: LCS , dash line: real time LCS
The consistency of the interfero-polarimetry measurements is analysed with the code outputs. Figure 21 is an example of the obtained electron density and safety factor profiles. Some discrepancies of the reconstructed LID and FA with the experimental measurements can be observed (figure 21 c and d). Indeed the value differences cannot be explained by the instrumental precision of the diagnostic: For interferometry, the counting of the phase with a 25MHz clock induces a precision 1/250 of a fringe for a 100KHz signal , which can be converted in a one way through LID precision of 3.2 × 10¹⁶m-2 . For this pulse, the measured LID typical noise that is calculated by standard deviation is 1 × 10¹⁷ m-2 before plasma and 2.5 × 10¹⁷ m-2 during the plasma plateau.
For polarimetry, the 32 and 64 bit calculations in the electronic boards provide high precision outputs. The 5 point averaged FA noise is typically 0.01 degrees before plasma and 0.02 degrees on the plateau. This leads to think that these values are due to the infrared beams intrinsic noise and are due to the plasma fluctuations as well.
Another possible error could be caused by the uncertainty on the alignment of the chords inside the plasma. As it is estimated to less than 1 cm, one can see on figure c and d that a 1 cm vertical displacement does not significantly help reducing the profile differences.
Therefore, the observed discrepancies need further investigations and cross checking with other diagnostics during the following plasma campaigns to get a better comprehension of the plasma.
19 Figure 21: NICE outputs for pulse 53259 at t=5.1s, a: Electron density profile, b: Safety factor profile, c: Vertical LID profile comparison, d: Vertical FA profile comparison
5) Conclusion
For the new WEST tokamak configuration, the diagnostic successfully modified the positions of the chords inside the plasma by adding plane mirrors and cooled retroreflectors inside the vessel and by modifying the beam transport outside the vessel whilst keeping a great part of the old optics and most of the initial mechanical structure. 10 channels could be reinstalled to achieve a 0.1 rho spatial resolution and a X point diagnose. Solutions such as shared windows and retroreflectors by several beams proved their efficiency to solve the lack of space issues.
The data processing has been improved for higher precision and reliability. The new digital boards with their embedded interferometric and polarimetric algorithms found to be efficient and trouble free. The new PC that is connected to the WEST real time network is now routinely working.
For 2 years the diagnostic has been routinely exploited for real time control. The post pulse analysis has started and will be continued during the next campaign. It is an efficient tool to be used for characterizing the electron density at different time scales and to contribute to the full consistency of the equilibrium codes.
20 For the next phase of WEST, which consists in long pulses with high heating power, only few internal mirrors will have to be modified and cooled.
References
[1] D. Veron , Infrared and Millimeter Waves, Button (ed) 1979 Vol 2 chap 2
[2] C. GIL et al., Retro-reflected channels of the Tore Supra FIR interfero-polarimeter for long pulse plasma operation, Fusion Eng. Des., 82, 1238 ~2007
[3] C. Gil and al TORE SUPRA Diagnostic Systems, p.1228 and p. 1237, Fusion Science and Technology VOL.(Oct. 2009)
[4] Brault C, Gil C, Boboc A, Spuig P,JET-EFDA Contributors, Evaluation of the Faraday angle by numerical methods and comparison with the Tore Supra and JET polarimeter electronics, Rev Sci Instrum. 2011 Apr 82(4):043502.
[5] C. Gil et al, Upgrade of the electronics of the JET far infrared interferometer .Fusion Engineering and design 88 (2013) p 1357
[6] J. Bucalossi et al, The WEST project: Testing ITER divertor high heat flux component technology in a steady state tokamak environment, Fusion Engineering and Design 89 (2014) 907–912
[7]A.Barbuti, C.Gil, P.Pastor, P.Spuig, B.Vincent, D.Volpe, Opportunist combination of electronics technologies for real time calculations in the Tore Supra tokamak,2013 3rd International Conference on Advancements in Nuclear Instrumentation, Measurement Methods and their Applications
(ANIMMA)
[8]V. Krivenski et al, Improving current generation in a tokamak by electron cyclotron waves, Nuclear Fusion 25, 127 (1985)
[9] P. Moreau et al,The new magnetic diagnostics in the WEST tokamak, Review of Scientific Instruments 89, 10J109 (2018).
[10] Blaise Faugeras et al, Equilibrium reconstruction at JET using Stokes model for polarimetry Nucl. Fusion 58 (2018) 106032