HAL Id: hal-03189516
https://hal.archives-ouvertes.fr/hal-03189516
Submitted on 6 Apr 2021
HAL is a multi-disciplinary open access
archive for the deposit and dissemination of
sci-entific research documents, whether they are
pub-lished or not. The documents may come from
teaching and research institutions in France or
abroad, or from public or private research centers.
L’archive ouverte pluridisciplinaire HAL, est
destinée au dépôt et à la diffusion de documents
scientifiques de niveau recherche, publiés ou non,
émanant des établissements d’enseignement et de
recherche français ou étrangers, des laboratoires
publics ou privés.
An ITER Challenge Absolute surface temperature
measurements of low and varying emissivity tungsten
plasma facing components
D. Guilhem, J. Gaspar, C. Pocheau, Y. Corre
To cite this version:
D. Guilhem, J. Gaspar, C. Pocheau, Y. Corre. An ITER Challenge Absolute surface temperature
mea-surements of low and varying emissivity tungsten plasma facing components. 28th IEEE Symposium
on Fusion Engineering, Jun 2019, jacksonvile, United States. �hal-03189516�
Abstract—
One of the challenges that ITER will face during plasma operation is the absolute divertor surface temperature determination of actively water cooled (70 °C, 3 MPa) tungsten Plasma Facing Units (PFU) to ensure their integrity. The expected steady state heat flux up to 10 MW/m² is close to the operational limit and so one of the goals of the thermographic system is to make reliable measurements (wavelength band: 3.5µm to 4.5µm) with relatively low error bars to avoid tungsten melting and material damages. The tungsten emissivity is low and dependent on wavelength, temperature, surface state (roughness, cracks, oxidation, and erosion/deposition processes) which can evolve during time along plasma operation. An error on the absolute emissivity can lead to large absolute temperature errors, and consequently to either a reduction of the operational window to fulfil safety limits, or an increase risk regarding the integrity of the components. For the past years, a number of emissivity measurements have been performed with ITER like PFU mock-ups made of different grade of tungsten, with different techniques, from different material makers, and from different manufacturers. The overall emissivity discrepancy is large, indicating that tungsten emissivity is a major issue for temperature measurement and wall protection. The accuracy on the temperature measurement is investigated for both monocolor and bicolor IR thermography techniques. We present laboratory tests performed with IR camera equipped with a rotating filter wheel for bicolor temperature measurement. It shows that the bicolor technique can reach high precision T/T < 10% at high temperature assuming the emissivity ratio is constant regarding the two selected wavelengths.Index Terms— Temperature, Emissivity, Tungsten, ITER, Plasma Facing Unit (PFU), Bicolor
This paragraph of the first footnote will contain the date on which you submitted your paper for review.
D. Guilhem CEA Cadarache, F-13108 St Paul lez Durance, France (e-mail: Dominique.guilhem@cea.fr)
J. Gaspar Aix Marseille Univ, CNRS, IUSTI, Marseille, France (e-mail: jonathan.gaspar@univ-amu.fr).
I. INTRODUCTION
n a tokamak the divertor is the component that is exposed to the highest heat loads of the machine, through its role of extracting the conducted/convected/radiated heat of the plasma. One of the main goals for ITER is the conception, the fabrication and the in-situ test for tungsten (W) actively cooled plasma facing components owing that the steady-state plasma heat flux can be as large as 10MW/m² (surface temperature ~1000 °C). The Edge Localized Mode (ELM) peak energy fluency values, when extrapolated to ITER [1], range from about 10 MJm−2 to 30 MJm−2, leading to W melding (T
Fusion =
3422 °C). Melting on ITER is of particular concern and probably the most striking unknown associated with the use of W divertor targets. This issue of material melting under transient heat fluxes is at concern. To exploit routinely and to protect these high risks plasma facing components, it is mandatory during plasma operation to evaluate in real time and if possible everywhere, the absolute 2D surface temperatures. The primary roles of the thermography systems in tokamaks are to provide machine protection, to ensure the basic control of the plasma and additional heating systems, to allow advanced controls of the plasma parameters, and finally to unfold from surface temperature measurements on plasma facing components, the heat flux and its e-folding length which are crucial information. The full metallic tokamak thermography systems have to determine experimentally the absolute surface temperature of the plasma facing components composed in ITER of 2 main sets, the divertor made of W actively cooled components (TFusion = 3422 °C) and the main chamber
protection made of actively cooled beryllium panels (TFusion =
1287 °C). The main challenge for the absolute surface temperature measurement of plasma facing components is the fact that these elements are metallic. The problem associated to metallic elements is that the emissivity is low (< 0.3) and varying with temperature T, with wavelength , with rugoses Ra, with presence of cracks, with melts, with deposits during the baking of the machine (350°C for the divertor), the conditioning (glow discharge or ion cyclotron heating), during plasma operation or in presence of helium in plasma by the
C. Pocheau CEA Cadarache, F-13108 St Paul lez Durance, France (e-mail: christine.pocheau@cea.fr)
Y. Corre CEA Cadarache, F-13108 St Paul lez Durance, France (e-mail: yann.corre@cea.fr)
An ITER Challenge
Absolute surface temperature measurements
of low and varying emissivity tungsten plasma facing components
D. Guilhem a, J. Gaspar b, C. Pocheau a, Y. Corre a and the WEST team a CEA Cadarache, F-13108 St Paul lez Durance, France
b Aix Marseille Univ, CNRS, IUSTI, Marseille, France
formation of a porous sponge-like layer [2, 3, 4, 5]. All these affects have an influence on the local emissivity and it is not possible in tokamaks to follow up permanently these phenomenons to be sure that we know precisely the local (pixel by pixel) emissivity of the plasma facing components over time during their lifetime. An error on absolute temperature associated to emissivity error, could lead to melting and/or water leaks.
The objective of this work is to propose a method to analyze the measurements (luminances), to unfold as precisely as possible the absolute surface temperature of the plasma component. The classical technique of the monocolor infrared thermography is subject to the knowledge of the emissivity of the tungsten emitting surface [6], which is depending of many parameters. The bicolor technique [7] largely mitigates the loose knowledge of the absolute emissivity of the surface (as function of wavelength, temperature, surface state, etc.). It depends on the ratio of the emissivities at 2 wavelengths, which is weakly varying with the temperature for metallic material. These techniques will be presented within metallic machine requirements (cooling loop at 70 °C and tungsten melting at 3422 °C). Emissivities measured during high heat flux test on JUDITH [26] and GLADIS [22] will be examined. Finally, monocolor and bicolor laboratory measurements done one ITER W sample will be compared up to 850 °C.
II. ITERREQUIREMENTFORTEMPERATURE
The primary role of a thermographic system is absolute surface temperature measurement, roles for which the diagnostic is deemed to be well suited. It falls in the categories of machine protection, basic control (plasma position), advanced control and finally physics measurements [8]. It means that a thermographic systems is deemed to make absolute surface temperature measurements with a goal of low relative error bars < 10% from 200°C < T < 3600°C. It is known [9, 10] that the surface temperature measurement of the plasma facing components in ITER will be difficult due to a number of facts: a harsh environment with tungsten material having a low (highly reflecting elements) and varying emissivity; a harsh environment with beryllium material, a highly reflecting element for first wall; a harsh environment with the presence of 14 MeV neutrons and gammas. The thermography measurement requirements are for tungsten divertor [11, 12]: 200 – 3600 °C; Time resolution (full frame): 2 ms; Accuracy: as good as possible < 10%; Mid wave infrared optimized cameras have wavelength band ranging from 3 to 5 µm. We will take into account these considerations for the optimization of the infrared thermographic system. One of the main challenges is the physical environment in which all these measurements have to be done: Unknown and changing optical properties (especially the tungsten emissivity) and thermal properties of the targets, first optical mirror degradation due to plasma deposits, specular reflection on the observed object from hot spots in the machine, diffuse light from the “sphere effect” (hot divertor in a highly reflective environment), bremsstrahlung emission from the plasma, or radiation effect on refractive optics (blackening) and camera detector (noise).
III. TUNGSTENEMISSIVITYEVOLUTION
Tungsten emissivity has long been studied [13, 14, 15, 16, 27] since this element is used to make radiating bulbs since the beginning of the 20th century. It is well known that the
emissivity of metals is evolving with wavelength and temperature.
A. ITER like W samples emissivity measurement
An experimental test bed has been developed in our laboratory for emissivity measurement. The sample is placed inside a vacuum vessel (diameter 350mm). The vacuum is required (< 10-5 Pa) to prevent any pollution/oxidation of the sample. A
radiant and electron bombardment heater is used to heat the sample. The W sample surface 12×18×3mm3 is heated up to
850°C. A sapphire window is used for the measurement of the sample surface by an IR camera in the wavelength range of 1.7-4.75µm. The emissivity is determine by the luminance measured by the IR camera and the thermocouple embedded in sample.
𝐿 (𝑇) = ∫ 𝐹(𝜆)
𝑑𝜆
(1)
Where 𝐿 (𝑇) is the measured luminance at temperature T (to be determined), 𝐹(𝜆) is the filter transmission at wavelength, TTc
is the temperature indicated by the thermocouple, and C1 and
C2 are constants. Results obtained with this equipment are
presented in another paper [27]. Essentially the results show that the emissivity variation at 4.35 µm with temperature was going from 0.13 at 200 °C with a slope of 3x10⁻⁵/°C to 0.1 at
200 °C with a slope of 8x10⁻⁵/°C (x 2.7 higher). It needed
5 hours at 800°C of conditioning of the sample to reach a reproducible emissivity evolution with temperature of 8x10 -5/°C. For ITER this is equivalent, to a heat flux of 8 MW/m²
during 900 discharges of 20 seconds. B. Emissivity variation with roughness
The industrial fabrication of divertor components for ITER requires the manufacturing of plasma-facing components equipped with about 300 000 W monoblocks with dimensions of about 23 × 28 × 12 mm3 [17]. It has been observed on
tungsten that the roughness and the oxidation have an influence on the normal spectral emissivity [18, 19]. It is also observed on real dimensions ITER PFU mockups that the emissivity is strongly dependent on the surface roughness when observed at normal incidence [20] fig.1. It has to be pointed that for WEST and ITER that the plasma facing units are specified with Ra < 1.6. The 6 first WEST actively cooled ITER-like plasma facing units which have been installed on the bottom divertor have shown that the rugoses profiles measured prior to installation in the machine were between 0.2 µm and 1 µm (H.Roche Private Communication). From fig. 1 we can expect a large variation of the emissivity.
The rugoses Ra is not probably the only driving parameter to characterize the emissivity level since we can anticipate the presence of cracks or cracks networks during plasma operation at high heat flux. This will strongly influence the emissivity level, cracks acting as small blackbody cavities.
Figure 1: Emissivity evolution at 1000 °C for roughness between Ra = 0.3 µm and 6 µm.
Currently, the applicability of the world-wide developed manufacturing technologies of W monoblock plasma facing components has been confirmed by intensive high heat flux (HHF) testing, 5 000 cycles at 10 MW/m2 and 1 000 cycles at
20 MW/m2, e.g. mock-ups of ITER divertor PFCs from various
manufacturers [21, 22].
A large variety of results are found, the most striking examples are the evolution with time of the emissivity during cycling at JUDITH and GLADIS. In the case of monoblocks produced by electro-discharge-machining there is a significant evolution of the emissivity with pulse number. It results an apparent decrease of the surface temperature during cycling at a fixed heat flux, fig. 2.
C. Emissivity of ITER like W plasma facing unit mockup during high heat flux test
In the literature we can find the results of different high heat flux test facilities where the emissivity was estimated during tests of high heat flux ITER-like mockup.
Observations made at GLADIS
Grinding and electro discharge machining (EDM) were applied for different components as final surface machining. For these elements it has been evidenced that a large emissivity evolution was taking place at least during the first 100 cycles at 10 MW/m² [23, 24]. It is observed during high heat flux tests of plasma facing unit mock-up at GLADIS [22] (accelerated ions with high voltage 20–53 kV) that among all the industrial makers of PFU, only in the case of monoblocks produced by electro discharge machining there is a significant evolution of the emissivity with pulse number for exactly the same operating conditions, here 10 MW/m² [22]. It results in a decrease over time of the apparent surface temperature (IR camera Infratec VARIOCAM HD λ from 7.5 μm to 14 μm), the real temperatures being evaluated by a 2 colors pyrometer working at 1.6 µm and 1.75 µm. This reference temperature (almost constant during the 100 cycles at 10MW/m²) is then used to unfold the IR camera effective emissivity at ~ 10.75 µm. Analyses by energy dispersive X-ray evidenced the removal of chemical elements like carbon, oxygen, copper, etc. These surface elements where removed by the application of 100 high heat flux cycles. The strongly affected surface of EDM machined monoblocks had a strong apparent temperature
evolution between 100 °C and up to 200 °C if the emissivity is kept constant during these 100 cleaning cycles at 10 MW/m² [22]. These observations on real monoblocks fabricated by the potential providers for the ITER divertor show that if the emissivity is kept constant, the monochromatic infrared thermography is probably not able to make absolute surface temperature measurements with low enough errors bars < 10%. An error of 200°C at 880 °C ~ 23% is reported.
Observations made at JUDITH
On JUDITH high heat flux test facility [26] the emissivity evolution with screening number has been measured fig. 2 for W material averaged for the bandwidth (2 µm to 5.7 µm) of the IR camera used (private communication). During a test campaign of an ITER like W-PFU mock-up, large variation of the emissivities where observed (pyrometer: 1.4-1.75 µm, 1.6-1.75 µm used as temperature references). The emissivity was measured on 2 adjacent monoblocks since the surface morphology where different. It is observed a strong difference between the 2 blocks and a variation of the emissivity over the test, almost by a factor 2, see fig. 2. It is observed during cycling at 20 MW/m² that the emissivity gap between the 2 blocks narrows significantly. As we can see it is not clear what is exactly the real dependence of the surface emissivity with wavelength and temperature.
Figure 2: Emissivity variation with screening number at 10 and 20 MW/m² for 2 adjacent monoblocks located on the same actively cooled ITER-like plasma facing unit mockup [26].
D. WEST in situ W evidence of emissivity non uniformity of real W plasma facing units
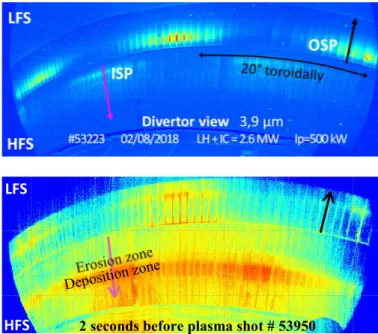
In WEST the bottom divertor is made of semi-inertial plasma facing units made of 2 independent parts, the Inner and Outer Striking Point zones (ISP, OSP), fig. 3. They are made of graphite tiles covered with a 10 µm layer of tungsten deposited on the surface. Each of the 2 parts of a plasma facing unit is anchored on the actively cooled support by 2 localized =6mm pins, fig. 3. Since the heat conduction through the pins is rather low, the temperature prior to the shots is increasing slowly (ratcheting effect) depending on the deposited energy during the previous shots. Prior to a shot the temperature of each individual parts of a plasma facing unit is homogeneous (time
between shots > 20 minutes). Prior to shot #53950 the 4 thermocouples along each of the two ½ PFU indicates the same temperature, indicating a homogeneous bulk temperature: TISP
= 157°C and TOSP = 180°C. Prior to the shot # 53950 we can
observe along these plasma facing components that the surface temperature is non uniform on each individual ½ PFU (inner and outer strike points). This non uniformity is attributed to emissivity variations. One can compares fig. 4 the 2 luminance maps (during shot or 2s prior to shot) where we can see that the hottest parts prior to shot are the places out of the strike zones, where there is no plasma during the shots. On the one hand the regions where the temperature is low (emissivities is low) prior to shots correspond to regions of the strike point where erosion is probably taking place. On the other hand the locations where there is no plasma during shots, probably corresponds to regions where deposit is taking place fig. 4. This luminance inhomogeneity prior to shots could be attributed to emissivity variations depending on the localization with respects to plasma heat flux (strike points localizations).
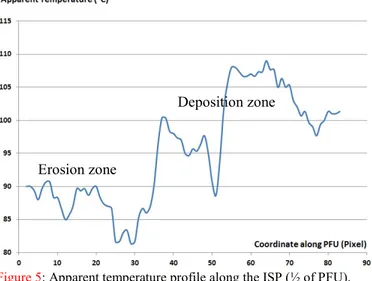
The apparent temperature profile (
=1) along the ISP ½ PFU is plotted fig. 5 at time t = -2s, prior to shot # 53950. The lowest apparent surface temperature corresponds to the strike point and the highest apparent temperature zone to the un-wetted zone by the plasma.Let us examine the precision we can anticipate when there is an emissivity variation of the scene.
IV. PRECISIONOFTHEMONOCOLORIR
THERMOGRAPHY The luminance measured at wavelength 1 is:
L1 = ℰ ∗𝐶1𝐶2∗
( ∗ )
= f(T, 1) (2)
And the temperature T can be expressed as:
𝑇 =
∗ ∗ ∗ ℰ
∗
= 𝑓(𝐿, ℰ1)
(3) The relative temperature error can be calculated within the
Wien approximation ( Exp 𝐶2
( ∗ ) ≫ 1 ):
(4) The problem of the monochromatic method is that you have to know the emissivity of the observed object at wavelength for each individual time slice and for each individual pixel. Unfortunately as we have shown, the emissivity is also evolving with a number of parameters: temperature, surface state (which can evolve in time), which makes things difficult to detangle. The relative emissivity error can be as large as 100% if you cannot take into account the real time knowledge of the pixel-by-pixel emissivity of the observed scene.
Fig. 6 shows that with a monochromatic system centered at 4 µm (with a small bandwidth ~ 0.1 µm), the relative temperature error can be > 90% at 3000 °C for relative emissivity error of 100%.
Figure 3:(Up) picture of the 2 parts of semi-inertial plasma facing unit made of graphite covered with a layer of 10 µm of tungsten. (Down) Tangential view of WEST equipped with tungsten covered graphite tiles.
Figure 4: (Up) Luminance map of the bottom divertor (see fig. 3) during plasma operation. (Down) Luminance map of the bottom divertor 2 seconds prior of shot #53950. The luminances are far from being homogeneous, underlying the non-uniform emissivity.
LFS
HFS
2 seconds before plasma shot # 53950½ PFU ½ PFU ∆𝑇 𝑇 = λT
𝐶
2∗ ∆ℰ ℰFigure 5: Apparent temperature profile along the ISP (½ of PFU).
For the ITER thermography this is not acceptable since the requirements indicates T/T < 10% over the entire temperature range from 200 °C to 3 600 °C.
Figure 6: Monocolor temperature precision T/T at 4µm as a function of the emissivity precision for different temperatures. Note that the ITER requirement is T/T < 10% over the temperature span from 200°C to 3600°C.
V. USEOFBICOLORTHERMOGRAPHY
Another method to measure the absolute surface temperature of an object is to use multicolor (number of wavelengths > 1). Let us see the bicolor technic where the luminance is measured at 2 different wavelengths1 and 2.
For the second wavelength the luminance is: L2 = ℰ ∗𝐶1∗ 𝐶2
( ∗ )
= f(T, 2) (5)
where 2 is the new wavelength, L2 the new luminance.
Combining equation (2) and (5) assuming that the ratio of the emissivities does not vary very much whatever is the temperature (R = 1/2 = constant over the temperature span)
we can show that the absolute surface temperature is only a function of the luminances L1 and L2 for a given value of R:
T = f
R ( ) (6)Hagen and Rubens [25] have proposed an extended formula which is representative of the experimental emissivity variations with temperature and wavelength. The spectral emissivity (,T) where T is in Kelvin :
(T) = 0.365 ( )− 0.0667 ( )+ 0.006 ( ) is the electrical resistivity of the material surface and is the temperature coefficient.
The emissivity evolution with temperature [27] can be represented by the extended Hagen-Rubens model unless the absolute value is not correct. We use this fact to predict the evolution with temperature of the ratio of the emissivities at 2 wavelengths. This is shown fig. 7 for a number of couples of wavelengths in the mid wave infrared region. We observe that the relative evolution of the emissivity ratio is quite small < 1%.
Figure 7: Evolution of the relative emissivity
R
1/
2 as a function oftemperature for different choices of wavelengths 1 and 2 according
to the extended Hagen-Ruben analytical model [25].
We propose to use this observation for the bicolor thermography within the mid-wave infrared region.
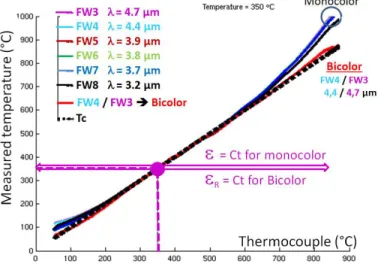
During the emissivity measurement done in the CEA laboratory we used a TELOPS infrared camera [28] equipped with a filter wheel equipped with 6 interference filters (FW8 = 3.2µm, FW7 = 3.7µm, FW6 = 3.8µm, FW5 = 3.9µm, FW4 = 4.4µm and FW3 = 4.7µm) see fig. 8. The reference emissivity and emissivity ratio were calculated at the ITER divertor baking temperature of 350 °C. This temperature could be used in ITER to make calibrations of the 2D map of the emissivity. We can see fig. 8 that the maximum temperature error is 15.9% < T/T < 23.5% at 850°C for the monocolor technic and T/T < 3.5% at 822°C for the bicolor technic.
Unless the interference filters central wavelength and bandwidth used for the TELOPS camera, were not optimized for such measurements, the bicolor technic recover the thermocouple measurement within the ITER specification. The 0% 20% 40% 60% 80% 100% 0% 20% 40% 60% 80% 100% 120% T/T
ITER requirement T/T < 10% = 4µm 1.00 1.02 1.04 1.06 1.08 1.10 1.12 0 500 1000 1500 2000 2500 3000 1= 1.6 µm / 2= 1.75 µm 1= 3.6 µm / 2= 4.4 µm R= 1/ 2 R/ R = 0,34 % R/ R = 0,39 %
R/
R = (MAX - Min) / AverageT (°C) 1= 4.4 µm / 2= 4.7 µm R/ R = 0,15 % Erosion zone Deposition zone (7)
advantage of the bicolor technic is to use the ratio of the emissivities at 2 wavelengths which is weakly dependent on the temperature dependence of the emissivities at the considered wavelengths. In our experiment the ratio of the emissivities calculated at 350 °C was kept constant
R = 0.9402 to unfoldthe bicolor temperature evolution of fig.8.
From the measured luminance and the luminance calculated with the thermocouple temperature one can calculate the sample emissivity as a function of the Tc temperature for each wavelength. Fig. 9 shows the evolution of the emissivities ratio
FW3/
FW4 as a function of the thermocouple temperature Tc. Wecan observe that the precision on the ratio of the emissivities is within ±0.3% from 300 to 850 °C, below the required accuracy of 0.64% to have a temperature precision < 10% from 200 to 3 000 °C, fig. 10.
Figure 9: Evolution of the measured temperatures (monocolor and bicolor) as a function of the thermocouple temperature (reference) when the reference temperature for the emissivities, or ratio of emissivities, is calculated at 350°C the baking temperature of the ITER divertor.
Figure 10: Evolution of the emissivity ratio FW3/FW4 as a function of
the Tc temperature. The fixed value taken at 350 °C for the emissivity ratio is 0.9402 for the bicolor temperature estimation.
VI. PRECISIONOFTHEBICOLORTHERMOGRAPHY
The question we can raise about the bicolor technic is the
temperature precision evolution T/T with the evolution of the precision of the ratio of the emissivities at the 2 wavelengths. For wavelength 1 and 2 the measured luminances are (not
integrated here over the bandwidth of the filter for simplicity) shown in (2) and (5).
Within these 2 equations we have 3 unknowns: 1, 2 and T. A
system of 2 equations with 3 unknowns is undermined since there an infinite set of 3 parameters which fulfill the system. We can reduce these 2 equations into 1 equation (Wien approximation for simplicity):
Tbi =
𝐶2 ( )
ℰ ℰ ∗ ∗
(8) The assumption made here is that:
(9) Now in equation (8) the only unknown is T. The temperature T can be calculated from the ratio of the luminances at the 2 wavelengths L1 and L2.
Using the Wien approximation, the relative temperature error is:
∆
= 2 ∗
𝐶2∗
∆ℰ ℰ(10) were:
𝜆𝑟 =
and
ℰ
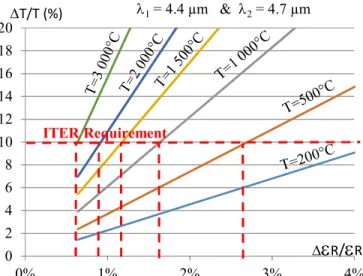
𝑟 =ℰ( λ1,T) ℰ( λ2,T) (11)Fig. 10 presents the precision of the temperature T/T as a function of the precision of the ratio of emissivities at the 2 considered wavelengths. We can observe that to fulfill the ITER requirement T/T < 10% from 200 °C to 3000 °C, the required precision of the ratio of the emissivities
R/
R must be< 0.64%. It can be seen fig. 7 that for W it is well below this value especially by choosing large wavelengths with a moderate wavelength separation, 1 = 4.4 µm and 2 = 4.7 µm.
This relative temperature error associated to the bicolor technique is to be compared to the same relative temperature error associated to the monocolor technique, see equation (4) and fig. 6.
ℰ
𝑟 =ℰ( λ1,T) ℰ( λ2,T) = Constant + 1% - 1% + 0.3% - 0.3%Figure 11: Evolution of the temperature precision T/T as a function of the relative emissivity precision R/R for different surface
temperatures. The ITER requirement is T/T < 10%.
VII. CONCLUSIONS
It has been shown that the main variation of the emissivity is
with temperature, wavelength and surface state
(pollution/oxidation, presence of cracks). It is noted during high heat flux tests that the pollution of the surface is removed within the first 100 discharges at 10 MW/m². This has to be taken into account for the evaluation of the real surface temperature estimation, since the removal of the thin polluted coating modify the emissivity of the observed surface leading to an apparent evolution (decrease) of the surface temperature at constant heat flux. It is expected in ITER that the plasma facing units will receive a plasma heat flux of 10 MW/m² (the design value) after a long process of increasing slowly the heat flux on the plasma facing elements to optimize the operating scenarios in safe way.
However if the part is sound, without presence of any defect or pollution, no modification of the true surface temperature of the tungsten monoblocks would be expected in ITER if the emissivity is known with enough precision. The difficulty with the monocolor surface temperature measurement is the temporal and spatial variation of the emissivity of the tungsten material, monoblock by monoblock. In the case of steam ingress inside the vacuum vessel during plasma operation when the surface temperature is high (~ 1000 °C for 10 MW/m²) we may have a significant oxidation of the tungsten leading to a large increase of the emissivity. The bicolor thermography could be one solution since the luminances are recorded within the 2 wavelengths bands and can be treated at the same as 2 independent monocolor and a bicolor, 2D surface temperature maps. For the bicolor one has to choose the best adapted set of wavelengths to minimize the relative error temperature over the large temperature span from 200 °C to 3600 °C (ITER requirement). The wavelengths must be chosen close enough to minimize the emissivity variation of the material on the whole temperature range, but not too close to minimize the uncertainty on the measured temperature due to an amplification of the noise present on the measured luminances. The optimization of
the choice of the wavelengths will be presented in another paper.
Concerning the extended Hagen-Rubens emissivity relation, it was experimentally shown that this expression is able to give the tendencies for > 2 µm after cleaning up of the surface of the tungsten, but it is not satisfactory for rough, or corroded, or oxidized surfaces. This formula can be misleading because the variations of the properties can be very large due to contamination, grain structure, or surface evolution (cleaning or oxidation), etc. Thus it is not possible to predict the radiative properties values, unless the tungsten surface approach ideal conditions of composition finish and state.
It has to be pointed out that the state of the surface is depending on its history and so one cannot apply to the whole surface of the plasma facing components we are looking after, a unique value of emissivity. The emissivity value to apply to each individual pixel of an image (camera frame) is different and dependent on temperature for each wavelength.
To get an accurate absolute infrared surface temperature measurement before tungsten melts, above 3 000 °C, one must know in laboratory experiments, high heat flux test stands and tokamak devices:
- The emissivity with a rather high precision
/
< 10% for the monocolor technic, which is not accessible. - An emissivity ratio precision of
r/
r < 1% for thebicolor technic, which is accessible.
We need to progress on the 2D maps emissivity evaluation over time in present day machines using the embedded thermal measurement, and have regular calibration of the emissivity (and transmission of the optical line), or the ratio of the emissivities (and transmission), pixel by pixel during the baking of the machine (Wall at 240 °C and divertor at 350 °C as expected in ITER). We need to develop the use of bicolor infrared thermography in laboratory experiments, high heat flux test stands and tokamak devices.
REFERENCES
[1] T. Heich and al. “ELM divertor peak energy fluence scaling to ITER with data from JET, MAST and ASDEX upgrade” Nuclear Materials and Energy Volume 12, August 2017, Pages 84-90
[2] Y. Ueda et al. / journal of Nuclear Materials 442 (2013) 5267-5272
[3] GM. Wright et al. / journal of Nuclear Materials 438 (2013) 584-589
[4] L. Buzy et al. / Nucl. Fusion 57 (2017) 126009
[5] S. Brezinsek et al. / Nucl. Fusion 57 (2017) 116041
[6] T. Matsumoto et al. “Hemispherical Total Emissivity of Niobium, Molybdenum, and Tungsten at high Temperatures Using a combined Transient and brief Steady-State Technique” Journal of Thermophysics, Vol. 20, No 3, 1999
[7] J.C. Krapez, “Thermal Measurements and Inverse Techniques”, Ed. Renato M. Cotta, CRC Press 2011, Pages 185-230
[8] R. Reichle; “System Design Description (DDD) 55.G1 Vis/IR Equatorial Port Wide-Angle Viewing System”; 22 Jan 2015 / 1.4 / Approved; IDM UID DCHGAP;
[9] D. Guilhem, R. Reichle & H. Roche; “Reflections and surface temperature measurements in experimental fusion reactors Tore-Supra, JET and ITER”; QIRT Journal. Volume 3 – N° 2/2006, pages 155 to 168
[10] M. H. Aumeunier et al. Impact of reflections on the divertor and first
wall temperature measurements from the ITER infrared imaging system,
0 2 4 6 8 10 12 14 16 18 20 0% 1% 2% 3% 4% T/T (%)
R/
R 1= 4.4 µm & 2= 4.7 µm ITER RequirementNuclear Materials and Energy (2017) http://dx.doi.org/10.1016/j.nme.2017.02.014
[11] ITER Project Requirements, ITER document: ITER_D_27ZRW8
[12] ITER Diagnostics System Requirements: ITER document:
ITER_D_28B39L
[13] W. E. Forsythe, A. G. Worthing, "The Properties of Tungsten and the
Characteristics of Tungsten Lamps," The Astrophysical Journal, University of Chicago Press, Volume LXI (November 1924), pp. 146-185.
[14] Y. S. Touloukian and D. P. DeWitt, "Thermal Radiative Properties of
Metallic Elements and Alloys," Thermophysical Properties of Matter, Volume 7, IFI/Plenum Publishing, New York (1970), pp. 776-791.
[15] D. E. Gray, American Institute of Physics Handbook, New York (1972),
pp. 6-72. Reference and data cited in Metals Handbook - 9th Edition, American Society of Metals, Novelty, Ohio (1979).
[16] [12] I. K. Kikoin, Tables of Physical Values, Handbook, Moscow,
Atomizdat (1976), p. 107. Anon.," Tungsten Technical Brochure," Metallwerk Plansee, Reute, Austria, 1985.
[17] T. Hirai; “Use of tungsten material for the ITER divertor”; Nuclear
Materials and Energy 9 (2016) 616–622
[18] C. MARTIN et al. Revue Phys. Appl. 15 (1980) 1469-1478
[19] L K Thoma; “An apparatus for the measurement of the normal and
off-normal spectral emissivity of incandescent materials” ; Journal of Scientific Instruments (Journal of Physics E) 1968 Series 2 Volume 1
[20] M.TAKEUCHI et al. Fusion Science & Technology – Volume 69
655-665 -- May 2016
[21] T. Hirai et al. “Use of tungsten material for the ITER divertor”, Nuclear
Fusion and Energy 9 (2016) 616-622
[22] H. Greuner, et al., In press: “Potential approach of IR-analysis for high
heat flux quality assessment of divertor tungsten monoblock components”, Fusion Eng. Des. (2017), http://dx.doi.org/10.1016/j.fusengdes.2017.02.092
[23] H. Greuner “High heat flux facility GLADIS:: Operational
characteristics and results of W7-X pre-series target tests“, Journal of Nuclear Materials Volumes 367–370, Part B, 1 August 2007, Pages 1444-1448
[24] H. Greuner, et al. J. Nucl. Mat.386-370 (2007) 1444
[25] Extended Hagen-Ruben model Optical Physics and Engineering Series
Editor: William L. Wolfe 1968: Honeywell Inc. Radiation Center Boston, Mass. M. A. Bramson Infrared Radiation: A Handbook for Applications (extension of the Hangen-Rubens analytic formula)
[26] Task report: HHF-Test of M-1-1 G. Pintsuk Jul. 2015
[xx] M. Minissale et al. “the temperature dependence of optical properties of tungsten in the visible and near-infrared domains: an experimental and theoretical study” Journal of Physics D: Applied Physics, IOP Publishing, 2017, 50 (45), 10.1088/1361-1363/aa81f3
[27] J. Gaspar et al., “Emissivity measurement of tungsten plasma facing
components of the WEST tokamak”, submitted
![Figure 2: Emissivity variation with screening number at 10 and 20 MW/m² for 2 adjacent monoblocks located on the same actively cooled ITER-like plasma facing unit mockup [26]](https://thumb-eu.123doks.com/thumbv2/123doknet/12901962.371535/4.918.474.843.525.786/figure-emissivity-variation-screening-adjacent-monoblocks-located-actively.webp)