HAL Id: cea-02394089
https://hal-cea.archives-ouvertes.fr/cea-02394089
Submitted on 4 May 2020HAL is a multi-disciplinary open access
archive for the deposit and dissemination of sci-entific research documents, whether they are pub-lished or not. The documents may come from teaching and research institutions in France or abroad, or from public or private research centers.
L’archive ouverte pluridisciplinaire HAL, est destinée au dépôt et à la diffusion de documents scientifiques de niveau recherche, publiés ou non, émanant des établissements d’enseignement et de recherche français ou étrangers, des laboratoires publics ou privés.
Detailed examination of deformations induced by
internal hydrogen explosions : Part 1 Experiments
E. Studer, S. Koudriakov, B. Cariteau, R. Scarpa
To cite this version:
E. Studer, S. Koudriakov, B. Cariteau, R. Scarpa. Detailed examination of deformations induced by internal hydrogen explosions : Part 1 Experiments. ICHS 2019 - International Conference on Hydrogen Safety, Sep 2019, Adelaide, Australia. �cea-02394089�
DETAILED EXAMINATION OF DEFORMATIONS INDUCED BY
INTERNAL HYDROGEN EXPLOSIONS: PART 1 EXPERIMENTS
Studer, E.1, Koudriakov, S.1 , Cariteau, B.1 and Scarpa, R.1
1 DEN/STMF, Université Paris-Saclay CEA, F-91191 Gif-sur-Yvette, France, [email protected]
[email protected] [email protected] [email protected]
ABSTRACT
In industry handling hydrogen, explosion presents a potential danger due to its effects on people and property. In the nuclear industry, this explosion, which is possible during severe accidents, can challenge the reactor containment and it may lead to a release of radioactive materials into the environment. The Three Mile Island accident in the United States in 1979 and, more recently, the Fukushima accident in Japan have highlighted the importance of this phenomenon for a safe operation of nuclear installations as well as for the accident management.
In 2013, the French Research Agency (ANR) launched the MITHYGENE project with the main aim of improving knowledge on hydrogen risk for the benefit of reactor safety. One of the topics in this project is devoted to the effect of hydrogen explosions on solid structures. In this context, CEA conducted a test program with its SSEXHY facility to build a database on deformations of simple structures following an internal hydrogen explosion. Different regimes of explosion propagation have been studied, ranging from detonation to slow deflagration. Different targets were tested, such as cylinders and plates of variable thickness and diameter. Detailed instrumentation was used to obtain data for the validation of coupled CFD models of combustion and structural dynamics.
This article details the experimental set-up and the results obtained. A companion article focuses on the comparison between these experimental results and the prediction of CFD numerical models.
KEYWORDS: Experimental techniques, combustion tube, Fluid Structure Interaction 1.0 INTRODUCTION
In case of severe accident, in-core metal-water reactions due to fuel temperature increase lead to massive release of hydrogen into the containment of Light Water Nuclear Reactors. The highly compartmentalization of these buildings makes non-condensable gases to accumulate in clouds. With ease, a flammable atmosphere can locally be achieved. Eventually, the explosion of such a cloud may jeopardize the integrity of the containment. The likelihood of such events has found an evidence in the accident of Three Miles Island in 1979 and, more recently, at the Fukushima Daiichi nuclear power plant, in 2011. Both these accidents proved the importance of a correct management of the hydrogen explosion phenomena for the safety of nuclear reactors. It is worth noticing that chemical and process industries, handling hydrogen, present similar safety issues. Recently, a renewed interest in hydrogen safety has developed thanks to the spreading use of fuel cells in the transport industry. Many countries worldwide are supporting hydrogen as an alternative fuel to reduce CO2 emissions and improve air
quality.
The dynamics of combustion reactions is strongly influenced by boundary conditions: confined geometries tend in fact to promote flame acceleration. Under certain circumstances, the overpressure generated by the lead shock ahead of the flame may cause structural failure. To deal with these safety issues empirical criteria have been developed in the early 2000s [1], [2] to discern possible flame acceleration or deflagration-to-detonation transition (DDT) scenarios. These criteria have proved to be
powerful means in best estimate studies for the selection of the most relevant situations for which flame acceleration takes place.
Thanks to the recent improvements in computer capabilities, numerical models have been developed over the last decades in order to perform large scale simulation [3], [4]. Here, the main challenge lays in the resolution of combustion micro-scales: several orders of magnitude separate, in fact, combustion characteristic lengths from typical mesh sizes adopted for containment safety analysis. As a result, in large scale simulations combustion phenomena are under-resolved. Algebraic combustion models are, therefore, implemented to offset the unresolved terms in the set of balance equations. Nowadays, efforts are made to increase model predictability pushing towards the use of detailed kinetics and Direct Numerical Simulations [5]. Still, as pointed out in [6], when complex chemical schemes are used, the need of resolving stiff gradients limits the applicability of DNS to small fluid domains. Therefore, the improvement of large scale models for containment safety analysis remains of great importance. Nevertheless, the predictability of these models is still an open issue. Hasslberger et al. [7] showed that the implementation of an Adaptive Mesh Refinement scheme could be a starting point to improve large scale numerical simulations accuracy.
The main purpose of large scale combustion simulations is to provide velocity and acceleration fields, together with local combustion overpressures, for the evaluation of the dynamic load acting on structures. This information is in fact crucial for safety analysis. As pointed out previously, in case of severe accident, the containment of a nuclear reactor is the last barrier to avoid radioactive materials release into the environment. Therefore, excessive loads should not jeopardize its integrity. Moreover, the availability of those safety features important for accident management and mitigation should be ensured over the entire duration of the accident. The hydrodynamic force acting on a freestanding object depends not only on the pressure field but also on the flow velocity [8], via the drag force and inertia. Hence, the importance of a fine characterization of flame and shock wave propagation in confined geometries. Starting from the study of the impact of blast waves, simple models were developed to predict the structural response to explosive loading [9]. The extensive works of Duffey and colleagues on impulsive loads[10] and those of Shepherd and colleagues on gaseous detonation loads[11], [12] brought to the development of new methodology for the assessment of the effects on dynamically loaded structures. Recently, efforts have been made to take into account the structure deformations in combustion simulations. An example is given in [13], where numerical simulations are performed coupling a gas dynamics code with a finite element one.
In this perspective, an R&D program is currently ongoing at CEA for the implementation of Fluid-Structure Interaction (FSI) models in EUROPLEXUS code [14]. The need for verification and validation of these models against experiments has pushed the CEA to design a middle-scale facility for the analysis of combustion generated loads: SSEXHY facility (Structure Subjected to an EXplosion of HYdrogen) [15]. In the framework of the MITHYGENE project [16] launched by the French Research Agency, an experimental program has been conducted to produce detailed data on simple structure deformations loaded by various hydrogen combustion regimes. This article gathers the significant results and a companion paper focuses on the use of these data for the validation of detailed FSI models. The test facility and the associated measurement techniques are described in Chapter 2. Then, Chapter 3 focuses on the experimental results including static pressure loadings to validate the boundary conditions as well as dynamic results with massive or deformable targets. Conclusions and perspectives follow.
2.0 DESCRIPTION OF THE SSEXHY TEST FACILITY 2.1 Geometry
The SSEXHY combustion tube [15], [17] features a stainless steel obstructed duct designed to study the acceleration mechanisms of premixed hydrogen/air flames. The tube includes four interchangeable sections connected by flanges and in the present tests only three were used. Each section is 1310 mm
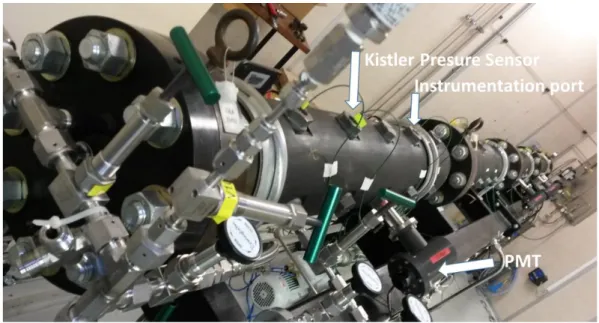
long with an internal diameter of 120 mm. Two blank flanges can be used to seal the combustion tube at its extremities. An array of equally spaced annular obstacles are placed inside the tube (Blockage Ratio equal to 30% and pitch equal to tube diameter) with the aim of promoting turbulence at the wall. A picture of the experimental device is shown in Figure 1.
Figure 1. SSEXHY tube and associated instrumentation.
Gas injection lines are connected to one end-flange via an isolation valve. At the center of this flange, a threaded hole houses an automotive spark plug. Mixture ignition is provided by the electrical discharge between the two electrodes of the plug (~25 mJ). Hydrogen (Air Products) and synthetic air (Air Products 20,9% O2, 79,1% N2) are injected using the partial pressure method controlled by a MKS static
pressure sensor (Baratron 627F). Once the two gases are injected inside the tube, a non-homogeneous mixture is formed. A gas recirculation pump (Bühler P2.74 Atex pump) then promotes homogenization. After half an hour, two taps are used for gas sampling at both ends. Then, the mixture is analyzed via gas chromatography (Agilent 490 µGC equipped with a thermal conductivity detector).
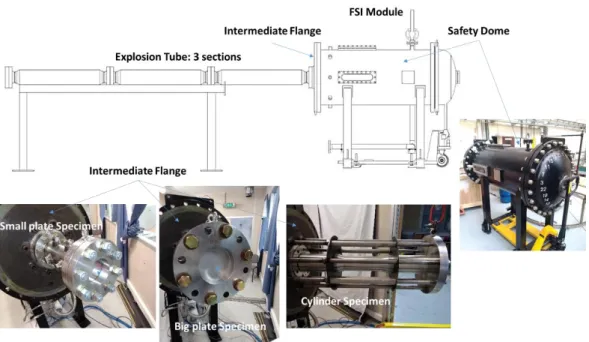
To investigate the effect of combustion loads on structures, the combustion tube described above is coupled with a FSI module, designed for this purpose. The connection between the combustion tube and the FSI module occurs at the end-flange of the tube. Here, an intermediate flange that ensure the coupling replaces the end-sealing flange. The intermediate flange also serves as support for the testing specimens. Moreover, it hosts the connections for nitrogen injection and venting lines (to inert FSI module atmosphere). The flange has an outer diameter of 895 mm and an internal diameter of 120 mm, which allows the perfect continuity with the combustion tube internal wall. A schematic view of the coupling between the combustion tube (in the configuration with 3 flame acceleration sections) and the FSI module is shown in Figure 2.
Figure 2. FSI module and specimens.
The FSI module is composed by the following interconnected parts: intermediate flange; adapter or support for the specimen to test; stainless steel specimen; counter-flange for specimen fixation and safety dome. Three types of stainless steel specimens can be installed: small and big circular plates and cylinders. Specimens are made of 304L austenitic stainless steel. Together with the 316L SS, the 304L SS is one of the most commonly used steel in the nuclear industry. Moreover, several studies have been performed on the dynamic behavior of this type of stainless steel at the mechanical division of the CEA. Mechanical properties of the SS 304L are listed in Table 1.
Table 1. Mechanical properties of Stainless Steel 304L specimens.
Property Value
Young Modules E (GPa) 166
Poisson Ratio 0.275
Density (kg/m3) 7930
Yield Stength YS (MPa) 180
Rupture Strength R (MPa) 500
Speed of Sound cs (m/s) 5790
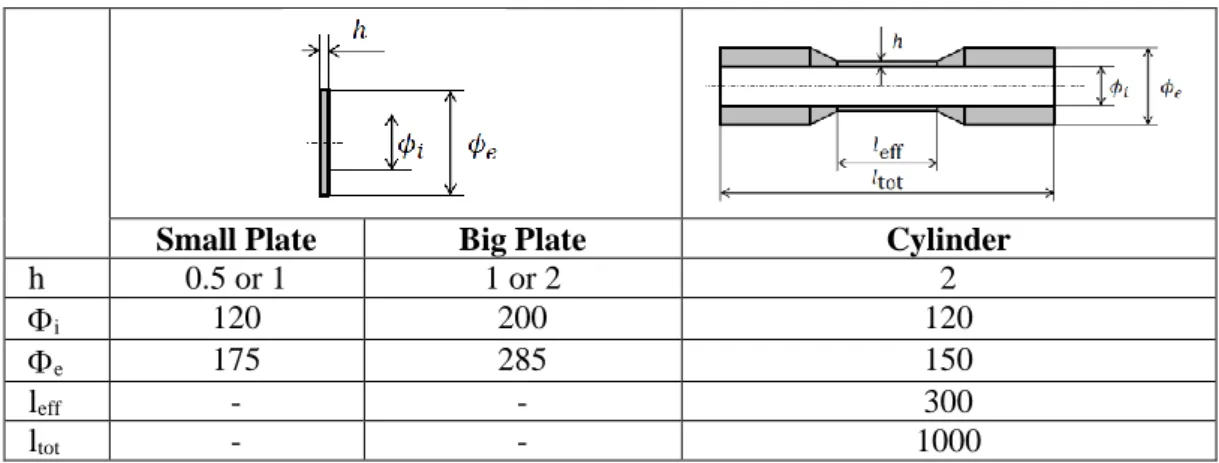
Specimens' characteristic dimensions are given in Table 2. A schematic view of the cylindrical specimen is shown in Table 2. The internal diameter of the cylinder is equal to the internal diameter of the combustion tube i =120 mm. At the extremities the cylinder is 15 mm thick, while in the central region
the thickness is gradually reduced to 2 mm, to limit local stresses originated by geometrical incongruences. The effective length of the 2 mm thick region of the cylinder is 300 mm and it correspond to the effective testing zone of the specimen. The rigidity was locally increased to bare the stresses induced by the constraints at the border and to ensure its correct placement on the facility. If bending forces are generated at the border after fixing the cylinder on its support, internal stresses are gradually dumped along the cylinder length. The extinction length, l*, of the bending effects can be evaluated according to equation l*~2.33(h*.R*)1/2 [18]. By taking R*=135 mm and h*=15 mm, l*= 105 mm.
Without pressure loads, therefore, the central testing zone should not be affected by any residual stresses arising from cylinder fixation.
Table 2. Specimen Geometries in mm.
Small Plate Big Plate Cylinder
h 0.5 or 1 1 or 2 2
i 120 200 120
e 175 285 150
leff - - 300
ltot - - 1000
In order to fix the specimen to the combustion tube, three different supporting structures are available, according to the type of specimen to test. At one side the adapter is fixed to the intermediate flange, while at the other side the end-flange has a groove to accommodate the specimen. Specimen edges are then clamped between the adapter end-flange and a counter-flange. The sealing is ensured by two flat gaskets at each side insulating the whole clamped area. The length of the combustion tube is extended inside the safety dome of the FSI module by using a cylindrical adapter (see Figure 2 bottom left). This adapter features a thick stainless steel flanged tube 500 mm long with the tube inner diameter. The circular plate is installed at the end-flange.
In order to test circular plates with different diameters, a flanged conical adapter 500 mm long is used (see Figure 2 bottom central). The internal diameter of this adapter increases smoothly from 120 mm to 200 mm at the plate fixation point. Both adapters are equipped with instrumentation ports. The cylinder specimen (Figure 2 bottom right) is clamped between the intermediate flange and the counter-flange. In this case the counter-flange is blank to confine the explosion. The blank counter-flange is supported by eight studs tighten to the intermediate bride. A slight pre-compression is applied on the flat gaskets to seal the assembly. An instrumentation port is located at the center of the counter-flange, dedicated to dynamic pressure monitoring.
Finally, a safety dome encloses the FSI module (Figure 2). It is a stainless steel pressure vessel with a nominal diameter of 700 mm and a total length of 1800 mm, that is designed for a nominal pressure of 8 bar. The dome has multiple functions: 1) to contain possible missiles that can be generated and ejected following specimens failure and fragmentation; 2) to provide an inert atmosphere surrounding the specimens (the dome is filled with nitrogen); 3) to avoid pressure differences across specimen thickness during venting and filling procedures; 4) to provide optical accesses on the specimens (in order to use optical diagnostics to characterize specimens deformation in time); 5) to provide electrical ports for the different diagnostics connections.
To avoid any direct impact between specimen fragments and the dome, the internal wall of the dome is shielded with a deformable shell. The optical access to the specimen is provided by three glass windows: two lateral rectangular windows with a visualization area of 400x80 mm; one circular window on the convex end of the dome, facing the dome axis, with 80 mm diameter. The two rectangular windows are located 275 mm from the intermediate flange and 90° spaced to each other. A pressure transducer is installed on the dome to record the static pressure during filling and venting procedure. It allows managing the pressure differences between the combustion tube and the dome during these phases in order to avoid excessive pressure loads on the specimens (avoiding plastic deformations of the specimen raising from the establishment of a pressure difference across the specimen thickness). Since the FSI module replaces the end-flange of the combustion tube, gas-venting lines are now connected to the last available instrumentation port of the combustion tube.
2.2 Measurement techniques
Each measurement port of the tube can be equipped with different sensors: optical accesses of the photomultiplier tubes (PMT Hamamatsu R11568) for flame time-of-arrival measurements, dynamic pressure piezoelectric sensors (Kistler 601, 6001 or 7001) and piezoelectric shock sensors (Chimiemetal 2 mm in diameter).
Different laser displacement sensors have been used during the tests: Keyence LK-H082 (focal length 50 mm accuracy 4 µm) and LK-G502 (focal length 500 mm accuracy 250 µm) point laser displacement sensors to measure the mid-point deflection and a Keyence LJ-V7300 laser ultra-fast profilometer (focal length 300 mm accuracy 290 µm) to record 1D profiles. A Phantom ultra high-speed camera (V22-10) was also used during some tests to record the behavior of the specimens. Finally, a 3D-Digital Image Correlation technique (DIC) similar to the one used in [19] has also been set-up to capture displacement and strain fields of the deformable plates. Differently from [19], a four mirrors techniques [20] has been implemented since only one window is available at the end of the FSI module. The recorded images are post-processed with the DICengine of Sandia National Laboratories. Only some of the above mentioned techniques are used in the present study.
Output signals are recorded via a National InstrumentsTM high performance data acquisition unit (NI
PXIe-1078). Five acquisition cards PXI-5105 with 8 channels (analog input, 60 MHz maximum acquisition frequency, 12 bit a/d conversion) are used. Cards synchronization and triggering are managed via LabVIEW environment.
3.0 EXPERIMENTAL RESULTS
The experimental program was divided into three main phases. First, static tests were performed to ensure well controlled boundary conditions for the specimen’s clamping. Then, pressure loads during explosions with massive specimens are recorded and decoupled analyses are performed. Finally, the same explosion tests were done with deformable specimens i.e. with reduced thickness to get the associated deformations. This throughout experimental program allows us to issue results for a systematic numerical validation process.
Different combustion regimes representative of various explosions dynamics were selected. Depending on flame propagation regimes and structure characteristics, the combustion generated loads on structures may vary from quasi-static to dynamic ones. In case of deflagration, low speed turbulent flames cause a slow pressurization of the combustion chamber. The resulting pressure load is maintained for such a sufficiently long period that they can be considered as quasi-static. For combustion in closed volumes, the maximum pressure corresponds to Adiabatic Isochoric Complete Combustion (AICC), that can be determined from thermodynamic equilibrium conditions. This gives a conservative estimation of the structural load since (1) the combustion chamber is supposed to be adiabatic and (2) the limiting species (respectively, fuel for lean mixtures and oxidizer for rich mixtures) is supposed to be completely consumed during the combustion. Detonations are instead characterized by supersonic waves and they result in a nonuniform dynamic structural loading. For steady-state detonation, locally the mechanical response of the structure can be determined by considering the dynamic load resulting from a mono-dimensional Chapman-Jouguet detonation. For a long tube with closed ends, the maximum pressure is achieved in correspondence to the tube end, where the detonation wave is reflected. As previously, thermodynamic equilibrium codes can be used for CJ state characterization. The reflected pressure can be estimated from equation (1), according to [21]:
𝑃2 𝑃1= ( 2𝛾 𝛾+1) [ 𝑈2 𝐶1( 𝛾+1 4 ) + ([ 𝑈2 𝐶1( 𝛾+1 4 )] 2 + 1) 1/2 ] 2 − (𝛾−1 𝛾+1) (1)
where the states 1 and 2 refer to incident shock and the reflected one respectively, U2 = UCJ the CJ
In case of flame acceleration and deflagration-to-detonation transition (DDT) in long tube with closed ends, the pressure load acting on structures varies strongly in time. In the first phase, the gas ahead of the flame is precompressed by the leading shock wave; then, as the run-up distance for DDT is attained, an over-driven detonation is achieved. As shown by Kuznestov [22], the distance at which the detonation takes place strongly influences the pressure load time history. Cumulative effects of shock waves reflection and detonation occurrence make the problem more and more complex from the point of view of the structural response.
Three mixtures were selected to cover different combustion regimes and the associated pressures and velocities are given in Table 3.
Table 3. Thermo-dynamic variables of hydrogen/air mixtures at p0 = 1 bar and T0 = 300 K. Initial
mixture composition: xH2+(1-x)/(n+1) (O2+nN2), n=79.1/20.9 Property Mixture 1 Mixture 2 Mixture 3
x 0.295 0.18 0.15 PAICC (bar) 8.00 6.23 5.55 PCJ (bar) 15.58 12.04 10.65 csu (m/s) 408.7 380.0 375.1 csb (m/s) 1008.6 910.4 767.4 UCJ (m/s) 1977 1643 1524 UCJ.DEF (m/s) 1008 791 720 3.1 Static pressure results
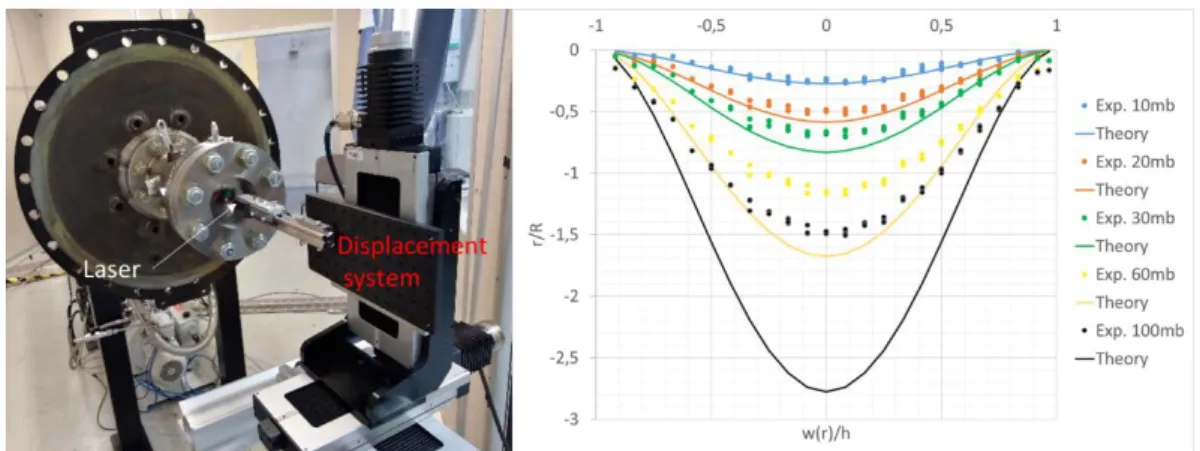
For small plate, the experimental arrangement is presented in Figure 3 (left). 304L stainless steel circular plates of h=0.47 mm uniform thickness and e=174.5 mm are used. Plates are clamped between two flanges, as shown in Figure 3. Between the plates and the flanges flat glass fiber gaskets (Klingersil) are placed on both sides for sealing and the torque applied to the nuts is 100 N.m. Preliminary tests were performed to ensure clamped boundary conditions and perfect sealing.
Tests were performed with synthetic air in sub-atmospheric conditions. Primary vacuum pump is used to decrease slowly the pressure inside the tube. The loading process is controlled through pressure transmitters and manually operated valves. The first goals of these is to verify that the stainless steel plate does deform according to linear theory. In particular, we want to verify that the constraint at the plate edge corresponds to the ideal clamping one. Once the displacement of the mid-point of the plate is stabilized, the deformation profile is recorded. Then the venting valve is gradually opened to restore the atmospheric condition inside the tube. This process is sequentially repeated by increasing the pressure difference through the plate thickness at each time. Plasticity occurs when in the unloaded configuration a residual non-negligible displacement is measured at the center of the plate.
Figure 3. Static tests for the small plate (h=0.47 mm), left – experimental arrangement, right – some results.
Typical results obtained from the tests are plotted in Figure 3 (right). The measured profiles follows the linear theory of clamped plates up to a displacement equal to about 0.5 the plate thickness which is in agreement with the hypothesis of the linear theory model. Then, this theory strongly overestimates the measured displacements. For a pressure difference of 100 mbar, the plate experienced plastic deformations. Similar tests were conducted for large plates and cylinders and we conclude that our fixation system is representative of plates with clamped edges.
3.2 Dynamic pressure results
During the first test series, massive steel plates and cylinders were used. These tests were performed to record the pressure loads for rigid walls for the different combustion regimes. Pressure sensors were installed along the adapters and at the center of the massive flange (Figure 4 - left). Unfortunately, only one sensor can be installed in the massive flange and consequently, no information can be collected on the asymmetry of the loads. A new flange with more than one port is under construction.
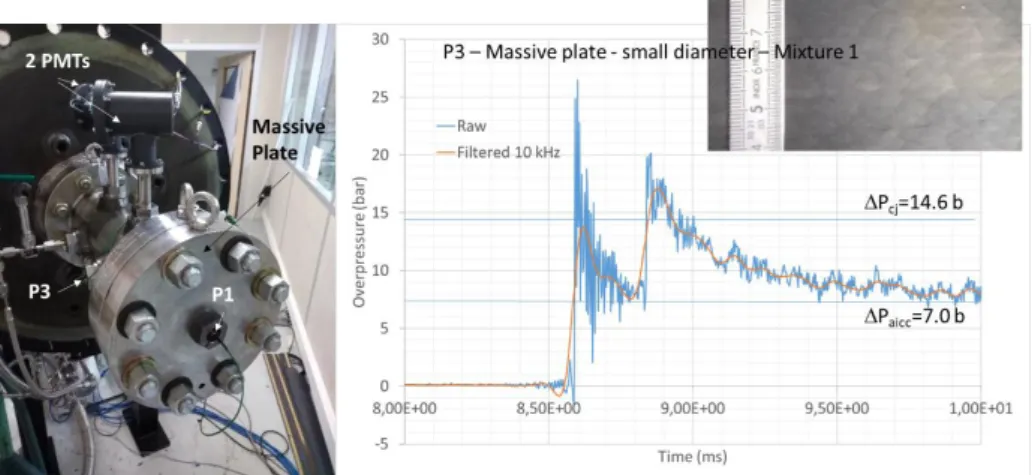
Figure 4. Dynamic tests with massive plate (small diameter): left - experimental arrangement, right – recorded pressure signal at P3 and detonation cell sizes at the end of the tube.
Our pressure sensors are screwed directly on the instrumentation ports without any damping material. Consequently, the measurements gather information coming from the fluid as well as from the structure itself. We decided to filter the raw pressure signal with a cut-off frequency just above the transverse acoustic waves in the burnt mixture i.e. 10 kHz. Examples of raw and filtered signals for the mixture 1 at location P3 are plotted in Figure 4 (right). The first coming wave is nearly a CJ detonation. It has been confirmed by cell size measurements (using a foil covered by smoke – Figure 4) and by the measurement of the reactive front velocity (~ 1906 m/s corresponding to a deficit of about 3.6% - Figure 5).
Figure 5. Dynamic tests with massive plate (small diameter): reproducibility (timescale for pressure at P3 sensor is shifted to group the sensors).
The second issue regarding qualification of the experimental facility is the reproducibility from tests to tests. The experiments with massive specimens were performed twice for mixtures 1 and 3 and a single time for mixture 2. The results are presented in Figure 5 for overpressure at P3 location. The reaction front velocity determined by the use of PMT for mixture 2 and 3 and by the pressure waves for mixture 1 (the PMT signals easily saturate in case of detonation). The relative uncertainty on the average velocity is directly proportional to the uncertainty on the flame position and it depends on the distance between two subsequent PMT. A maximum value of about 3% was estimated [18]. The results are highly reproducible for mixture 1 and 3 leading to a CJ detonation and a fast flame. For mixture 2, after reaching the choked flame regime (defined by a velocity close to the Chapman-Jouguet deflagration velocity [23]) in the middle of the tube, the reaction wave undergoes probably a transition to detonation. The comparison of pressure at P3 shows that for mixture 1 the first peak is very close to the CJ pressure and the two other mixtures, the pressure slightly exceeds this value probably due to a detonation process in already pressurized mixture. The pressure transients for mixture 1 and 3 are very similar: for mixture 2, instead, the oscillations are more pronounced. We suppose that transverse waves are responsible of these oscillations because the frequency is almost comparable to pressure wave travelling along the diameter of the tube in the burnt gases.
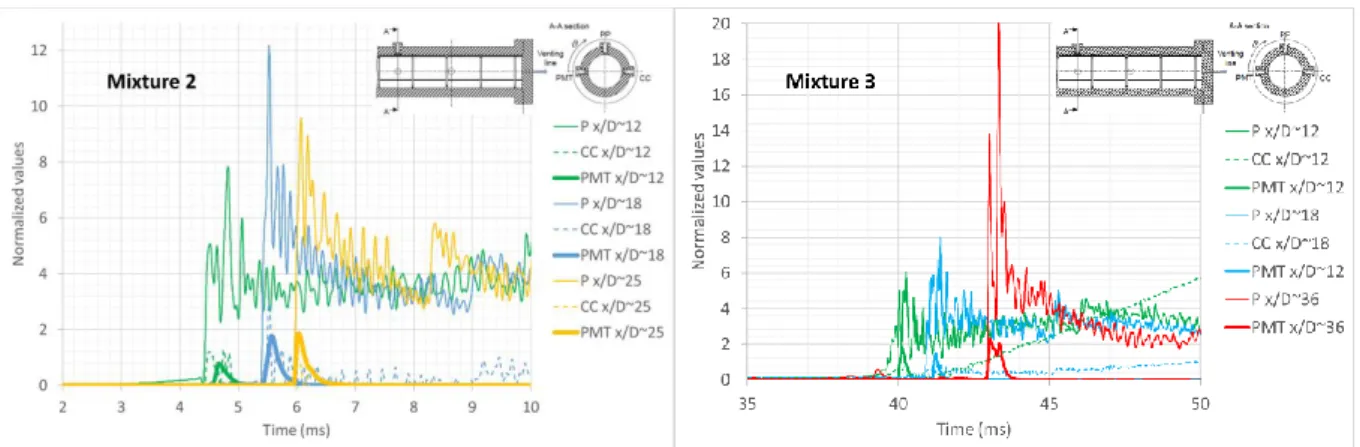
Figure 6. Dynamic tests with massive plate: behavior of the reactive wave along the tube. The combustion tube is equipped at some locations with three sensors in the same cross-section (one PMT, one pressure sensor and one shock sensor). Consequently, the local behavior of the reaction front can be analyzed for mixture 2 and 3 (Figure 6). It can clearly seen that at the first location (x/D~12) a shock wave travels ahead of the reaction front for both mixtures (about 5 bar overpressure for mixture 2 and 3 bar for mixture 3). Later, at x/D~18, the shock wave combustion front coupling is stronger for mixture 2. Finally, the reaction front is strongly coupled with the pressure waves for both mixture at x/D~25 for mixture 2 and x/D~36 for mixture 3. It can also be clearly identified that the amplitude of pressure oscillations are larger for mixture 2 than for mixture 3.
Figure 7. Dynamic tests with massive plate (small diameter): Overpressure and impulse at P1 location (timescale is shifted).
Results obtained at the end of the tube (P1 sensor) in terms of overpressure and impulse are shown in Figure 7. At this location (reflection at the end of the tube), the highest overpressure peak is measured for mixture 3 and accordingly, the increase of impulse is the highest. Mixture 2 overpressure also overcomes the detonation one. By taking the integral of the pressure profile over time, detonation of mixture 1 leads to the highest impulse followed by mixture 2 and 3: the less hydrogen content the less impulse is. These pressure loads serve as a reference for the test with the deformable specimens and they are used in a decoupled approach for CFD calculations.
The second test series was devoted to deformable specimens. The massive plates and cylinders were replaced by thin plates and centrally reduced thickness cylinders. In this article, we particularly focus on small plate results. Natural frequencies of the clamped circular plates are listed in Table 4 as a function of the plate radius R and the plate thickness h. These values were evaluated according to
𝐹𝑛,𝑚= 𝜆𝑛𝑚2 4𝜋𝑅𝑖√
𝐸ℎ2
3𝜌(1−𝜈2) (2)
and they can be used as reference values for the comparison of experimental measurements and/or numerical FEM simulation. The use of four types of plates with different geometrical dimensions allows us to cover a wide range of resonance frequencies: 247 < F01 < 686 Hz. According to Table 4, the stiffer
plate is the h1_60 plate, while the more flexible one is the h1_100 plate.
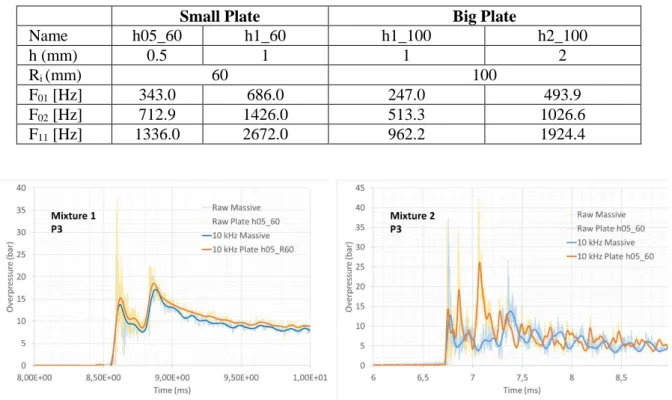
Table 4: Oscillation frequencies of circular plates with clamped edge.
Small Plate Big Plate
Name h05_60 h1_60 h1_100 h2_100 h (mm) 0.5 1 1 2 Ri (mm) 60 100 F01 [Hz] 343.0 686.0 247.0 493.9 F02 [Hz] 712.9 1426.0 513.3 1026.6 F11 [Hz] 1336.0 2672.0 962.2 1924.4
Figure 8. Dynamic tests with deformable plate (h05_60): Pressure at P3 location.
Figure 8 shows pressure measurements from P3 location during the h05_60 tests and the results for the massive plate are added for comparison. During the tests with specimens, the pressure is measured upstream the specimens since it is quite impossible to mount pressure sensors in the thin plates without modifying their structural characteristics.
For mixture 1, the two filtered signals are very similar (Figure 8 left). The first peaks vary from one test to another (about 1 bar) and this variation is observed throughout the transient. For the second peak (after reflection), it is difficult to make a conclusion as to why its value is lower when using the plate.
From this result, it is concluded that the energy absorbed by the deformation of the plate has little effect on the pressure signal. However, this point must be verified numerically. For mixture 2 (Figure 8 right), the results are completely different. First, as already mentioned, the peak following reflection in the massive case is delayed. Its passage time assuming that the incident wave corresponds to a CJ detonation and that on the return it is a sonic wave, gives around 300 µs for 0.34 m. With the h05_60 plate, these orders of magnitude are observed and the pressure peak can be clearly distinguished following reflection. On the other hand, another peak appears about 100 µs after the passage of the incident wave. Its origin is difficult to identify. From these results, it is concluded that there is a need for reproducibility tests (ongoing activities).
a) Mixture 1 b) Mixture 2
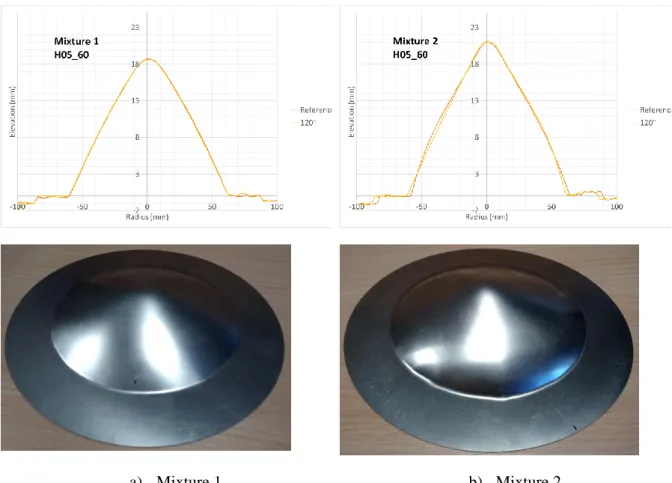
Figure 9. Dynamic tests with deformable plate (h05_60): Profiles after test and pictures of the deformed plates.
After the tests, the profiles of the deformed plates were measured and the results are plotted in Figure 9. For mixture 1 (Figure 9 left), the deformation is perfectly symmetrical and the maximum deflection of the mid-point is around 18.7 mm (mono-dimensional detonation wave). For mixture 2 (Figure 9 right), as shown in the photo and profiles, the deformation is not symmetrical and the maximum displacement of the mid-point reaches up to 21 mm. This result can be explained by the higher pressure and 3D effects.
4.0 CONCLUSIONS
The SSEXHY facility has been upgraded at CEA to deal with coupling between internal explosion of hydrogen and their effects on simple targets (plates and cylinders). The main purposes of this program are: understanding of the phenomena occurring during the fluid structure interaction and providing a full CFD grade dataset for computer code validation. An experimental program has been run in order to validate the boundary conditions for the specimen fixation by the use of static tests. Then, the loads were characterized using massive specimens for different combustion regimes, from detonation to fast flames. The results were highly reproducible for detonation and fast flames at 15 vol%. Finally, experiments
with deformable specimens were performed and they clearly show different behavior between detonation and fast flames. Pressure signals were much more complex for the latter and the resulting deformation for small plates of 0.47 mm in thickness was larger and non symmetric. Numerical simulation can be used to better understand these behaviors. Together, these results constitute a very comprehensive database for computer code validation. The interpretation of the tests for the other specimens is still ongoing as well as additional reproducibility tests.
ACKNOWLEDGMENTS
The authors would like to acknowledge the French Research Agency (ANR) for the funding of this project (ANR-11-RSNR-0015). Many thanks to CEA partners in this project, Air Liquide, EDF, IRSN, CNRS Icare and Forschung Zentrum Jülich for their support.
REFERENCES
[1] S. B. Dorofeev, M. S. Kuznetsov, V. I. Alekseev, A. A. Efimenko, and W. Breitung, “Evaluation of limits for effective flame acceleration in hydrogen mixtures,” J. Loss Prev. Process Ind., vol. 14, pp. 583–589, 2001.
[2] W. Breitung et al., “State-of-the-art Report on Flame acceleration and Deflagration-to-Detonation Transition in nuclear safety,” OECD/NEA Report, 1999.
[3] A. Velikorodny, E. Studer, S. Kudriakov, and A. Beccantini, “Combustion modeling in large scale volumes,” 2013.
[4] L. Boeck, J. Hasselberger, and T. Sattelmeyer, “Flame Acceleration in Hydrogen/Air Mixtures with Concentration Gradients,” Combust. Sci. Technol., vol. 186, no. 10–11, 2014.
[5] M. F. Ivanov, A. D. Kiverin, I. S. Yakovenko, and M. A. Liberman, “Hydrogen-oxygen flame acceleration and deflagration-to-detonation transition in three-dimensional rectangular channels with no-slip walls,” Int. J. Hydrog. Energy, vol. 38, pp. 16427–16440, 2013.
[6] T. Poinsot and D. Veynante, Theoretical and numerical combustion. Edwards, 2001.
[7] J. Hasselberger, P. Katzy, and T. Sattelmayer, “On the effect of pressure on intrinsic flame instabilities in lean hydrogen-air mixtures: part i: Detailed chemistry based direct numerical simulation,” presented at the 26th International Colloquium on the Dynamics of Explosions and Reactive Systems, Boston,USA, 2017.
[8] Health and Safety Executive, “Protection of piping systems subject to fires and explosions,” The Steel Construction Institute, 2005.
[9] W. E. Baker, P. A. Cox, P. S. Westine, J. . J. Kulesz, and R. A. Strehlow, “A Short Course in Explosion Hazards Evaluation,” 1983.
[10] T. A. Duffey, E. A. Rodriguez, and C. Romero, “Detonation-induced dynamic pressure loading in containment vessels,” Los Alamos National Laboratories, LA-UR-03-0741, 2003.
[11] W. M. Beltman and J. E. Shepherd, “Linear elastic response of tubes to internal detonation loadings,” J. Sound Vib., vol. 252, no. 4, pp. 617–655, 2002.
[12] J. E. Shepherd and F. Pintgen, “Elastic and plastic structural response of tubes to deflagration-to-detonation transition,” Explosion Dynamics Laboratory Report FM2006-005, 2006.
[13] A. Kotchourko, A. Lelyakin, and T. Jordan, “Modeling of hydrogen flame dynamics in narrow gap with bendable walls,” presented at the 7th International Conference on Hydrogen Safety (ICHS2017), Hamburg, Germany, 2017.
[14] EUROPLEXUS, EUROPLEXUS. A simulation software for fast transient phenomena involving structures and fluids. www-epx.cea.fr. .
[15] R. Scarpa, E. Studer, B. Cariteau, S. Kudriakov, and N. Chaumeix, “Influence of initial pressure on hydrogen/air flame acceleration during severe accident in NPP,” Hamburg, Germany, 2017. [16] A. Bentaib, E. Studer, N. Chaumeix, S. Magne, E. Reinecke, and D. Pinet, “MITHYGENE project:
Towards the improvement of hydrogen risk assessment models and safety management procedures,” Chiba, Japan, September 3-5, 2014.
[17] R. Scarpa, E. Studer, B. Cariteau, S. Kudriakov, and N. Chaumeix, “Infrared Absorption Measurements of the Velocity of a Premixed Hydrogen/Air Flame Propagating in an Obstacle-Laden Tube,” Combust. Sci. Technol., pp. 1–15, Jul. 2018.
[18] R. Scarpa, “Mécanismes d’accélération d’une flamme de prémélange hydrogène/air et effets sur les structures,” Orléans, 2017.
[19] V. Aune, E. Fagerholt, M. Langseth, and T. Borvik, “A shock tube facility to generate blast loading on structures,” Int. J. Prot. Struct., vol. 7, no. 3, pp. 340–366, 2016.
[20] L. Yu and B. Pan, “Single-camera stereo-digital image correlation with a four-mirror adapter: optimized design and validation,” Opt. Lasers Eng., vol. 87, pp. 120–128, 2016.
[21] S. R. Tieszen, “Effect of initial conditions on combustion generated loads,” Nucl. Eng. Des., vol. 140, pp. 81–94, 1993.
[22] M. Kuznetsov, J. Grune, A. Lelyakin, W. Breitung, K. Sempert, and A. Friedrich, “Dynamic effects under gaseous detonation and mechanical response of piping structures,” presented at the ASME International Mechanical Engineering Congress & Exposition, 2009.
[23] R. S. Chue, J. F. Clarke, and J. H. S. Lee, “Chapman-Jouguet deflagrations,” Proc. R. Soc. Lond. A, vol. 441, pp. 607–623, 1993.