HAL Id: hal-02946623
https://hal.archives-ouvertes.fr/hal-02946623
Submitted on 16 Apr 2021HAL is a multi-disciplinary open access
archive for the deposit and dissemination of sci-entific research documents, whether they are pub-lished or not. The documents may come from teaching and research institutions in France or abroad, or from public or private research centers.
L’archive ouverte pluridisciplinaire HAL, est destinée au dépôt et à la diffusion de documents scientifiques de niveau recherche, publiés ou non, émanant des établissements d’enseignement et de recherche français ou étrangers, des laboratoires publics ou privés.
Structural-scale modeling of the active confinement
effect in the steel-concrete bond for reinforced concrete
structures
C. Turgut, Ludovic Jason, L. Davenne
To cite this version:
C. Turgut, Ludovic Jason, L. Davenne. Structural-scale modeling of the active confinement effect in the steel-concrete bond for reinforced concrete structures. Finite Elements in Analysis and Design, Elsevier, 2020, 172, pp.103386. �10.1016/j.finel.2020.103386�. �hal-02946623�
1
Structural-scale modeling of the active confinement effect in the
steel-1concrete bond for reinforced concrete structures
2C. Turgut*, L. Jason*, L. Davenne**
3
* SEMT, CEA DEN, Université Paris Saclay, F-91191 Gif sur Yvette, France 4
Email: ludovic.jason@cea.fr 5
** LEME, UPL, Univ Paris Nanterre, F-92410 Ville d’Avray, France 6
7
Abstract
8
A numerical model to take into account the effect of the stress state on the bond behavior between 9
steel and concrete in reinforced concrete structures is proposed. It is based on a zero thickness 10
element, adapted to large-scale simulations and the use of 1D elements for steel bars. The proposed 11
model also assumes the definition of a bond stress – slip law which includes the confining pressure 12
around the steel bar as a parameter. The implementation of the model is presented and the 13
calibration of the bond law is discussed. A general equation is especially proposed. This evolution law 14
is validated through the comparison to 28 pullout tests. The model is able to reproduce the evolution 15
of the bond stress (especially the bond strength) as a function of the confinement pressure, 16
whatever the configuration (different concrete cover to steel diameter ratios). Finally, the effects at 17
the structural level are investigated on a reinforced concrete tie. The response for different confining 18
pressures is especially studied. It shows the capability of the model to reproduce the “expected” 19
tendencies with an increase of the initial elastic stiffness with increasing pressures and consequently 20
a higher number of cracks in the stabilized nonlinear regime. The “transfer length” is also shown to 21
decrease with increasing confining pressures. 22
1. Introduction
23
Steel is widely used in civil engineering applications to strengthen concrete in tension. These so-24
called reinforced concrete structures, which present a more ductile behavior compared to plain 25
concrete, may nevertheless be subjected to cracking. In this case, when a crack initiates, stresses in 26
concrete drop to zero and the loading is totally supported by the reinforcement. They are then 27
responsible for stress transfer around the crack from steel to concrete. This progressive 28
redistribution, which can be easily demonstrated in the case of a reinforced concrete tie (Figure 1) 29
[1], is directly influenced by the bond properties [2]. That is why the influence of the steel-concrete 30
bond has to be carefully studied, especially when the crack properties, which are directly related to 31
this stress distribution, play a key role in the structural functions (failure mode and confinement [3] 32
for example). 33
Experimentally, steel-concrete bond is generally described following three different steps [4]: a 34
perfect “chemical” bond (no slip), then a gradual degradation of concrete around the steel ribs, 35
followed by crack propagation (associated with a steel-concrete slip), and finally a total degradation 36
of the interface with only a residual friction. It generally leads to the definition of an adhesion law 37
that gives the evolution of the bond stress as a function of the slip at the interface (Figure 2). The 38
influent parameters on this adhesion law have been widely studied in the literature. 39
2 41
Figure 1. Principle of the distribution of steel and concrete stresses in a reinforced concrete tie after the first 42
crack (c and s stand for the stresses in concrete and steel respectively) [1].
43
44
Figure 2 : Example of experimental bond stress-slip law [5]. 45
Steel and concrete properties (relative rib area [6], steel diameter [7], concrete compressive and 46
tensile strength [8]-[9] and concrete cover to steel diameter ratio [10]) can be considered as the main 47
impacting parameters. They lead to potential complex formulations for the adhesion law, including a 48
distinction between splitting and pullout failure ([11] among others). 49
Besides these material or geometrical parameters, the stress state around the reinforcement may 50
have also an impact on the adhesion law. Especially, the confinement inside concrete may increase 51
the bond strength. This confinement effect can be induced either directly (by the application of an 52
external loading, like a pressure or a prestress) or indirectly (through the presence of secondary 53
reinforcements which prevents concrete cracking in certain directions [12]). Experimental studies, 54
generally performed on pullout tests, conclude on a positive influence of the concrete compression 55
stress state, whose range is dependent on the geometry of the specimen (concrete cover) [13] [14]. 56
Eligehausen et al. [5] especially showed that the maximum bond stress increases with the imposed 57
lateral pressure. Malvar [15] obtained around twice the initial bond strength by applying a lateral 58
pressure from 3.5 to 31 MPa. Verderame et al. [16] and Jin et al. [17] demonstrated that the active 59
confinement had a significant effect on the cyclic bond behavior. 60
Some empirical formula were then proposed for the adhesion law to take into account this effect. 61
Based on the experimental observations from [5], [15] and [18], Lowes et al. [19] proposed a 62
relationship between the ultimate bond strength and the confining pressure, which explicitly 63
includes the lateral pressure. Xu et al. [20], Zhang et al. [21], Wu et al. [22] also included the positive 64
effect of lateral compression and the negative effect of lateral tension [23] in the bond stress – slip 65
law. 66
Even if the influence of the stress state on the bond properties has been experimentally observed, its 67
inclusion in a finite element model, compatible with engineering computations, is rather rare in the 68
literature, despite the attempts from Lowes et al. [19] for example. In this contribution, a dedicated 69
3 finite element model is thus proposed, based on the initial contribution from Mang et al. [24]. It is 70
improved to take into account the stress state in the bond behavior. It supposes the definition of a 71
bond stress – slip law, which is dependent on the stress state. A law is proposed and discussed by a 72
comparison to experimental results on pullout tests. Finally, the simulation of a reinforced concrete 73
tie subjected to different lateral pressures illustrates the impact of the confinement at a structural 74
level. It is especially shown how the lateral pressure can affect the transfer length between steel and 75
concrete. 76
2. Steel concrete bond model including “confinement” effect
77
2.1. Presentation of the interface element 78
When reinforced concrete structures are considered, one of the most usual hypotheses, especially 79
for engineering computations, is to model the steel reinforcement as truss elements and to consider 80
a no-slip perfect relation between steel and concrete. This perfect relation is generally applied 81
through kinematic relations between both models, using the shape functions of each element. 82
However, it may have consequences, especially when the crack properties (spacing and openings) are 83
studied, as the steel – concrete bond directly influences their evolutions ([25] for example). To take 84
into account the interfacial behavior between steel and concrete in a more appropriate manner, 85
different models exist. They range from analytical or semi-analytical approaches (tension-stiffness 86
effect in uniaxial tension [26], [27]) to more complex simulation methods (including fracture 87
mechanics [28]). In the frame of finite element method and continuum mechanics, Ngo and Scordelis 88
[29] proposed a spring element, associated with a linear law, to relate concrete and steel nodes. To 89
improve the description of the bond behavior, joint elements have been developed. These zero 90
thickness elements, introduced at the interface between steel and concrete, allow the use of a 91
nonlinear law ([30], [31] among others). Special finite elements can also be used to enclose, in a 92
same element, the material behavior (steel or/and concrete) and the bond effects [32]. 93
Ibrahimbegovic et al. [33]), among others, also proposed embedded elements whose principle is to 94
describe the steel-concrete bond behavior through an enrichment of the degrees of freedom. Even if 95
these solutions give appropriate results, one of their main drawbacks, in the context of industrial 96
applications, is the need to explicitly consider the interface between steel and concrete. It may 97
impose meshing difficulties and heavy computational cost which are not compatible with large scale 98
simulations. 99
To overcome these difficulties, alternative solutions exist. For example, in [34], the slippage is 100
accounted for in an indirect manner through damage factors and the method is applied successfully 101
to full-scale RC structures. However, when the values of the slip are needed (for example, to capture 102
the position and the opening of the cracks [35]), the slippage has to be explicitly computed. To do so, 103
Lykidis [36] proposed a link element using 1D rebar elements embedded within 20-noded hexahedral 104
element. An alternative approach has also been developed in [1] then [24] to represent bond effects 105
between steel, modeled with truss elements, and the surrounding 3D concrete through a “1D-3D” 106
interface element. This type of developments can be seen as a macroscopic representation of local 107
effects at the interface between steel bar ribs and surrounding concrete. It is to be noted that these 108
local effects could be also considered at a very local scale using only adapted constitutive laws for 109
concrete and steel. However, the resulting approach would not be compatible with structural scale 110
computations, contrary to the proposed strategy. 111
4 112
Figure 3. Principle of the interface element between steel and concrete [24]. 113
114
Figure 4. Degrees of freedom of the interface element [24]. 115
116
Figure 5. Definition of the slip between steel and concrete in the interface element in the (t, n1) plane [24].
117
In this contribution, the formulation of the element, initially developed in [24], is improved to take 118
into account the influence of the concrete stress state. 119
The principle of the interface element is first briefly recalled. It is a zero thickness four node element 120
which relates each steel truss element with an associated superimposed segment, perfectly bonded 121
to the surrounding concrete (Figure 3), through additional kinematic relations. The nodal unknowns 122
of the reinforcement bar are thus retained and a relative slip between steel and concrete becomes 123
possible through the interface element. Each node of the interface element has three degrees of 124
freedom (nodal displacements) (Figure 4). The relation between the generalized slip in the local 125
direct frame {𝛿()} (Figure 5) and the nodal displacements
u is written in the following form: 126 {𝛿()} = {𝛿𝑡() 𝛿𝑛1() 𝛿𝑛2()}𝑇= 𝐵̅̅(){𝑢} ( 1 ) 127 with 128 𝐵̅̅() = [𝐵̅̅̅̅̅̅(1 ) 𝐵̅̅̅̅̅̅(2 ) −𝐵̅̅̅̅̅̅(1 ) −𝐵̅̅̅̅̅̅(2 )] ( 2 ) 129 and 130 𝐵1 ̅̅̅ ̅̅̅() = 0.5(1 −)𝐼̅̅3 𝐵2 ̅̅̅ ̅̅̅() = 0.5(1 +)𝐼̅̅3 ( 3 ) 1315 where 3 1 0 0 0 1 0 0 0 1 I and −1 ≤≤ 1 (Figure 5). 132
Constitutive laws needs then to be defined between the bond stress {𝜎()} = { 𝜎𝑡()
𝜎𝑛1()
𝜎𝑛2()
} and the slip 133
{𝛿()}. In the tangential direction, the tangential stress t is computed from the tangential slip:
134
𝜎𝑡() = 𝑓(𝛿𝑡()) ( 4 )
135
In the normal directions, a linear relation is assumed between the stresses n1 and n2 and the
136
corresponding normal slips: 137 {𝜎𝑛1() 𝜎𝑛2() } = 𝑘𝑛{ 𝛿𝑛1() 𝛿𝑛2() } ( 5 ) 138
For the sake of simplicity, the value of the normal stiffness kn is chosen high enough to be
139
representative of a perfect bond in the normal directions (kn = 1015 Pa.m-1 in the following). An
140
improvement could be to take into account the effect of the slip behavior in the normal direction in a 141
more appropriate way. One solution would be to consider a unilateral contact if normal stress is in 142
tension, or to include a simple damage model. However, in classical configuration, the mechanical 143
degradation of the concrete elements related to the interface element is supposed to be enough to 144
capture the overall behavior correctly. 145
This first version of the model is improved to consider the effect of the confinement pressure in the 146
tangential bond behavior. Eq. (4) is thus replaced by: 147
𝜎𝑡() = 𝑓(𝛿𝑡(), 𝑝𝑙𝑎𝑡) ( 6 )
148
with plat the concrete confinement pressure. It is computed using the same definition as in [20] [21] 149
and based, by hypothesis, on the mean value of the normal concrete stresses: 150 1 1 2 2 2 n n n n lat p ( 7 ) 151
where n n1 1 and n n2 2 are the calculated concrete stresses in n1 and n2 directions. Eq. (6) is
152
computed at each of the two integration points of the interface element to obtain the bond nodal 153
forces after an analytical integration [24]. The concrete stresses are thus needed to be calculated at 154
the position of these integration points, using the shape functions of the concrete elements. 155
In this contribution, the distribution of the confinement pressure plat is calculated at the end of each
156
converged loading step. It is then used at the following loading step, especially for equation (6). 157
There is no update during each internal iterative loop. This kind of consideration may delay the 158
response of the active confinement on the bond but can be easily compensated by using sufficiently 159
small calculation steps. Moreover, regarding the quasi-static evolution of the studied systems and 160
the expected loading history (confinement pressure generally applied in one-step), this simplification 161
is considered valid. 162
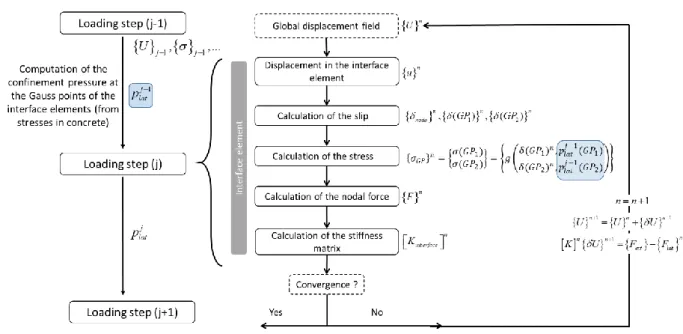
The general algorithm is summarized in Figure 6. The overall convergence is obtained with a 163
tolerance equal to 10-4.
6 166
167
Figure 6. Principle of the resolution for the interface element. j stands for the loading step, n for the iteration 168
number. U and u are the global displacement field and the displacement in the interface element respectively. U 169
is the increment in the displacement for each iteration. is the slip, the stress and GP1 and GP2 are the
170
positions of the two integration points for each interface element. F are the nodal forces and K the resolution 171
matrix. 172
It is to be noted that one advantage of the proposed method is the possibility to mesh 1D steel bars 173
and 3D concrete volumes can be meshed independently. For large industrial structures with a high 174
number of rebars ([37] for example), an efficient mesh generation method can also be considered 175
([38]). 176
2.2. Proposition of a tangential bond law including confinement 177
As previously mentioned, taking into account the influence of the concrete stresses on the bond 178
properties supposes the definition of an appropriate bond stress – slip law in the tangential direction. 179
This should observe the following experimental statements: 180
Zhang, et al. [14], Lowes, et al. [19], Robins and Standish [39], among others, reported that 181
the active confinement effect is not significant on the shape of the bond law but can be considered 182
only on the value of the bond stress for a given slip. 183
Tension and compression stress states have different effects on the bond behavior. The bond 184
strength increases with increasing lateral compression ([20], [39]), while it decreases with increasing 185
lateral tension [22]. 186
Bond properties increase with the ratio of lateral pressure over the compressive strength fc :
187 ( lat) t c p f f ([5], [21], [40]) 188
Finally, the lower the concrete cover c to steel diameter ds ratio, the greater the effect of
189
lateral pressure ([20], [41]). This transition in the behavior is recognized in [42]. The confining 190
7 pressure is considered to be only able to enhance splitting behavior (small c/ds ratio) whereas the
191
pullout limit state (where the concrete fails in shear – higher c/ds ratio) is not enhanced significantly
192
by confinement. This ratio has already been highlighted in case of no “active” confinement (plat = 0)
193
[11]. 194
Based on these four main considerations, the influence of the lateral pressure is proposed to be 195
considered in Eq. (6) through Eq. (8). For sake of simplicity, in the following, will stand for the 196
tangential bond stress t .
197
𝜏(𝑝𝑙𝑎𝑡, 𝛿𝑡) = 𝜏0(𝛿𝑡)(1 − 𝑠𝑔𝑛(𝑝𝑙𝑎𝑡). 𝛼√| 𝑝𝑙𝑎𝑡
𝑓𝑐 |) ( 8 )
198
0 is the bond stress – slip law for plat = 0 and is a parameter. sgn stands for the sign of plat (>0 in
199
tension and <0 in compression) in order to represent the different effect of the confinement in 200
tension and in compression. is defined as a function on the concrete cover to steel bar diameter 201
ratio. A transition value for c/ds is especially considered, below which the influence of lateral
202
pressure is quite strong and above which its influence is weak [20] [42]. This transition value is 203 chosen from [11]: 204 ( ) 0.39 c 0.24 tr s t f c d f ( 9 ) 205
with ft the concrete tensile strength.
206
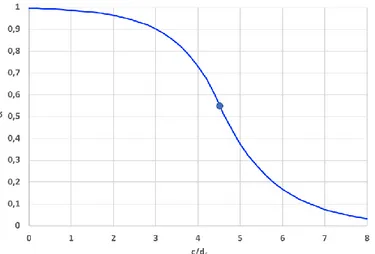
α is near 1 for very small c/ds ratios and tends toward 0 for large values, with a quite strong drop
207
around the transition value.A continuous expression is proposed based on exponentials: 208 ( ) 1 c a d e if ( )tr s s c c d d ( 10 ) 209 ( ) s c b d e if ( )tr s s c c d d ( 11 ) 210
β and γ are parameters to control the shape of the exponentials, while a and b are adjusted to assure 211
the continuity of α and its derivative at the transition point ( )tr
s c
d . In the following β=1 and γ=0.8. An
212
example of the evolution of as a function of ( )
s c
d for ( s)tr 4.5 c
d (a=5.31 and b=3.77) is given in
213
Figure 7. The resulting bond stress – slip laws for ( )
s c
d = 2 and ( s) c
d = 7 and different plat values are
214
given in Figure 8 (fc chosen equal to 30 MPa). In Figure 8, a piecewise linear curve has been
215
considered as input data for0( )g but some more complex evolutions could also have been chosen
216
(nonlinear curve for example). 217
8 219
Figure 7. Evolution of α as a function of c/ds for (c/ds)tr= 4.5.
220
221
Figure 8. Bond stress – slip laws for (c/ds)tr= 4.5 and fc = 30 MPa and different confinement pressures. Left,
222
(c/ds=2), right (c/ds) = 7. 0, max stands for the bond strength at plat = 0.
223
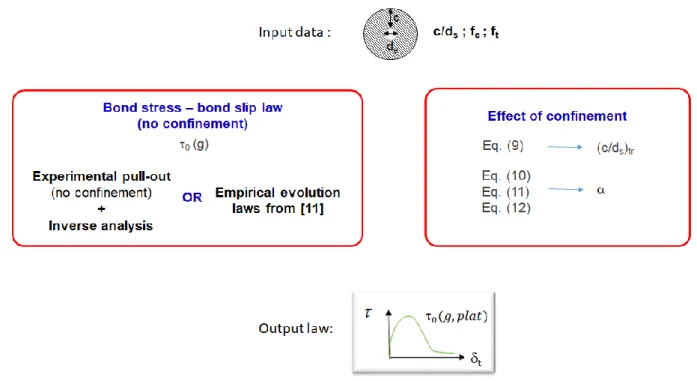
The calibration of the bond stress – slip law can be summarized in four main steps: 224
Definition of the initial interface law 𝜏0(𝛿𝑡) from either experimental or empirical evolutions.
225
In particular, the experimental bond stress – slip law obtained from a pullout test without any 226
confining pressure (Pconf = 0 MPa) can be used [43]. 𝜏0(𝛿𝑡) may be slightly different from the
227
experimental pullout curve at Pconf = 0 MPa, to take into account the effect of lateral pressure plat (0)
228
around the steel bar during the pullout, even for a zero applied confinement pressure (structural 229
stress related to the type of test). If the experimental bond stress – slip law at Pconf = 0 MPa is not
230
available, it is possible to build the expected curve using the methodology proposed in [11], solely 231
from the material and geometric parameters. 232
Given the geometrical and material parameters ( )
s c d , fc and ft, calculation of ( s)tr c d from Eq. (9) 233 Given ( )tr s c
d , calculation of parameters a and b to ensure the continuity of Eq. (10) and Eq. (11)
234
and its derivatives. Definition of ( )
s c d . 235 Given ( ) s c d , ( s) c
d and 𝜏0(𝛿𝑡), definition of the bond stress – slip law 𝜏(𝑝𝑙𝑎𝑡, 𝛿𝑡) from Eq. (7)
236
and Eq. (8). 237
9 As a summary, for a given geometry (associated to a given ( )
s c
d ), and a given concrete (associated to
238
a compressive strength and a tensile strength), the definition of the adhesion law only requires the 239
initial bond stress – slip law 0(𝛿𝑡) (for plat = 0) that can be obtained either experimentally by inverse
240
analysis or numerically (Figure 9). 241
Compared to other evolution laws that are found in literature, the proposed methodology can be 242
viewed as more general. For example, in [44], two evolution laws were proposed for two steel 243
diameters, without any generalization. In [20], [21], [22], the shape and the parameters of the laws 244
were functions of the loading (compression, tension, tension – compression respectively). Moreover, 245
these former approaches were not expected to distinguish splitting and pullout failures as it is the 246
case for the present methodology through the comparison to the transition value of ( )
s c
d . It can also
247
be considered as easy to use, especially compared to more complex approaches in literature. For 248
example, in [18], relations between the bond strength, the radial stress, the slip and the crack 249
opening have been proposed, whose extension to a single independent relationship between 250
concrete confinement and peak bond strength and radial force is not trivial [45]. Finally, as the 251
proposed relation is function of the mean normal stresses around the bar, it is expected to reproduce 252
both “active” and indirect confinements (through an applied pressure or transverse reinforcements 253
respectively). Finally, the application to cyclic loadings could be considered, provided an adaptation 254
of the bond stress-slip to alternative load (from [5] for example, combined with additional 255
experimental data) and an adapted constitutive law for concrete. 256
257
258
Figure 9. Summary of the calibration of the bond stress – slip law, including the effect of the stress state. 259
260 261
10 To validate the proposed bond stress – slip law, pullout tests from [11], [13] and [41] are simulated. 263
3.1 Test specimen 264
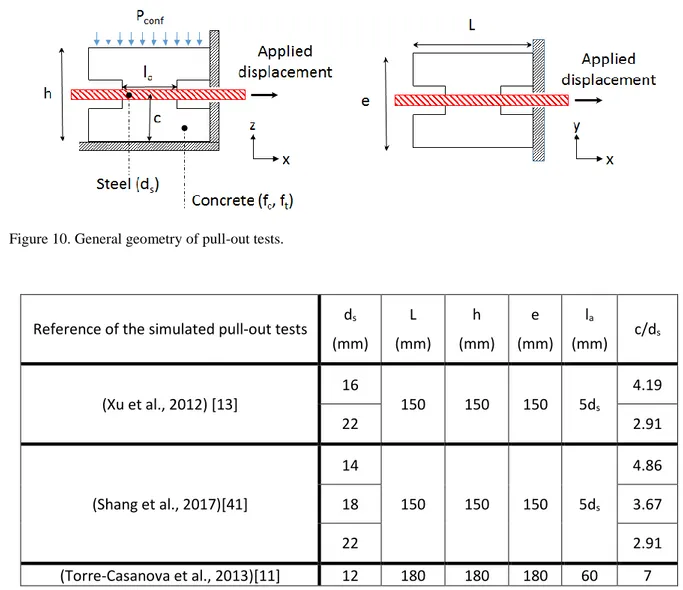
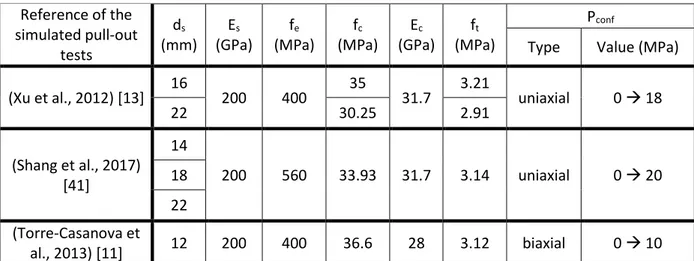
The generic geometry of pullout tests is presented in Figure 10. The detailed geometry, properties 265
(concrete compressive strength fc, tensile strength ft and Young modulus Ec, steel Young modulus Es
266
and yielding stress fe) and loadings (applied uniaxial or biaxial compressive confinement pressure
267
Pconf) are given in Table 1 and Table 2. Concrete properties are either obtained from the given
268
average values of experimental uniaxial compressive and tensile tests when available or evaluated 269
using the equations provided in [2] ( 0.3
22000( ) 10 c c f E ), 0.3( )2/3 t c f f ). 270
The proposed validation includes different concrete properties, steel diameters and confining 271
pressures to represent a wide enough range of configurations. In particular, it encloses 272
configurations in which the ratio of the concrete cover over the steel diameter is higher and smaller 273
than the transition value (Eq. (9)). It means that pullout and splitting failures are both considered in 274
the validation process. 275
276
Figure 10. General geometry of pull-out tests. 277
278
Reference of the simulated pull-out tests ds (mm) L (mm) h (mm) e (mm) la (mm) c/ds (Xu et al., 2012) [13] 16 150 150 150 5ds 4.19 22 2.91 (Shang et al., 2017)[41] 14 150 150 150 5ds 4.86 18 3.67 22 2.91 (Torre-Casanova et al., 2013)[11] 12 180 180 180 60 7
Table 1. Geometries of simulated pullout tests. 279
11 Reference of the simulated pull-out tests ds (mm) Es (GPa) fe (MPa) fc (MPa) Ec (GPa) ft (MPa) Pconf
Type Value (MPa)
(Xu et al., 2012) [13] 16 200 400 35 31.7 3.21 uniaxial 0 18
22 30.25 2.91 (Shang et al., 2017) [41] 14 200 560 33.93 31.7 3.14 uniaxial 0 20 18 22 (Torre-Casanova et al., 2013) [11] 12 200 400 36.6 28 3.12 biaxial 0 10
Table 2. Material properties and loadings for the pullout tests. 281
282
Figure 11. Example of concrete mesh for the simulations of pullout tests from [41] – ds = 14 mm. On the left,
283
entire mesh, on the right, cross section along the position of the steel bar. 284
285
Figure 12. Boundary conditions (left and middle) and loadings (right) for the simulation of pullout tests – case of 286
uniaxial confinement. 287
3.2. Presentation of the simulations 288
The simulations are performed in the finite element code Cast3M [46] using cubic elements for 289
concrete, 1D truss elements for steel and the steel-concrete bond model presented in section 2.1. An 290
illustration of the concrete mesh is proposed in Figure 11. The loading and boundary conditions are 291
illustrated in Figure 12. They include zero displacement conditions on appropriate faces and imposed 292
displacements at the loaded end of the steel bar. The confinement is modeled through a uniform 293
12 imposed displacement).
295
Concrete behavior is simulated using a damage model, which includes irreversible strains [47]. 296
Damage is represented by two independent variables d + and d - which have respectively an influence 297
in tension and compression. The stress σ is evaluated from the following relation: 298
𝝈 = [1 − 𝑑+(𝝈′+)]𝝈′++ [1 − 𝑑−(𝝈′−)]𝝈′− ( 12 )
299
where
𝝈
′+and𝝈
′−correspond respectively to the positive and the negative parts of the effective300
stress
𝝈
′:301
𝝈
′= 𝑪(𝜺 − 𝜺
𝒑)
( 13 )302
In this relation, C is the tensor of elasticity and ε represents the total strain.
𝜺
𝒑stands for the303
irreversible strains which are governed by the damage evolution in compression: 304
𝜺̇
𝒑= 𝛽
𝑝
𝐸
𝑐𝐻(𝑑̇
−)〈𝝈
′: 𝜺̇〉/(𝝈
′: 𝝈
′)𝑪
−1: 𝝈
′ ( 14 )305
where p is a model parameter and H is the Heaviside function. 〈. 〉 represents the positive part of the 306
tensor. The tensile part of the model is regularized using the Hillerborg concept of fracture energy 307
that guarantees a constant energy release, independently from the mesh size [48]. The model 308
parameters are chosen to be as representative as possible to the experimental uniaxial concrete 309
properties. 310
For sake of simplicity, the 1D steel bar follows an elastic- perfect plastic law using the steel properties 311
provided in Table 2. It was checked that the yielding stress was not reached during the simulation (no 312
influence of the plastic part of the model). 313
The bond stress - slip law is calibrated following the methodology described in Figure 9 from the 314
experimental result at a zero confinement pressure. The obtained simulated plat distribution along
315
the bar is given in Figure 13 at Pconf = 0 MPa. The difference between the input law and the simulated
316
bond behavior, which results from the inverse analysis and the effect of the non-zero plat distribution,
317
is illustrated in Figure 14. 318
319
Figure 13. Simulation of a pullout test from [36] - ds = 14 mm. plat distribution along the steel bar for Pconf = 0
320
MPa at the applied displacement corresponding to the bond strength. 321
13 322
Figure 14. Simulation of a pullout test from [41] - ds = 14 mm. Input calibrated bond law and simulated bond
323
stress – slip law for Pconf = 0 MPa.
324
3.3. Results 325
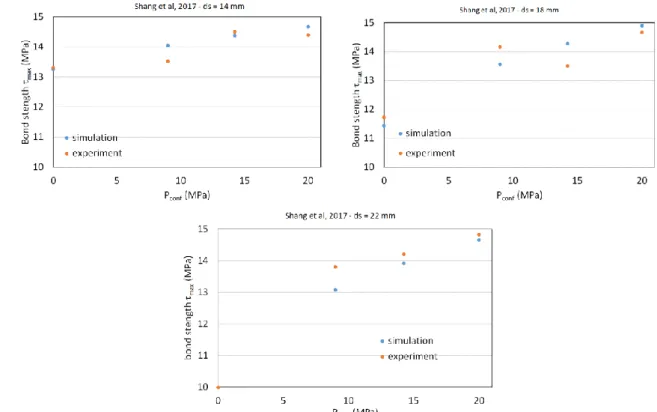
The simulated maximum bond stresses are compared to the experimental ones for different levels of 326
applied confinement pressures in Figure 15 ([41]), Figure 16 ([13]) and Figure 17 ([11]). It has been 327
chosen to perform the comparison on the bond strength, as it is the main mean characteristic, which 328
is experimentally studied. Moreover, the existence of mean values (which may be the only quantity 329
given in the experimental results - [36] for example) enable to reduce the experimental discrepancy 330
associated to this type of tests, compared to single bond stress – slip curves. 331
The simulated bond strength is calculated using the same equation as for the experiment: 332 max max s a F d l ( 15 ) 333
where Fmax is the maximum applied force at the loaded end of the steel bar. Eq. (15) thus represents
334
a “mean” measure of the bond along the steel bar. 335
14 336
337
Figure 15. Evolution of the bond strength as a function of the applied confinement pressure – experiments from 338
[41] (only mean values were experimentally provided). 339
340
Figure 16. Evolution of the bond strength as a function of the applied confinement pressure – experiments from 341
[13]. 342
343
Figure 17. Evolution of the bond strength as a function of the applied confinement pressure – experiments from 344
[11]. 345
15 ds = 16 mm ds = 22 mm Applied confining pressure (MPa) Simulated bond strength (MPa) Mean experimental bond strength (MPa) Mean error (%) Simulated bond strength (MPa) Mean experimental bond strength (MPa) Mean error (%) 0 11.39 11.28 5.9 8.92 8.92 2.1 0.1 fc 12.31 12.64 4.2 10.55 9.36 12.6 0.2 fc 12.78 11.93 6 11.29 10.45 13.5 0.3 fc 13.17 12.57 11.9 11.81 10.60 12.6 0.4 fc 13.48 12.09 16.7 12.28 11.69 8.4 0.5 fc 13.76 15.20 14.7 12.68 11.5 15.3 0.6 fc - - - 13.04 12.44 12.7
Table 3. Simulated and experimental bond strength and mean error. Pullout tests from [13]. 347 ds = 12 mm Applied confining pressure (MPa) Simulated bond strength (MPa) Mean experimental bond strength (MPa) Mean error (%) 0 24.36 24.27 9.3 5 24.42 25.5 4.4 10 24.54 26.30 15.1
Table 4. Simulated and experimental bond strength and mean error. Pullout tests from [11]. 348 ds = 14 mm ds = 18 mm Applied confining pressure (MPa) Simulated bond strength (MPa) Mean experimental bond strength (MPa) Mean error (%) Simulated bond strength (MPa) Mean experimental bond strength (MPa) Mean error (%) 0 13.26 13.32 0.4 11.43 11.73 2.6 9 14.05 13.53 3.7 13.57 14.16 4.3 14 14.38 14.51 0.9 14.24 13.51 5.1 20 14.68 14.4 1.9 14.9 14.67 1.5 ds = 22 mm Applied confining pressure (MPa) Simulated bond strength (MPa) Mean experimental bond strength (MPa) Mean error (%) 0 9.98 10 0.2 9 13.08 13.81 5.5 14 13.92 14.21 2.0 20 14.66 14.83 1.1
Table 5. Simulated and experimental bond strength and mean error. Pullout tests from [41]. 349
The results are summarized in Table 3, Table 4 and Table 5 with a comparison on the mean values of 350
the simulated and experimental bond strength in each configuration. For a given configuration 351
(same reference, same steel diameter and same applied confinement pressure), the mean error is 352
also computed as the mean difference between the simulated bond strength and each measured 353
experimental bond strength, over the simulated bond strength. 354
A good agreement is generally obtained for the different values of the applied pressures and in the 355
different geometrical and material configurations (especially for different ( )
s c
d ). It is to be noted that
16 simulation is obtained if the simulation results (which are by definition deterministic in our case) are 358
in the range of the experimental ones (with a maximum mean error equal to 15%, which is quite 359
reasonable here). As a conclusion, the proposed comparison validates the proposed methodology 360
and especially the evolution law for the bond stress (at least regarding the bond strength). 361
4. Structural consequences of the confinement effect – structural case
362
The previous section was dedicated to the validation of the bond stress – slip law as a function of the 363
lateral pressure along the steel bar. In this section, the consequences at the structural level is going 364
to be investigated by the simulation of a reinforced concrete tie loaded both in tension and in 365
confinement. The consequences are studied in terms of global and local behaviors. 366
4.1. Presentation of the test 367
A reinforced concrete tie (length L equal to 1.15 m, square section Sc equal to 0.01 m²), crossed by a 368
steel bar (diameter ds equal to 10 mm for a section Ss equal to 78.5 mm2) is considered (Figure 18).
369
Concrete and steel are meshed using solid elements for concrete and truss elements for steel, 370
respectively (Figure 19). 371
372
Figure 18. Presentation of the reinforced concrete tie. Geometry, boundary conditions and loading. 373
374
Figure 19. Concrete mesh for the reinforced concrete tie. 375
17 At each end of the steel bar, one element is added to apply the boundary conditions (no 377
displacement at one end) and the loading (imposed horizontal displacement at the other end) (Figure 378
18). This particular structural test was chosen because it was successfully modeled in [24] and 379
experimentally studied in [49]. 380
The steel bar is modeled using an elastic-plastic law with linear hardening. Concrete follows the 381
damage constitutive law presented in the previous section from [47]. Parameters given in Table 6 382
and Table 7 are chosen, in agreement with the experimental data. A random distribution of the 383
tensile strength is introduced in order to localize the damage during loading (Figure 20). This 384
Gaussian, stationary random scalar field is generated using the turning band method. It has an 385
isotropic exponential covariance, whose matrix is computed from the standard deviation and the 386
correlation lengths. The mean value, the standard deviation and the correlation length are chosen 387
equal to the mean tensile strength (2.9 MPa), 5% and 3 cm respectively. 388
For the bond model, only the bond stress – slip law 0(𝛿𝑡) has to be provided. A piecewise linear
389
curve is chosen, following the recommendations from [11]. The parameters are given in Table 8. The 390
effect of the confinement is taken into account using the methodology presented in the previous 391
sections (calculation of especially). 392
A monotonic increasing displacement is applied to the loaded end of the steel bar. To evaluate the 393
influence of the active confinement, a compressive pressure (Pconf) can be applied, through a surface
394
pressure, on both lateral faces (normal to the direction of the steel bar) before the loading in 395
displacement. The pressure is then kept constant during the imposed displacement. The lateral 396
pressures are chosen to be equal to 5, 10 or 20 MPa. 397
398
Young modulus Poisson ratio Yielding stress Hardening modulus
Es s se Eh
200 GPa 0.3 500 MPa 3245 MPa
Table 6. Steel parameters. 399
Young modulus Poisson ratio Tensile strength Compressive
strength Fracture energy
Ec c ft fc Gf
30.2 GPa 0.2 2.9 MPa 56.9 MPa 150 N/m
Table 7. Concrete parameters. 400
Bond stress (MPa) 2 10 13.2 21 2 2
Slip (mm) 0.002 0.1 0.25 0.765 1.5 1.8 Table 8. Parameters for the bond stress – slip law 0(𝛿𝑡).
401 402 403
18 Figure 20. Distribution of the initial tensile strength (in Pa) in the reinforced concrete tie.
404
405
Figure 21. Steel stress as a function of the mean concrete strain. Comparison between the experimental result and 406
the simulation at Pconf = 0 MPa.
407
Figure 22. Force – displacement curves for the reinforced concrete tie considering different applied confinement 408
pressures. 409
19 4.2. Results
410
Numerical results are compared in terms of global force – displacement curves and local evolutions 411
(mechanical degradation especially). The experimental comparison for Pconf = 0 MPa is first provided.
412
Figure 21 gives the evolution of the steel stress at the end of the bar as a function of the mean strain 413
in concrete, as considered in [49]. A good agreement is obtained, which validates the methodology 414
for the simulation. The expected differences between the simulation and the experimental curve 415
have already been discussed in [24]. 416
Figure 22 shows the evolution of the force as a function of the applied displacement for different 417
external pressures. In every case, the expected global evolution is obtained in three main steps: a 418
linear regime in which concrete and steel behave elastically, then a nonlinear regime where concrete 419
is gradually damaged (active cracking) and finally a stage where the number of cracks in concrete 420
does not evolve any more (stabilized cracks). Some unloading zones are also observed when new 421
localized damaged zones appear. The effect of the confinement pressure is especially observed on 422
these local unloading phases, which are less significant when the confinement pressure is high. 423
Moreover, the first loading stage of the force-displacement curve is found to be stiffer as the 424
confinement pressure increases, a phenomenon that was expected as the confinement pressure 425
tends to stiffen the bond stress – slip law (Eq. (8)). It is also to be noted that the force Fnl which
426
corresponds to the first unloading (at about 31 kN) is almost the same whatever the confining 427
pressure. It can be demonstrated ([1]), if the length of the tie is enough compared to the transfer 428
length (which is the case here, see Figure 26), that Fnl can be estimated through the following
429 equation: 430
𝐹
𝑛𝑙=
𝑓
𝑡. (𝐸
𝑠𝑆
𝑠+ 𝐸
𝑐𝑆
𝑐)
𝐸
𝑐 ( 16 )This equation is not dependent on the bond properties, as it is observed numerically. 431
The damage distributions in concrete at the last displacement increment are provided in Figure 23 432
(entire concrete tie and cross section at the position of the steel bar). As mentioned in [24], for a zero 433
applied confinement pressure, localized damages zones appear along the tie. The higher the 434
confinement pressure, the higher the number of localized damaged zones. For high values of the 435
confinement pressure (20 MPa), as the bond is stronger, damage is also observed along the steel bar, 436
almost continuously. The confining pressure also affects the value of the damage at the exit point of 437
the rebar with a decreasing value of the mechanical degradation with an increasing confinement. The 438
constitutive model for concrete may explain this effect, with an increasing resistance to local shear 439
with increasing compressive stresses. 440
Figure 24 illustrates the distribution of the stress along the steel bar at the end of the loading. Peaks 441
in the stress are related to the position of the cracks, which can also be located from the change in 442
the sign of the slip as illustrated in Figure 25 [35]. It enables to characterize, even using a damage 443
model, both the position and the opening of “equivalent cracks” using an additional post-processing 444
step on the relative displacement [35]. From these results, it is shown that the increase in the 445
confinement pressure is responsible for an increase in the number of cracks. For Pconf = 20 MPa, the
446
distribution of the stress along the rebar (between x = 0.6 and x = 0.8m) is disrupted by the 447
continuous damage localization. 448
20 summarized in Table 9. As expected from the steel stress distribution, the higher the confinement, 450
the higher the number of cracks. This is essentially due to the stiffening of the bond with the increase 451
in the confinement pressure, which decreases the transfer length and enables the apparition of 452
closer “cracks” (decrease in crack spacing). 453 454 Pconf = 0 MPa Pconf = 5 MPa Pconf = 10 MPa Pconf = 20 MPa
Figure 23. Damage distributions at the end of the loading for different applied confinement pressures. 455
21 Figure 24. Evolution of the stress along the steel bar for different confinement pressures – Last displacement 456
increment. 457
Figure 25. Evolution of the slip along the steel bar for different confinement pressures. Last displacement 458
increment. 459
Pconf = 0 MPa Pconf = 5 MPa Pconf = 10 MPa Pconf = 20 MPa
Number of cracks 5 5 6 ~6*
Average spacing (mm) 183 182 168 170
Minimum spacing (mm) 150 160 140 100
Maximum spacing(mm) 240 190 240 250
Table 9. Number of cracks and average crack spacing for different Pconf. *due to the damage localization along
460
the steel bar, the crack position is estimated from the local maximum in the steel stress distribution. 461
22 Figure 26. Evolution of the slip along the steel bar in the elastic phase for different confinement pressures. 462
Confinement pressure (MPa) 0 5 10 20
Transfer length (cm) 14.1 12.8 11.5 10.7
Table 10. Computed transfer length. 463
This effect is also underlined in Figure 26, which provides the evolution of the slip along the rebar 464
during the elastic regime. From this evolution, it is possible to evaluate the corresponding transfer 465
lengths, considering that the transfer length is the length to reach a 5µm slip from the end of the bar. 466
The computed values are summarized in Table 10, which confirms the decrease in the transfer length 467
with an increasing confinement pressure. 468
5. Conclusions 469
In this contribution, a numerical model to consider the effect of the stress state on the bond 470
behavior between steel and concrete was proposed. It is based on a zero thickness element, adapted 471
to large-scale simulations and the use of 1D elements for steel bars. It supposes the definition of a 472
bond stress – slip law that includes the confining pressure around the steel bar as a parameter. The 473
implementation of the model was presented and the calibration of the bond law was discussed. A 474
general equation was especially proposed. Based on experimental observations from the state-of-475
the-art, it includes a different behavior in confining tension or compression and two different phases 476
depending on the concrete cover to steel diameter ratio. 477
The evolution law was validated through the comparison to 28 experimental pullout tests. The model 478
was able to reproduce the evolution of the bond stress (especially the bond strength) as a function of 479
the applied confinement pressure, whatever the configuration. A methodology was proposed, 480
especially to take into account the non-zero lateral pressure, even in the case of a zero applied 481
confinement pressure (structural effect due to pullout configuration). Considering the full range of 482
simulated pullouts, the maximum mean error between the simulated and experimental bond 483
strength reaches 15 %, which is reasonable regarding the wide variability in the experimental results. 484
Finally, the consequences at the structural level were investigated on a reinforced concrete tie. The 485
response for different levels of confining pressures was studied. It shows the capability of the model 486
23 to reproduce the “expected” tendencies with especially an increase of the initial elastic stiffness with 487
increasing pressures and consequently a higher number of cracks in the stabilized nonlinear regime. 488
The “transfer length” was also shown to decrease with increasing confining pressures. 489
As a conclusion, the proposed model is able to simulate the mechanical behavior of reinforced 490
concrete at the structural scale, including the confinement effect. However, additional experimental 491
validations are necessary to further evaluate the correctness and the validity of the proposed slip 492
model. It would suppose the proposition of adapted experimental campaigns to focus on the 493
confinement effect. The applicability of the model to more full-scale applications (including for 494
example the applications studied in [50], [51]) could then be demonstrated. 495
Acknowledgments
496
The authors gratefully acknowledge the partial financial support from ENGIE for the development 497
and the analysis of the simulation results. 498
References
499
[1] Casanova A., Jason L., Davenne L., Bond slip model for the simulation of reinforced concrete 500
structures, Engineering Structures, 39, pp.66-78, 2012 501
[2] Eurocode 2. Design of concrete structures, EN 1992, 2007 502
[3] Jason L., Masson B., Comparison between continuous and localized methods to evaluate the 503
flow rate through containment concrete structures, Nuclear Engineering and Design, 277, pp. 146-504
153, 2014 505
[4] Lutz L.A., Gergely P., Mechanics of bond and slip of deformed bars in concrete, ACI Journal, 64, 506
pp.711-721, 1967 507
[5] Eligehausen R., Popov E., Bertero V.V., Local bond stress-slip relationships of deformed bars 508
under generalized excitations, University of California, Report n° UCB/EERC-83/23, 1983 509
[6] Zuo J., Darwin D., Bond slip of high relative rib area under cyclic loadings, ACI Structural Journal, 510
97, pp.331-335, 2000 511
[7] Bouazaoui L., Li A., Analysis of steel/concrete interfacial shear stress by means of pull out tests, 512
Material Research, 11, pp.453-457, 2008 513
[8] Daoud A., Lorrain M., Elgonnouni M., Résistance à l’arrachement d’armatures ancrées dans le 514
béton autoplaçant, Materials and Structures, 35, pp.395-401, 2002 515
[9] Tepfers R., Cracking of concrete cover along anchored deformed reinforcing bars, Magazine of 516
concrete research, 31, 106, pp.3-12, 1979 517
[10] Desnerck P., de Schutter G., Taerwe L., A local bond stress-slip model for reinforcing bars in self-518
compacted concrete, Proceedings of Framcos-7 conference, 2010 519
[11] Torre-Casanova A., Jason L., Davenne L., Pinelli X., Confinement effects on the steel-concrete 520
bond strength and pull-out failure, Engineering Fracture Mechanics, 97, pp. 92-104, 2013 521
[12] Yong Y. K., Nour M. G. and Nawy E. G. Behavior of Laterally Confined High‐Strength Concrete 522
under Axial Loads, Engineering Structures, 114, 2, pp. 332-351, 1988 523
24 in concrete subjected to lateral pressure, Journal of Materials in Civil Engineering, 24, 1, pp.125-133, 525
2012 526
[14] Zhang X., Wu Z., Wei Z., Zheng J., Dong W., Bouchair A., Ultimate bond strength of plain round 527
bars embedded in concrete subjected to uniform lateral tension, Construction and Building 528
Materials, 117, pp.163-170, 2016 529
[15] Malvar R.J., Bond of reinforcement under controlled confinement, ACI Materials, 89, 6, 530
pp.593-601, 1992 531
[16] Verderame G., Ricci P., DeCarlo G., Manfredi G., Cyclic bond behavior of plain bars. I: 532
Experimental investigation, Construction Building Materials, 23, 12, pp.3499-3511, 2009 533
[17] Jin L., Li D., Du X., Mechanical behavior and size effect of moderate high-strength RC columns 534
under monotonic and cyclic axial compression, Engineering Structures, 124, pp.269-285, 2016 535
[18] Gambarova P. G., Rosati G.P., Zasso B., Steel-to-concrete bond after concrete splitting: Test 536
Results, Materials and Structures, 22, pp.35-47, 1989 537
[19] Lowes L. N., Moehle J. P., Govindjee S., Concrete-steel bond model for use in finite element 538
modeling of reinforced concrete structures, ACI Structural Journal, pp. 501-511, 2004 539
[20] Xu F., Wu Z., Zheng J., Hu Y., Li Q., Bond behavior of plain round bars in concrete under lateral 540
pressures, ACI Structural Journal, 111, 2014 541
[21] Zhang X., Dong W., Zheng J., Wu Z., Hu Y., Li Q., Bond behavior of plain round bars embedded in 542
concrete subjected to lateral tension, Construction and Building Materials, 54, pp.17-26, 2014 543
[22] Wu Z., Zhang X., Zheng J., Hu Y., Bond Behavior of plain round bars embedded in concrete 544
subjected to biaxial lateral tensile-compressive stresses, Journal of Structural Engineering, 140, 4, 545
2014 546
[23] Lindorf A., Lemnitzer L. and Curbach M., Experimental investigations on bond behavior of 547
reinforced concrete under transverse tension and repeated loading, Engineering Structures, 31, 7, 548
pp.1469-1476, 2009 549
[24] Mang C., Jason L., Davenne L., A new bond slip model for reinforced concrete structures: 550
Validation by modelling a reinforced concrete tie, Engineering Computations, 32, 7, pp.1934-551
1958, 2015 552
[25] Jason L., Torre-Casanova A., Davenne L., Pinelli X., Cracking behavior of reinforced concrete 553
beams. Experiment and simulations on the numerical influence of the steel concrete bond, 554
International Journal of Fracture, 180, 2, pp.243-250, 2013 555
[26] Gupta A.K., Maestrini R., Tension-stiffness model for reinforced concrete bars, Journal of 556
Structural Engineering, 116, 3, pp.769-790, 1990 557
[27] Balazs G.L., Cracking analysis based on slip and bond stresses, ACI Materials Journal, pp.340-348, 558
1993 559
[28] Barros J.A.O., Taheri M., Salehian H., A model to simulate the moment-rotation and crack width 560
of FRC members reinforced with longitudinal bars, Engineering Structures, 100, pp.43-56, 2015 561
25 [29] Ngo D., Scordelis A.C., Finite Element Analysis of Reinforced Concrete Beams, ACI Journal, 64, 562
pp.152-163, 1967. 563
[30] Dominguez N., Brancherie D., Davenne L.,Ibrahimbegovic I., Prediction of crack pattern 564
distribution in reinforced concrete by coupling a strong discontinuity model of concrete cracking and 565
a bond-slip of reinforcement model, International Journal for Computer-Aided Engineering and 566
Software, 22, pp.558-582, 2005 567
[31] Richard R., Ragueneau F., C. Cremona, Adélaide L. , Tailhan J.L., A Three-dimensional 568
steel/concrete interface model including corrosion effects, Engineering Fracture mechanics, 77, 569
pp.951-973, 2010 570
[32] Monti G., Filippou F.C., Spacone E., Analysis of Hysteretic Behavior of Anchored Reinforcing Bars, 571
ACI Structural Journal, 94, pp.248-261, 1997 572
[33] Ibrahimbegovic A., Boulkertous A., Davenne L., Brancherie D., Modeling of reinforced-concrete 573
structures providing crack spacing based on XFEM, ED-FEM and novel operator split solution 574
procedure, International Journal for Numerical Methods in Engineering, 83, 4, pp.452-481, 2010 575
[34] Markou, G., Mourlas, C., Garcia, R., Pilakoutas, K. and Papadrakakis, M., Cyclic Nonlinear 576
Modeling of Severely Damaged and Retrofitted Reinforced Concrete Structures, COMPDYN 2019, 7th 577
International Conference on Computational Methods in Structural Dynamics and Earthquake 578
Engineering, 24-26 June 2019, Crete, Greece 579
[35] Mang C., Jason L., Davenne L., Crack opening estimate in reinforced concrete walls using a 580
steel-concrete bond model, Archives of civil and mechanical engineering, 16, pp.422-436, 2016 581
[36] Lykidis G., Static and dynamic analysis of reinforced concrete structures with 3D finite elements 582
and the smeared crack approach, PhD thesis, NTUA, Greece, 2007 583
[37] Markou, G., Genco, F., Seismic Assessment of Small Modular Reactors: NuScale Case Study for 584
the 8.8 Mw Earthquake in Chile, Nuclear Engineering and Design, 342, pp.176-204, 2019 585
[38] Markou, G., Papadrakakis, M., An Efficient Generations Method of Embedded Reinforcement in 586
Hexahedral Elements for Reinforced Concrete Simulations, Advances in Engineering Software, 45, 1, 587
pp.175-187, 2012 588
[39] Robins P. J., Standish I. G., The effect of lateral pressure on the bond of round reinforcing 589
bars in concrete, Internal Journal of Adhesion and Adhesives, 2, 2, pp.129-133, 1982. 590
[40] Orangun C. O., Jirsa J. O., Breen J. E., The Strength of Anchored Bars: Re-evaluation of test 591
data on development length and splices, ACI Structural Journal, 74, 3, pp.114-122, 1977 592
[41] Shang H., Cui F., Zhang P., Zhao T., Ren G.,Bond behavior of steel bar embedded in recycled 593
coarse aggregate concrete under lateral compression load, Construction and Building Materials, 594
150, pp. 529-537, 2017 595
[42] ACI 318-14, Building Code Requirements for Structural Concrete (ACI 318-14), American 596
Concrete Institute, 2014 597
[43] RILEM. Essai portant sur l’adhérence des armatures de béton – Essai par traction, Matériaux et 598
Constructions, Vol 3, N°15, p. 175-178, 1970. 599
[44] Untrauer R.E., Henry R.L., Influence of Normal Pressure on Bond Strength, ACI Journal, pp.577-600
585, 1965 601
26 PhD thesis, University of California, Berkeley
603
[46] Cast3M, http://www-cast3m.cea.fr, 2019 604
[47] Costa C., Pegon P., Arêde A., Castro J.. Implementation of the damage model in tension and 605
compression with plasticity in Cast3M ; JRC Report ; 2004. 606
[48] Hillerborg A., Modeer M., Peterson P.E., Analysis of Crack Formation and Crack Growth in 607
Concrete by means of Fracture Mechanics and Finite Elements. Cement and concrete Research, 6, 608
pp.773-782, 1976 609
[49] Farra, B., Influence de la résistance du béton et de son adhérence avec l’armature sur la 610
fissuration, PhD Thesis, Ecole Polytechnique Fédérale de Lausanne, 1995 611
[50] Engen, M., Hendriks, M. A. N., Øverli, J. A., Åldstedt, E., Non-linear finite element analyses 612
applicable for the design of large reinforced concrete structures, European Journal of Environmental 613
and Civil Engineering, pp.1-23, 2017 614
[51] Markou, G., Computational performance of an embedded reinforcement mesh generation 615
method for large-scale RC simulations, International Journal of Computational Methods, 12, 3, 2015 616
![Figure 1. Principle of the distribution of steel and concrete stresses in a reinforced concrete tie after the first 42 crack ( c and s stand for the stresses in concrete and steel respectively) [1]](https://thumb-eu.123doks.com/thumbv2/123doknet/12864171.368777/3.892.243.655.100.280/principle-distribution-concrete-stresses-reinforced-concrete-stresses-respectively.webp)
![Figure 3. Principle of the interface element between steel and concrete [24].](https://thumb-eu.123doks.com/thumbv2/123doknet/12864171.368777/5.892.111.794.103.280/figure-principle-interface-element-steel-concrete.webp)
![Figure 13. Simulation of a pullout test from [36] - d s = 14 mm. p lat distribution along the steel bar for P conf = 0 320](https://thumb-eu.123doks.com/thumbv2/123doknet/12864171.368777/13.892.228.668.798.1080/figure-simulation-pullout-test-lat-distribution-steel-conf.webp)
![Figure 14. Simulation of a pullout test from [41] - d s = 14 mm. Input calibrated bond law and simulated bond 323](https://thumb-eu.123doks.com/thumbv2/123doknet/12864171.368777/14.892.231.660.108.398/figure-simulation-pullout-test-input-calibrated-bond-simulated.webp)