HAL Id: hal-02419649
https://hal.archives-ouvertes.fr/hal-02419649
Submitted on 19 Dec 2019
HAL is a multi-disciplinary open access archive for the deposit and dissemination of sci-entific research documents, whether they are pub-lished or not. The documents may come from teaching and research institutions in France or abroad, or from public or private research centers.
L’archive ouverte pluridisciplinaire HAL, est destinée au dépôt et à la diffusion de documents scientifiques de niveau recherche, publiés ou non, émanant des établissements d’enseignement et de recherche français ou étrangers, des laboratoires publics ou privés.
achieve a homogeneous microstructure in a 14cr ODS
steel
B. Hary, M. van der Meer, R. Loge, T. Baudin, Y. de Carlan
To cite this version:
B. Hary, M. van der Meer, R. Loge, T. Baudin, Y. de Carlan. Optimization of the thermomechanical treatment to achieve a homogeneous microstructure in a 14cr ODS steel. International Conference on Fast Reactors and Related Fuel Cycles Next Generation Nuclear Systems for Sustainable Development (FR17), Jun 2017, Iekaterinbourg, Russia. �hal-02419649�
Optimization of the Thermomechanical Treatment to Achieve a Homogeneous
Microstructure in a 14Cr ODS Steel
B. Hary1, M. Van Der Meer2, R. Logé2, T. Baudin3, Y. de Carlan1
1. DEN-Service de Recherches Métallurgiques Appliquées, CEA, Université Paris-Saclay, F-91191, Gif-sur-Yvette, France
2. LMTM, Ecole Polytechnique Fédérale de Lausanne, 2002 Neuchâtel, Switzerland 3. ICMMO, Université Paris-Sud, UMR CNRS 8182, 91405 Orsay Cedex, France
E-mail contact of main author: benjamin.hary@cea.fr
Abstract
Oxide dispersion strengthened (ODS) ferritic steels are promising candidates for high burn up fuel pins of Sodium Fast Reactors and structural materials in fusion reactors. They are elaborated by powder metallurgy and their manufacturing route is complex and specific, including hot forming and cold working. Different heat treatments are necessary to recrystallize these materials and to relieve internal stresses. The presence of highly stable nano-oxydes and the limited stored energy after elaboration can make the recrystallization temperature extremely high (> 0.9 Tmelting). In this paper, a model alloy was studied before and after specific deformation by cold working. It appears that after being hot-extruded, the material cannot be recrystallized due to the very high stability of the nano-particles. Otherwise, cold deformation after extrusion is necessary to trigger recrystallization. In that case, the microstructure obtained after annealing is weakly textured and the size of the nano-particles is not affected.
Key words: ODS, recrystallization, cold-deformation, nano-particles
Introduction
During the last decades, investigations carried out on Oxide Dispersion Strength (ODS) steels have shown that they are appropriate candidates for the cladding of Sodium Fast Reactor (SFR) and for structural materials of fusion reactors due to their high resistance to irradiation swelling and their very good mechanical properties at high temperature [1,2]. The manufacturing process of these materials, including powder metallurgy and HPTR cold-rolling, still need to be improved to avoid cracks and unfavorable microstructures [3]. Recrystallization appears as an alternative to get through this issue as it creates a new microstructure. However the fine dispersion of nano-particles strongly pin the grain boundaries, prevent dislocations from moving and limit the recrystallization. A way to favor it within the material is to increase the stored energy applying cold deformation. Some authors have already investigated the effect of various paths of cold deformation on the microstructures of ODS ferritic steels after annealing [4][5], but the recrystallization mechanisms involved need to be understood. In this study, a 14%Cr-ODS ferritic steel was elaborated and its recrystallization behavior investigated after different thermomechanical heat treatments.
Materials and methods:
Material manufacturing
The material was elaborated by powder metallurgy using the specific process of mechanical alloying [6] and is referred as R0.3 in the following.
Wt % Cr W Ti Y Ni C O N Mn Al R0.3 14.13 0.88 0.31 0.20 0.20 0.030 0.105 0.049 0.29 0.013
TABLE I: CHEMICAL COMPOSITION OF THE ODS FERRITIC GRADE R0.3
The base powder with a nominal composition of Fe-14Cr-1W commonly used in the manufacturing of ODS steels was atomized at Aubert & Duval. This powder was milled with a powder of titanium hydride (TiH2) and yttria (Y2O3) at CEA (LTMEx) in an attritor under argon
atmosphere for 10h at a speed of 400 rotations per minutes. The ball-to-powder ratio is about to 15. Nano-precipitates were incorporated in the base powder during milling targeting a mass percentage of 0.3Ti-0.3Y2O3. The ODS steel powder is put into a soft steel can and
pre-compacted during 1h at 1100°C. Then, the material is consolidated by hot extrusion at 1100°C with a surface reduction ratio of 13 (diameter is reduced from 75 mm to 21 mm) and air cooled. The chemical composition was obtained by chemical analysis, mainly using Plasma Emission Spectroscopy (PES) and Optical Emission Spectroscopy (OES) and is presented in Table I.
Small angle neutron scattering (SANS)
Characterization of the size distribution of the nano-particles in the material was performed using SANS in the spectrometer PAXY at Laboratoire Léon Brillouin (LLB, CEA, CNRS). SANS is a very suitable technique to study nano-precipitates in ODS steels. The main principles and the experimental parameters have been discussed in details in the framework of works performed by Mathon et al. [7]. A magnetic field of 1,4T was applied to generate a scattering anisotropy and separate the contribution of the matrix from the precipitates. This technique allows to obtain information about the chemical nature of the particles calculating the A ratio [7].
Calorimetry
In order to identify recrystallization peaks and measure the recrystallization temperature of the material, Differential Scanning Calorimetry (DSC) was used. Two cycles from room temperature to 1400°C with a heating rate of 10°C/min were performed under Argon, the second cycle allowing to distinguish reversible phenomena from the non-reversible ones. During cooling, the furnace is shut down and the cooling rate is about 10°C/min from 800°C to room temperature. For each experiment, about 1.5 grams of material is put into an alumni crucible.
Cold deformation
Cold deformation was performed on cylindrical samples of 12 mm height and 8 mm diameter machined in the as-extruded bars, the height being parallel to the extrusion direction. Uniaxial compression test were performed using a Gleeble 3800 device from Dynamics System Inc.. Samples were put between two carbide tungsten jaws and compressed in the longitudinal direction (parallel to extrusion direction) at a rate of 0.01 s-1 until the final dimension was reached.
Electron Back Scatter Diffraction (EBSD) Analyses
EBSD analyses on consolidated samples were conducted using a Quantax system from Brucker Company mounted on a SEM-FEG Zeiss Sigma HD operating at 20 keV at working distance of 15 mm. The step size was 0.05 µm on the as-extruded and cold deformed states and 0.25 µm on thr recrystallized states. Results were treated with the OIM Analysis software from EDAX company. Sample preparation includes automatic mechanical polishing with 500 and 1200 SiC
papers followed by diamond polishing up to 1 µm. Final preparation includes either vibratory polishing during 6 hours using a colloidal silica solution or electropolishing with a solution containing 70% ethanol and 10% perchloric acid (721) during 30 seconds. For the data treatment, the grain tolerance angle is set to 10°.
Driving and pinning forces for recrystallization
Recrystallization phenomena are deeply linked to the driving and pinning forces in the material that promote or prevent the motion of grain boundaries and dislocations. Usually, the boundary velocity is defined as v = MP, where M is the boundary mobility which depends on its crystallographic nature and on temperature and P is the global pressure or driving force. P can be defined as:
𝑃 = 𝐸𝑠+ 𝑃𝐶+ 𝑃𝑧 (1)
Where Es is the stored energy driving force, Pc the capillary pressure involved in grain growth
mechanisms and Pz the pinning force due to particles.
The driving force Es related to stored energies within the material can be estimated using [8]:
𝐸𝑠 = 𝛼𝐺𝑏2𝜌
𝐺𝑁𝐷 (2)
Where G is the shear modulus, b the burger vector, α a constant equal to 0.5 and ρGND the Geometrically Necessary Dislocation (GND) density which is calculated according [9]:
𝜌𝐺𝑁𝐷 =
𝛼 𝑏
𝑑𝜃𝐾𝐴𝑀
𝑑𝑥 (3)
With α a constant equal to 2, θKAM the mean value of the Kernel Average Misorientation (KAM)
calculated with the EBSD software, n the number of neighbors considered in the calculation of the KAM, a the step size and b the burgers vector (0,248 nm). This method of calculation has the advantage to remove the noise and to be independent to the step size.
According to the Smith and Zener theory, the pinning pressure is defined as: 𝑃𝑧 =
3𝛾𝐹𝑣
2𝑟 (4)
Where γ is the interfacial energy of the grain boundary, Fv the particles volume fraction and r the
average radius of particles.
The capillary pressure is commonly defined as Pc = 2γ/ρ with ρ the grain boundary curvature and
ρ = R, the mean radius of the grains, assuming spherical grains. In a more realistic approach,
considering a 2D cross section in annealed metals, Feltham [10] and others authors [11] use the assumption that ρ is about 6R.
Results and Discussion
1. As-Extruded materials
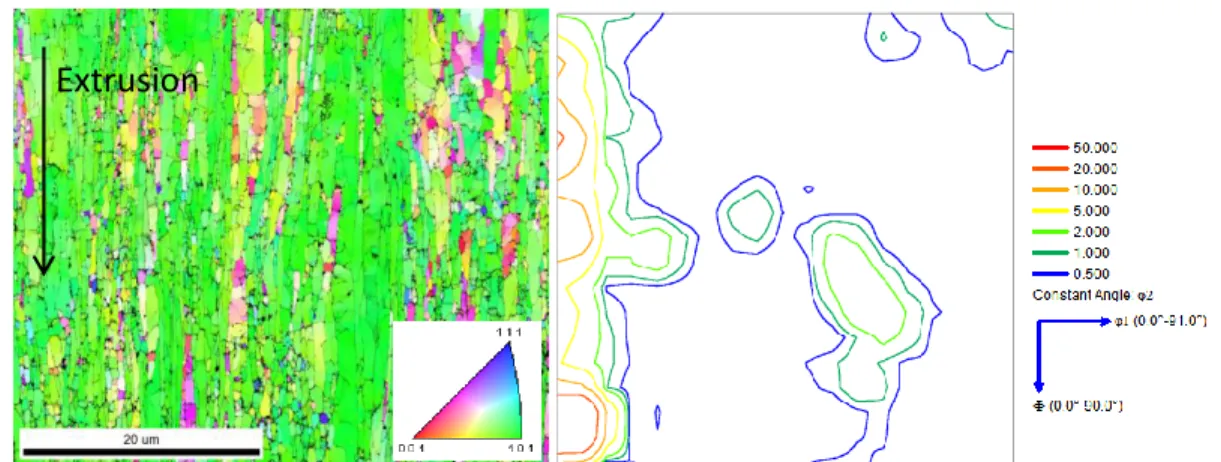
The microstructure in the as-extruded state was analyzed by EBSD. The IPF maps showing <uvw> directions parallel to the extrusion direction (ED) is shown in FIG. 1 with the corresponding orientation distribution function (ODF) cross section at φ2 = 45°. Microstructural
features are presented in Table II. Grains are elongated in the extrusion direction and the texture is the well-known α fiber already observed in the literature [3]. The microstructure show fine and large grains as well as numerous substructures those are mainly located in the large grains. Moreover, it seems that the large grains are preferentially oriented along the α fiber whereas the small grains exhibit more random orientations. Since it is quite difficult to define a grain in these as-extruded microstructures and because they are not equiaxed, discussion will be focused on the subgrains in the following. The dislocation density, calculated with the method presented in Eq. (3), reaches 6.71014 m-2. Then, the grade was annealed at 1300°C during 1h under helium atmosphere and helium quenched. IPF maps are presented in FIG. 2. Almost no modification of the microstructure is noted, with almost the same subgrain size and stored energy. This implies that the thermal energy brought at this temperature is not high enough to allow dislocations and grain boundaries to move within the material.
FIG. 1: IPF maps showing crystal direction parallel to extrusion direction and corresponding ODF section plot at φ2 = 45° for the as-extruded material
FIG. 2: IPF maps showing crystal direction parallel to extrusion direction and corresponding ODF section plot at φ2 = 45° after annealing 1h at 1300°C
Grade % fiber α (∓10°) Subgrain size // ED (µm) Subgrain size ┴ ED (µm) ρGND (m-2) Stored Energy (MPa) R0.3 67 0.82 0.38 6.71014 1.61 R0.3 1h 1300 °C 62 0.81 0.44 6.31014 1.51
TABLE II: MICROSTRUCTURAL FEATURES OF THE R0.3 GRADES AS-EXTRUDED AND AFTER ANNEALING 1H AT 1300°C
Extrusion
Texture :
Harmonic L =34, HW = 5,0 Calc. Method : Harm. Series Exp. Series Rank (l) : 34 Gaussian smoothing : 5.0 Sample Symmetry : Triclinic Representation : Euler angles (Bunge)
FIG. 3: (a) Nano-particles size distributions and (b) A ratio as extruded and after 1h at 1300°C
Grade r1 (nm) f1 (%) r2 (nm) Fv,tot (%) Density (cm-3) A ratio Pz (MPa)
R0.3 1.4 ± 0.4 90 4.6 ± 1.5 1.87 1.181018 2.61 ± 0.23 14.72
R0.3 1h 1300°C 1.8 ± 0.4 80 4.8 ± 1.7 1.7 3.871017 2.66 ± 0.39 9.29 TABLE III: NANO-PARTICLES FEATURES FOR THE R0.3 GRADES AS –EXTRUDED AND AFTER
ANNEALING 1H AT 1300°
Analyses of precipitation by SANS are presented on FIG. 3 and main values are reported in Table III. Two populations of particles are detected: The smaller ones at 1.4 nm corresponding to scattering vector values higher than 1 nm-1 and the larger ones centered on 4.6 nm with value of 𝑞⃗ close to 5 nm-1. Most of the particles (90%) belong the distribution centered on r =1.4 nm. After annealing, radii of precipitates slightly increase in the two populations and the total number density decreases indicating a slight coarsening. Concerning the A ratio, the values are quite constant in a range of scattering vector 𝑞⃗ from 0 to 1 nm-1
. The important deviation above 1 nm-1 is due to the contribution of noise that becomes almost equal to the scattered intensity for high values of 𝑞⃗. The average value can be compared to those reported in the literature [7]: the A ratio value of 2.61 is very close from the value of Y2Ti2O7 particles, equal to 2.52. This nature of
particles was already found in previous work on nanoparticles in ODS [12]. After annealing, the average A ratio remains close from 2.6. This can be interpreted as precipitates being stable and their chemical nature not affected by the annealing treatment.
Due to their high stacking fault energy, microstructures of ODS ferritic steels are easily subject to recovery, particularly inside the dislocation cells during hot deformation process. This leads to the formation of well-defined subgrains with a limited dislocation density and stored energy driving force. The pinning force is comparatively very important after extrusion because the nano-particles are already formed and are effective to pin the grain boundaries. They remain very fine after annealing and even if the recovery process is limited (GND density values in Table II are similar before and after annealing), the stored energy is still not high enough to enable recrystallization at 1300°C. The extreme stability of the Y2Ti2O7 particles at high temperature is
not new and may be explained by their low interface energy and a cube-on-cube full coherency relationship with the ferritic matrix [12].
1 1.5 2 2.5 3 3.5 4 0 0.2 0.4 0.6 0.8 1 1.2 1.4 R0.3 as-extruded R0.3 annealed 1h 1300°C A R at io q (nm-1) 1E+11 1E+12 1E+13 1E+14 1E+15 1E+16 1E+17 1E+18 0 2 4 6 8 10 12 14 16 R0.3 as-extruded R0.3 1h 1300°C De nsity (c m -3) r (nm) Fv= 1.87% Fv= 1.7% a) b)
2. Deformed materials
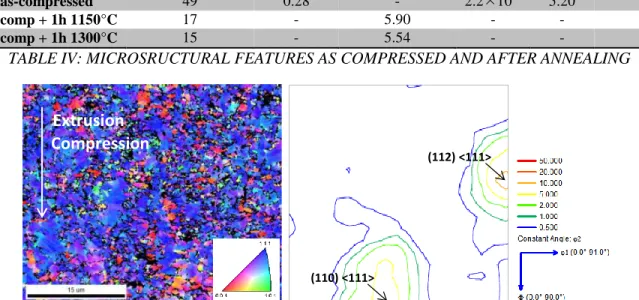
The material was compressed to a true deformation level of 0.7. The EBSD map and the corresponding ODF are presented on FIG. 4. The texture has completely changed as a fiber <111> texture is now visible. According to the ODF, the more intense components are {112}<111> and {110}<111>. As reported in Table IV, the subgrain size is lower (< 400 nm) than in the extruded materials (> 800 nm along the extrusion direction in Table II). Moreover, the dislocation density is much more important. It reaches 2.21015 m-2 (6.71014 m-2 before compression) increasing the stored energy driving force to 5.2 MPa. Non-indexed areas are visible and are mainly located at the grain boundaries where the distortion of the lattice is maximal and where the kikuchi patterns can no longer be identified.
In the literature, Karch [13] proposed a modelling of the strain distribution after hot uniaxial compression in an ODS steel by Finite Element modelling. The author reported strain localization at the center of the specimen in a plan perpendicular to the compression direction. The strain level in this area (εcen > 1.6) can reach about two times the macroscopic strain applied (εmac =
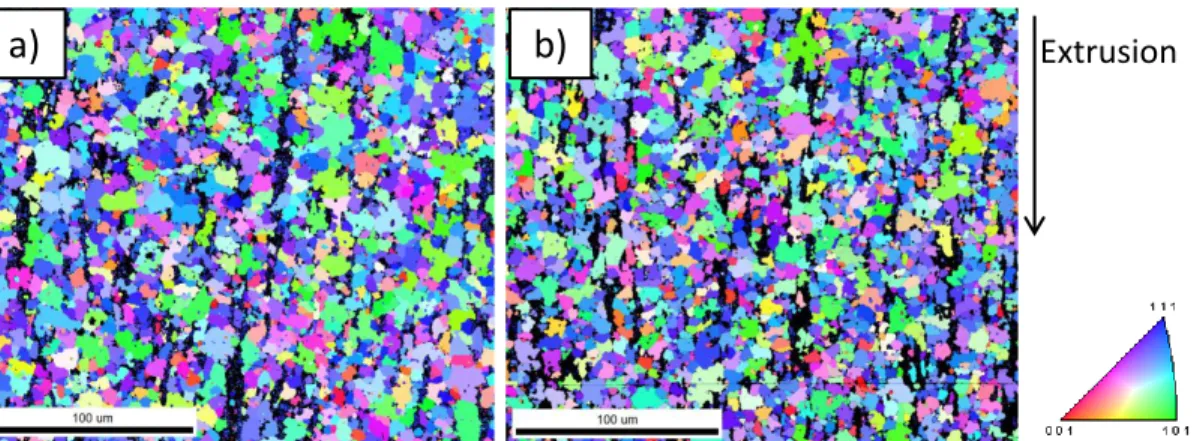
0.87). Consequently, EBSD scans were performed as close as possible from the center of the samples in order to reduce as much as possible the effect of the deformation heterogeneities. Microstructures of the deformed material after annealing at 1h 1150°C and 1h 1300°C are visible in FIG. 5 and the corresponding ODFs section plot at φ2=45° are shown in FIG. 6. The
microstructural features are presented in Table IV. For annealed and recrystallized samples, the dislocation density was not measured since it is necessary very low. It appears that grade R0.3 exhibits an advanced recrystallized state (72%) from 1h at 1150°C. The average grain size is 5.90 µm and the grain boundaries are particularly crooked. Subgrain boundaries are no more present in the recrystallized area where there are only high angle boundaries (>10°). The fiber <111> is much less intense (see FIG. 6 (a)) and the texture is close from random. Surprisingly, the same
Grade Fraction of <111> fiber (%) Subgrain size (µm) Recrystallized grain size (µm) ρGND (m-2) Stored Energy (MPa) Recrystallized fraction (%) R0.3 as-compressed 49 0.28 - 2.21015 5.20 0 R0.3 comp + 1h 1150°C 17 - 5.90 - - 72 R0.3 comp + 1h 1300°C 15 - 5.54 - - 73
TABLE IV: MICROSRUCTURAL FEATURES AS COMPRESSED AND AFTER ANNEALING
FIG. 4: IPF maps showing crystal direction parallel to compression direction and corresponding ODF section plot at φ2 = 45° after uniaxial compression
(110) <111>
(112) <111>
Compression Extrusion
microstructure is obtained after 1h at 1300°C with an almost identical grain size, recrystallized fraction and texture (see Table IV).
In the study, DSC was used mainly with the purpose of detecting the occurrence of recrystallization as well as the onset temperature of this phenomenon. The material was analyzed at the extruded state and after compression (ε = 0.7). Results are presented in FIG. 7. In the as-extruded state, no particular thermal phenomena is noticed, in agreement with the extremely stable microstructure whereas after being deformed, one can note an exothermic peak centered at 1080°C corresponding to the footprint of recrystallization. The onset temperature is 1030°C and the enthalpy is equal to 1 J.g-1 considering a linear base line.
Nano-precipitates after deformation and annealing were also characterized by SANS. The number distributions are presented in FIG. 8 and the values in Table V. One can note that particles have comparable size as in the as-extruded state (see Table III) and the same relative fraction of very small particles (2-3 nm). However, the total volume fraction and the density are slightly lower than in the as-extruded state.
FIG. 5: IPF maps showing crystal direction parallel to compression direction after annealing: (a) 1h at 1150°C and (b) 1h at 1300°C
FIG. 6: ODFs section plot at φ2=45° after compression and annealing 1h at (a) 1150°C and (b) 1300°C
Grade r1 (nm) f1 (%) r2 (nm) Fv (%) Density (cm-3) Pz (MPa)
R0.3 comp + 1h 1150°C 1.4 ± 0.5 90 4.4 ± 1.4 1.54 8.731017 12.40
R0.3 comp + 1h 1300°C 2.0 ± 0.7 90 4.6 ± 1.5 1.39 2.751017 7.82 TABLE V: NANO-PARTICLES FEATURES AFTER COMPRESSION AND ANNEALING
a)
b)
ExtrusionFIG. 7: Heating part of DSC curves for the as-extruded and deformed grades
FIG. 8: Nano-particles size distributions after compression and annealing
Recrystallization of ODS ferritic grade after cold uniaxial compression on hot extruded states was already characterized in the literature after annealing at reasonable temperature (T < 1150°C) [4][14]. The authors also observed a high recrystallized fraction and equiaxed grains. In this study, the strong attenuation of the <111> fiber suggests that either nuclei preferentially form in more randomly oriented areas in the deformed matrix or that the growth of nuclei is promoted when they are oriented differently from the <111> fiber. To answer this question, the stored energy driving force was measured in the deformed sample within different texture components observed after recrystallization. None of them showed significantly different values from the <111> fiber.
Another method was considered for computing the stored energy driving force, based on the consideration that it is inversely proportional to the subgrain size. This approach was first proposed by Dillamore et al. [15] and set that the subgrain boundaries are GNDs walls. It gives the expression Es = αγ/R where α is a constant equal to 0.5 and R the subgrain radius. Thus, this
driving force can also be considered as a capillary driving force. This suggests that the smaller the subgrain, the higher the driving force. Thus, the smaller subgrains (D < Dmean = 0.25 µm)
were isolated (see FIG. 9 (a)) in grade R0.3 as-compressed and texture and stored energy were calculated. The mean value of stored energy in these grains is about 5.33 MPa whereas it is only
-80 -60 -40 -20 0 20 40 700 900 1100 1300 R0.3 as-extruded R0.3 compressed 0.7 T ( C) HeatFl ow (m W ) Recrystallization 1E+11 1E+12 1E+13 1E+14 1E+15 1E+16 1E+17 1E+18 0 2 4 6 8 10 12 14 16 R0.3 Comp + 1h 1150°C R0.3 Comp + 1h 1300°C r (nm) Densi ty (cm -3 ) Fv= 1,54% Fv= 1,39%
FIG. 9: (a) IPF map showing crystal direction parallel to compression direction for subgrains smaller than 0.25 µm and (b) corresponding ODF section plot at φ2 = 45°
4.40 MPa in subgrains larger than 0.25 µm. Moreover, these very fine subgrains are more randomly oriented than the rest of the microstructure according the ODF in FIG. 9 (b), and this is in agreement with the weak texture obtained after recrystallization.
Consequently, one can assume recrystallized grains nucleating and growing preferentially from the smaller subgrains where the stored energy is more important. The same microstructure obtained after annealing 1h at 1300°C suggests that the primary recrystallization is already complete at 1150°C and this is confirmed by the peak observed in DSC where Toffset is located at
1130°C. After primary recrystallization, grain boundaries are pinned by the nanoparticles, still present in the matrix with almost the same size and proportion than in the as-extruded state and no grain growth can occur. Furthermore, despite the increase of the GND density after compression, the Zener pressure is always more important than the average driving force. This suggests that nuclei can only appear in areas where the stored energy gradient is the highest and also maybe in areas where the particles density is lower than the average value. Once the recrystallized nucleus is large enough, capillary pressure favors the growth of the grain. As soon as two recrystallized grains impinge each other, the grain boundary stops moving since the stored energy gradient becomes zero and the capillary pressure is low (less than 0.5 MPa for grains larger than 5 µm) compared to the Zener pressure. In agreement with this analysis, non-recrystallized areas probably exhibit either a lower dislocation density or a higher density of particles, compared to the average values.
Conclusion
In ferritic ODS steel, recrystallization mechanisms and associated microstructures are deeply linked to the nano-particles distribution and the stored energy introduced in the material. The investigations presented in this paper have enabled to reach the following conclusions:
After extrusion, the stored energy is limited in the material and the very fine population of stable Y2Ti2O7 particles prevent recrystallization and grain growth
Cold uniaxial compression highly increases the stored energy and enables to achieve advanced recrystallized stages. The recrystallization texture is much more random than the deformation texture, which shows mainly {110}<111> and {112}<111> orientations. The nano-particles size distribution is barely affected by recrystallization.
b)
a)
Compression Extrusion
During annealing after deformation, recrystallization nuclei seem to preferentially appear near the smallest subgrains, where the stored energy is higher and the texture more random. The recrystallized grains stop growing after primary recrystallization.
References
[1] P. Yvon and F. Carré, “Structural materials challenges for advanced reactor systems,” J.
Nucl. Mater., vol. 385, no. 2, pp. 217–222, 2009.
[2] P. Dubuisson, Y. De Carlan, V. Garat, and M. Blat, “ODS Ferritic/martensitic alloys for Sodium Fast Reactor fuel pin cladding,” J. Nucl. Mater., vol. 428, no. 1–3, pp. 6–12, 2012. [3] M. Serrano, M. Hernández-Mayoral, and A. García-Junceda, “Microstructural anisotropy
effect on the mechanical properties of a 14Cr ODS steel,” J. Nucl. Mater., vol. 428, no. 1– 3, pp. 103–109, 2012.
[4] M. Dade, J. Malaplate, J. Garnier, F. De Geuser, N. Lochet, and A. Deschamps, “Influence of consolidation methods on the recrystallization kinetics of a Fe-14Cr based ODS steel,”
J. Nucl. Mater., vol. 472, pp. 143–152, 2016.
[5] C. Capdevila Montes and H. K. D. H. Bhadeshia, “Influence of Deformation on
Recrystallization of an Yttrium Oxide Dispersion-Strengthened Iron Alloy (PM2000),”
Adv. Eng. Mater., vol. 5, no. 4, pp. 232–237, Apr. 2003.
[6] J. S. Benjamin, “Dispersion strengthened superalloys by mechanical alloying,” Metall.
Trans., vol. 1, no. October, pp. 2943–2951, 1970.
[7] M. H. Mathon, M. Perrut, S. Y. Zhong, and Y. de Carlan, “Small angle neutron scattering study of martensitic/ferritic ODS alloys,” J. Nucl. Mater., vol. 428, no. 1–3, pp. 147–153, 2012.
[8] F. J. Humphreys and M. Hatherly, Recrystallisation and Related Annealing Phenomena,
Second Edition. 2004.
[9] C. Moussa, M. Bernacki, R. Besnard, and N. Bozzolo, “About quantitative EBSD analysis of deformation and recovery substructures in pure Tantalum,” IOP Conf. Ser. Mater. Sci.
Eng., vol. 89, p. 12038, 2015.
[10] P. Feltham, “Grain growth in metals,” Acta Metall., vol. 5, no. February, pp. 97–105, 1957.
[11] P. Hellman and M. Hillert, “.,” Scand. J. Met., vol. 4, p. 211, 1975.
[12] J. Ribis, M. Lescoat, S. Y. Zhong, M. Mathon, and Y. De Carlan, “Influence of the low interfacial density energy on the coarsening resistivity of the nano-oxide particles in Ti-added ODS material,” vol. 442, pp. 101–105, 2013.
[13] A. Karch, PhD Thesis “Investigation of microstructural modification during hot forming in ferritic ODS steels,” 2015.
[14] T. Grosdidier, E. Suzon, and F. Wagner, “Primary recrystallization in an ODS FeAl alloy: An effective way to modify texture and microstructure,” Intermetallics, vol. 12, pp. 645– 654, 2004.