Denitrification in a Best Management Practice Bioretention System
byRiana Larissa Kernan
B.S. Civil and Environmental Engineering University of California, Berkeley, 2011
B.A. Environmental Studies University of California, Santa Cruz, 2011
Submitted to the Department of Civil and Environmental Engineering Partial Fulfillment of the Requirements for the Degree of
Master of Engineering in Civil and Environmental Engineering at the
Massachusetts Institute of Technology June 2014
© 2014 Riana Kernan. All Rights Reserved.
m
MASSACHUSETTS !NSTITUTE
OF TECHNOLOGY
F
JUN
13
2014
LIBRARIES
The author hereby grants to MIT permission to reproduce and distribute publicly paper andelectronic copies of this thesis document in whole or in part in any medium now known or hereafter created. Signature of Author: Certified by: Certified by: Accepted by:
Signature redacted
Department of Civil and Environmental Engineering May 9, 2014
Signature redacted_____
Peter Shanahan Senior Lecturer of Civil and Environmental Engineering Thesis Supervisor
Signature redacted__
Janelle Thompson Assistant Pr fessor of Civil and Environmental Engineering
/I
The s Supervisor___________Signature redacted__
I eidi M. Nepf Chair, Departmental Committee for Graduate Students
Denitrification in a Best Management Practice Bioretention System
by
Riana Larissa Kernan
Submitted to the Department of Civil and Environmental Engineering on May 9, 2014 in partial fulfillment of the requirements for the Degree of Master of Engineering in Civil and
Environmental Engineering
ABSTRACT
This study investigates the occurrence of denitrifying soil bacteria in a bioretention system located in Singapore and containing a saturated anoxic zone intended to facilitate
denitrification. Soil samples were collected from six depths within the rain garden, four of which were within the saturated anoxic zone. These samples were analyzed using endpoint PCR, targeting total bacterial 16S rRNA or a denitrification gene (nosZ) in order to determine presence or absence of denitrifying bacteria. Three dilutions were used to produce semi-quantitative results for the abundance of denitrifying bacteria in a sample relative to samples from other depths. The highest numbers of nosZ amplicons per gram of soil were observed in the deeper levels of the saturated anoxic zone as well as within the root zone of the rain garden. Subsurface water samples from the saturated anoxic zone were also analyzed for oxidation-reduction potential, dissolved oxygen, and nitrogen and phosphorus species. Concentrations of nitrate and nitrite were below the detection limit for most samples, indicating consumption by denitrifying bacteria and high rates of removal for long detention times. Ammonia and phosphorus concentrations are of potential concern because they appear to increase within the saturated anoxic zone.
Thesis Supervisor: Peter Shanahan
Title: Senior Lecturer of Civil and Environmental Engineering Thesis Supervisor: Janelle Thompson
ACKNOWLEDGEMENTS
I would like to thank my advisors, Dr. Peter Shanahan and Prof. Janelle Thompson, for their invaluable advice, guidance, and expertise; Adam for his indispensable help in the lab; Justin, Allison, and Tina for assistance in the field and lab, and for a pleasant time in Singapore; Jia and Alwi for guidance and assistance in the field; Prof. Karina Gin for the opportunity to work in her lab at the National University of Singapore; Ginger, Shin Giek, and Shu Harn for sharing lab supplies and advice; my family and housemates for their support and encouragement; and everyone in the MEng program for camaraderie and an enjoyable year.
TABLE OF CONTENTS
A b stra ct ... 3
Acknow ledgem ents ... 5
Table of Contents ... 6
List of Figures... 7
List of Tables... 7
1. Introduction... 8
1.1 Storm w ater M anagem ent in Singapore ... 8
1.2 ABC W aters Program m e ... 9
1.3 Balam Estate Rain Garden ... 10
2. Literature Review ... 12
2.1 Nitrogen Cycling and Rem oval in Balam Estate Rain Garden... 12
2.2 Polymerase Chain Reaction Methods to Assess Abundance of Denitrifying Bacteria.... 14
3. Field procedures... 16
3.1 Subsurface W ater Sam ple Collection ... 16
3.2 Soil Sam ple Collection ... 17
4. Laboratory M ethods... 19
4.1 Soil Sam ple Procedure... 19
4.2 Polym erase Chain Reaction (PCR) ... 19
4.3 Aga rose Gel Electrophoresis... 21
4.4 Estim ating Relative Abundance from Dilution PCR ... 22
5. Results and Discussion ... 24
5.1 Soil Characterization ... 24
5.2 W ater Quality Results ... 27
5.3 PCR Results ... 31
6. Conclusion ... 35
6.1 Findings... 35
R e fe re n ce s ... 3 7
A p p e n d ice s ... 3 9
Appendix A : Soil Characteristics Data... 39
Appendix B: W ater Q uality Data ... 40
Appendix C: Spreadsheet for Determining Amplicons per Gram Soil... 41
LIST OF FIGURES
Figure 1 - Cross section of Balam Estate Rain Garden ... 11Figure 2 - Soil sample and water sample collection depths below ground surface (bgs) ... 17
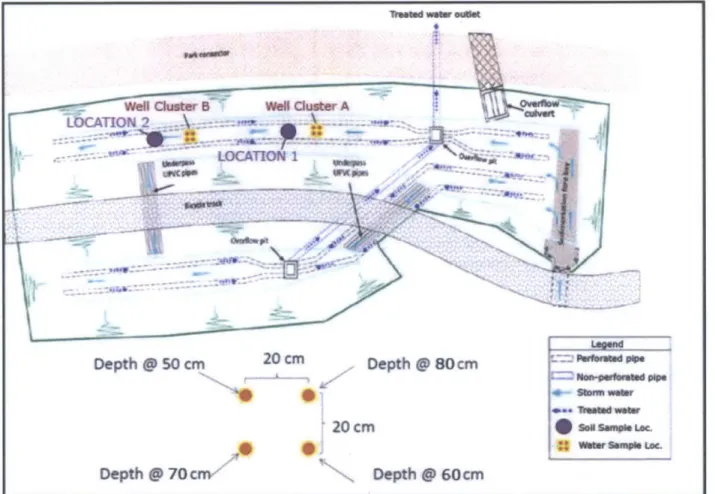
Figure 3 - Groundwater and soil sample collection locations ... 18
Figure 4 - Approximate soil characterization for soil sampling Location 1 and 2 ... 25
Figure 5 - Vertical profile of average total DNA concentrations for Location 1 and 2-measured by UV Spectro photom etry ... 26
Figure 6 - Average nitrogen species concentrations as a function of depth ... 28
Figure 7 - Vertical profiles for oxidation-reduction potential, dissolved oxygen, total phosphorus, and phosphate ... 30
Figure 8 - Gel electrophoresis images of nosZ and 16S rRNA PCR assays. ... 32
Figure 9 - Number of nosZ and 16S rDNA amplicons per milligram of dry soil ... 34
LIST OF TABLES
Table 1 - List of prim ers used for PCR ... 20Table 2 - M aster m ix preparation ... 20
Table 3 - Nitrogen species concentrations with depth ... 27
Table 4 - Oxidation-reduction potential, dissolved oxygen, total phosphorus, and phosphate.. 29
1. INTRODUCTION
1.1 Stormwater Management in Singapore
Until recently in Singapore and other developed nations around the world, the traditional approach to stormwater management has been to rapidly drain runoff from impervious areas in order to reduce flooding risk. Stormwater is often discharged directly to waterways through stormwater piping, which results in reduced groundwater recharge as well as an altered hydrograph observed in downstream channels. The hydrograph for a channel with an urban watershed is characterized by an increased peak flow rate and shorter lag time after rainfall events compared to pre-development conditions. Frequency of discharge increases as well, since small rainfall events contribute runoff that would have been captured by soil and plants. These altered hydrological conditions result in erosion and degraded habitat quality. Urban runoff is also a significant contributor to non-point source pollution, including suspended solids, nutrients, petrochemicals, and trace metals.
Although Singapore receives about 2400 mm of rainfall a year, it has limited natural water resources due to its small land area and lack of an adequate aquifer. Therefore they must utilize water from four "National Taps" which include water imported from Malaysia, desalinated water, reclaimed water, and stormwater runoff retained in reservoirs. The nation has 17 reservoirs which store runoff from two thirds of Singapore's land area (PUB 2011). The most recently constructed reservoir is the Marina Reservoir. Much of the area surrounding the Marina Reservoir is urbanized, which presents a unique challenge to sustainably manage urban stormwater runoff.
Stormwater best management practices (BMPs) can be used to improve the quality of
stormwater runoff and thus surface water downstream. Examples of stormwater BMPs include the use of pervious pavement, rainwater catchment, living roofs, and bioretention swales and basins. The goal of these stormwater management strategies is to intercept rainwater and either use it for a beneficial purpose on site or to slow runoff and treat it before discharging to local waterways. Bioretention systems, for instance, can be installed to collect and treat
stormwater runoff. They are usually constructed to allow for a certain amount of ponding in order to store runoff, and consist of high permeability media such as sand and gravel, planted with vegetation that can tolerate inundation as well as periods of drought. Bioretention systems remove contaminants from stormwater through processes such as filtration,
adsorption, biochemical transformations, and plant and microbial uptake. High rates of removal of contaminants such as suspended solids, metals, and oil have been demonstrated. However, nutrient removal has been variable for different types of bioretention systems, and the
biochemical transformations of nitrogen species are complex and not well understood, necessitating continued research into the performance and ideal design characteristics of stormwater BMPs (Passeport et al. 2009).
1.2 ABC Waters Programme
Under the Active, Beautiful, and Clean Waters Programme (ABC Waters) launched in 2006, Singapore aims to become a "City of Gardens and Water" with a shift to more naturalized waterways and the increased use of stormwater BMPs (PUB 2011). Stormwater BMPs have the benefits of improving water quality and being aesthetically pleasing. With the addition of signage, they can also help to educate and increase public awareness of water quality and conservation issues.
When restoring urban streams to more naturalized conditions, it is very important to consider stormwater management before beginning restoration projects. The quality of urban streams is
highly dependent on the watershed's effective imperviousness, which is the percent of impervious land area which drains directly to streams through storm drains. Attempting to restore short reaches of a stream by improving in-stream habitat and reestablishing riparian vegetation often fails if the watershed continues to have a high effective imperviousness. Therefore it can be more important to first drastically transition to the use of stormwater BMPs to reduce effective imperviousness and return the watershed to more natural conditions
(Walsh et al. 2005).
1.3 Balam Estate Rain Garden
The Balam Estate Rain Garden was constructed in 2008 to collect and treat stormwater runoff from an approximately 6000 m2 area of impervious surfaces at Balam Estate, which includes
high-rise apartment buildings, parking areas, and a roadway (Ong et al. 2012). The rain garden consists of two bioretention cells which are hydraulically connected by pipe. The total rain garden area including vegetated slopes is about 1000 m2 and the area providing water
treatment was designed to be four percent of the collection area, which is 240 M2
.
The rain garden cells contain vertical layers of engineered media including (from the bottom): a 15-cm fine-gravel drainage layer, a 30-cm saturated zone of wood chips and rock media, a 10-cm transition layer of fine sand, and a 40-10-cm layer of sandy loam topped with vegetation (Figure 1). A U-shaped drainage pipe maintains a saturated anoxic zone in the rock-and-wood-chip layer, which is intended to enhance removal of nitrogen by providing the necessary requirements for denitrification, the reduction of nitrate to nitrogen gas by denitrifying bacteria.
During rain events, water ponds at the surface of the rain garden and slowly infiltrates through each layer to the underdrain, which drains the treated effluent to Pelton Canal, subsequently flowing to the Kallang River and then Marina Reservoir. There is an emergency overflow drain for ponding conditions which exceed 20 cm. Inflow exceeding the 20-cm maximum depth flows directly to Pelton Canal via an overflow pit and overflow culvert (Figure 1).
oveflows spoil into field entry pit Al \4. extended detention zone increases volume of stormwater that is captured and treated
K
AIA funcuonal vegetatton wpports nutrient functional vegetatbon supports nutrient removal and maintains porosity of soil IxN 100 mm 400 mm treated flows and overflows to Pelton Canal I gr&.,l dra sand &ardwood (anaerobk mone) sandy loam fier media nage laye sawdust Iiyet slotted dr pipes 410 mrn Iage standpipe drainage pipecleanout Figure 1 -Cross section of Balam Estate Rain Garden (Wang and Ong 2009) ... ... 16,-2. LITERATURE REVIEW
2.1 Nitrogen Cycling and Removal in Balam Estate Rain Garden
Denitrification is a key process in the biogeochemical cycling of nitrogen and an important mechanism for nitrogen removal in the Balam Rain Garden. It is a strategy utilized by
microorganisms in anoxic environments in which nitrate is used as a terminal electron acceptor instead of oxygen for respiration. The products of denitrification are the gaseous nitrogen species N20, NO, and N2. Production and subsequent escape of N2 to the atmosphere
effectively removes nitrogen from the soil environment. The complete reduction of nitrate produces dinitrogen gas (N2) in the steps shown below:
NO NO02-NO-)N 20--N 2
(1)
Each step in this reaction is catalyzed by enzymes: nitrate reductase reduces N03- to N02-,
nitrite reductase reduces NO 2-to NO, nitric oxide reductase reduces NO to N20, and nitrous oxide reductase reduces N20 to N2. Some prokaryotes (bacteria and archaea) can only complete
some of these steps. For instance, E. coli can only complete the nitrate reduction step, producing nitrite (Madigan et al. 2009). Each step is a half-reaction which is coupled with the oxidation of an organic carbon molecule for a complete reduction-oxidation (redox) reaction. The full redox equation for denitrification proceeding all the way to produce N2 is:
1 11 1177
NO + -CH 20O+H+ -N 2 +-CO 2 + - H2O
4 4 5 10 4 20
(2)
Organic carbon serves as the electron donor in this redox reaction, and thus is required for denitrification. Most denitrifying microorganisms are facultative aerobes in the phylum
Proteobacteria (Madigan et al. 2009). Since the reduction of oxygen to water has a higher redox potential, it is more thermodynamically favorable than the reduction of nitrate to nitrite. Thus, facultative aerobes will preferentially use oxygen if it is present. When oxygen is depleted, however, the N0 3-/N2 redox couple is the next most electropositive, at +0.75 V, compared to the 02/H20 redox couple which is +0.82 V (Madigan et al. 2009). This underscores an important
design feature of the Balam Rain Garden in that it contains a saturated anoxic zone (SAZ). In this zone, there may be oxygen present when stormwater first flushes through during a rain event, but oxygen would quickly be consumed by soil bacteria. Diffusion of oxygen back into the subsurface water is a slow process and would likely be counteracted by rapid consumption by bacteria, thus it would be expected that the saturated zone should be anoxic. In the SAZ in the Balam Rain Garden, wood chips serve as the source of organic carbon for denitrification and cell growth.
An additional method of nitrogen removal which may occur in the SAZ of Balam Estate Rain Garden is anaerobic ammonium oxidation (anammox), where ammonium and nitrite are converted to dinitrogen gas as in Equation 3 below. Anammox is a less thermodynamically favorable reaction than denitrification, and requires availability of both ammonium and nitrite. This microbiologically mediated reaction has only recently been discovered, and its relative importance for nitrogen removal in rain gardens is not yet well understood (van de Graaf et al.
1995).
N HI + NO- -+ N> + 2H20
(3)
Incoming stormwater runoff often contains nitrogen in the form of ammonia and organic nitrogen, which first must be converted into nitrate before denitrification can take place. Organic nitrogen is mineralized to ammonia through a biotransformation called
ammonification, which is accomplished by many types of microorganisms in both anoxic and oxic environments (Madigan et al. 2009). The transformation of ammonia to nitrate is done by a more specialized set of bacteria capable of nitrification. Nitrifying bacteria are obligate aerobes requiring oxygen as the terminal electron acceptor for respiration. Ammonium cations are readily adsorbed to negatively charged colloids in the filter media, and as the upper layers of the bioretention cell dry out after a rainfall event, ammonium can be nitrified to nitrate. Nitrate is then leached to the anoxic layer in subsequent storms since it is not usually adsorbed. Unfortunately, if the water drains too quickly, nitrate can be leached out of the rain garden before denitrifying bacteria and archaea can reduce the nitrate to gaseous nitrogen species.
This can lead to variable performance of bioretention systems in terms of nitrogen removal (Chen et al. 2013).
Ong et al. (2012) observed a 64% reduction in the load of total nitrogen from the Balam Estate Rain Garden, through comparison of mass of total nitrogen in influent stormwater and effluent averaged over six storm events. They concluded that this is an adequate level of performance, resulting in a decrease of pollutant loading to surface waters. However, the height of the overflow drain allows only 20 cm of ponding, which has resulted in frequent overflow of incompletely treated stormwater to Pelton Canal. For water infiltrating through the anoxic zone, reductions of nitrate by 73% and nitrite by 60% were observed in the 2013 study by Ritter (2013). In the same study, ammonia was found to increase by about 50% through the anoxic zone and by 290% from the top of the SAZ to the outlet of the rain garden. This may be due to mineralization of organic nitrogen and leaching of adsorbed nitrogen. Despite the increase in ammonia concentrations, total nitrogen concentrations were still observed to decrease by about 50% between the top of the SAZ and the outlet.
2.2 Polymerase Chain Reaction Methods to Assess Abundance of Denitrifying Bacteria
In order to investigate denitrification in bioretention systems, microbial assays can be
performed to determine the abundance of denitrifying bacteria and archaea in the soil. Several methods utilize polymerase chain reaction (PCR) to amplify targeted sections of DNA. In order to perform PCR in the laboratory, DNA is combined with a "master mix" composed of distilled water, a buffer, forward and reverse primers targeting a specific gene, deoxynucleoside triphosphates (dNTP), and a DNA polymerase (Madigan et al. 2009). This mixture then
undergoes the polymerase chain reaction in a thermal cycler. The first step in the thermal cycler is denaturing, which splits the DNA into two strands. The next step is annealing, which allows the short strand primers to attach to single strand DNA. The final step is extension, which is catalyzed by Taq polymerase; it allows the primer to extend using dNTPs as building blocks, creating double-stranded DNA (Madigan et al. 2009). This cycle is repeated 20-40 times, with each cycle doubling the amount of DNA, thus resulting in exponential amplification of the target gene. After PCR, agarose gel electrophoresis is used to visualize the presence or absence
of the targeted gene in a sample. PCR product is placed in wells within an agarose gel plate, and a voltage is applied to separate DNA of different amplicon lengths.
PCR can target functional genes such as genes coding for the production of denitrifying enzymes and PCR-based tests can be used to provide data on the occurrence or relative abundance of these genes in an environmental sample. Primers have been developed for
nitrate reductase (narG), nitrite reductase (nirS and nirK), nitric oxide reductase (norB), and nitrous oxide reductase (nosZ) (Chen et al. 2013). Angnes et al. (2013) observed that abundance
of narG, nirS, and nosZ genes was correlated with release of N2, and abundance of norB and
nosZ was correlated with N20 emissions in the process of swine slurry composting. A study of
denitrification in groundwater below agricultural land found an association between gene copy concentrations of nirS, nirK, and nosZ and dissolved organic carbon but no correlation between
denitrifying gene abundance and emissions of N2 or N20 (Barrett et al. 2013). Chen et al. (2013)
found higher numbers of denitrifying gene copies near the surface of a bioretention cell in Kansas that had long detention times and high amounts of organic carbon at the surface but none amended in deeper layers. The Kansas bioretention system did not contain a saturated anoxic zone, thus denitrification was only occurring during and after storms when the soil was saturated.
In the Balam Estate Rain Garden, denitrification was hypothesized to occur in the saturated anoxic zone (SAZ) due to the conditions which favor this biochemical transformation and the observed reduction of nitrate and total nitrogen through the SAZ. In order to verify that
denitrifying bacteria are present in the SAZ and to assess how their relative abundance changes with depth, PCR was used to detect presence of the nosZ gene in soil samples obtained from the subsurface of the bioretention system.
3. FIELD PROCEDURES
3.1 Subsurface Water Sample Collection
To collect subsurface water samples, PushPoint samplers (MHE Products, East Tawas, MI) were used. These samplers are made of hollow steel tubing of Y4" diameter, with 4 cm of screen at the bottom end to allow groundwater to enter the tubing and flow upwards using a syringe or pump. Eight PushPoint samplers were installed in the field at "Well Cluster A" and "Well Cluster B," with four samplers at each Well Cluster arranged in a square configuration 20 cm apart (Figure 3). At each sampler location, a metal concrete-reinforcing bar (rebar) was first driven into the soil to the desired depth, and the rebar was removed and replaced with a PushPoint sampler, which was left in the field for sampling purposes. This process was repeated at all eight sampler locations.
Subsurface water samples were collected on January 2 3 rd, 2014, a dry day following 10 days of
no rainfall. Sampling water quality during a rain event would have been desirable for this study because water samples could then be obtained for the entire vertical soil profile. However, an adequate rain event did not occur during the field sampling period to allow for sampling during wet conditions. Thus water samples could only be collected from depths below the water table (50 cm below ground surface (bgs) and below). At Well Cluster A, water samples were collected at 60, 70, 80, and 90 cm bgs. At Well Cluster B, water samples were able to be collected from 50 cm bgs as well as 60, 70, 80, and 90 cm bgs (Figure 2). Samples were collected from the
PushPoint samplers through rubber tubing connected to the open end of the PushPoint sampler and using a peristaltic pump and portable generator. The first flush of water was discarded until water ran clear, and then samples were collected in sterile Whirl-Pak* bags (Nasco, Fort Atkinson, WI). Dissolved oxygen (DO) was measured in duplicate on site using a CHEMetrics kit (CHEMetrics, Inc., Midland, VA), and oxidation-reduction potential (ORP) was
measured in triplicate on site using a Myron 6Pfc Utrameter II" (Myron L Company, Carlsbad,
Samples were kept on ice and sent to a commercial chemical analysis laboratory, Setsco Services Pte Ltd., for analysis of total nitrogen, total Kjeldahl nitrogen (TKN), ammonia, nitrate, nitrite, total phosphorus, and inorganic phosphate.
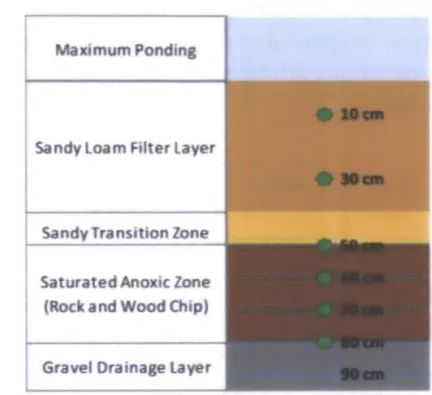
Maximum Ponding
Sandy Loam Filter Layer
Sandy Transition Zone Saturated Anoxic Zone (Rock and Wood Chip)
Gravel Drainage Layer
Figure 2 - Soil sample (green stars) and water sample (blue dashes) collection depths below ground surface (bgs) 3.2 Soil Sample Collection
Soil samples were collected for subsequent microbial analysis in the lab. Two locations were chosen, which were roughly two and a half meters downstream of the push-point sampler
locations as shown in Figure 3. Soil samples were collected using an Oakfield Model S nickel-chrome-plated steel soil auger (Oakfield Apparatus, Fond du Lac, WI) encased in a 40-mm polyvinyl chloride (PVC) pipe. The PVC pipe was used to protect the soil core from mixing with other layers and to increase recovery of soil from the saturated anoxic zone (SAZ) below 50 cm depth. Depth of the soil auger was determined using a meter stick. To collect a sample, the auger was hand-drilled down 10 cm past the targeted soil depth and the auger along with the PVC pipe was extracted. Using a metal spoon, soil samples were gathered from the center of the 20-cm long drill to retrieve soil from the desired depth. Between each sample collection, the PVC pipe, soil auger, and collection spoon were cleaned using deionized water to reduce
cross-contamination. Subsequent soil collections were taken from the previous hole or a new hole was made within half a meter of the original location. Triplicate soil samples were taken at Location 1 and Location 2 from depths of 10, 30, 50, 60, 70, and 80 cm (Figure 2; Figure 3). Sampling was performed during dry conditions on January 8th at Location 1 and on January 1 3th 2014 at Location 2. Samples were collected in sterile Whirl-Pak* bags (Nasco, Fort Atkinson, WI) and kept on ice until transferred to a -20C freezer at Temasek Laboratory on the National University of Singapore campus.
Tfta - .~
Well Cluster B WeR Cluster A
LOCATION 2\
LOCATION I owf4. MR Depth@0cm 20 cm Depth 80 cm 4-0 20cmp Depth @ 60cm Depth @ 70 crry PhOdOe *~Storm. Vwer Trea VWmow= *SONl Spls LOC wo Somf~s Loc.4. LABORATORY METHODS
4.1 Soil Sample Procedure
Soil samples were characterized, weighed and used for DNA extraction. Samples were visually assessed to estimate the proportion of fines, sand, and organic material. Organic material was
defined for this purpose as visible roots and wood chip material. Remaining proportions were estimated to be either sand or fines, with visible grains defined as sand and the remaining fine material defined as fines. Dry weights were found by drying the soil samples in a freeze dryer for 3 days followed by measurement of weight. Deoxyribonucleic acid (DNA) was extracted from the soil samples using a Mo Bio PowerSoil® DNA Isolation Kit (MO BIO Laboratories, Inc,
Carlsbad, CA) according to the manufacturer's instructions. For this protocol, cells are lysed to release DNA through addition of a detergent and mechanical shaking of the mixture in a
PowerBead® tube containing small beads. Humic acids and other inhibitors are removed using a proprietary solution. DNA is then isolated from the solution and eluted with 100 PL of sterile elution buffer. DNA samples were then split into three aliquots of 30 PL for PCR, 30 p.1 as backup, and 40 pL for future use. Making aliquots reduces the number of freeze-thaw cycles, since the DNA degrades each time it is thawed. The 30 pL for PCR was made into stepwise dilutions of IX, 0.5X, and 0.05X concentrations. Total DNA concentration was measured by UV light absorption (260 nm) in triplicate for each 1X concentration sample using a NanoDrop' ND-1000 Spectrophotometer (Thermo Fisher Scientific, Wilmington, DE).
4.2 Polymerase Chain Reaction (PCR)
PCR was used to amplify extracted DNA from the soil samples. Two different genes were targeted, nosZ for detection of denitrifying bacteria, and 16S rRNA for detection of total bacteria. Three dilutions of the template DNA were analyzed with PCR for a semi-quantitative estimation of the relative abundance of bacteria. These dilutions were IX, 0.5X, and 0.05X and were analyzed for nosZ as well as 16S rRNA. Primers used to target nosZ and 16S rRNA were ordered from IDT (Integrated DNA Technologies, Inc., Coralville, IA) and are described in Table 1.
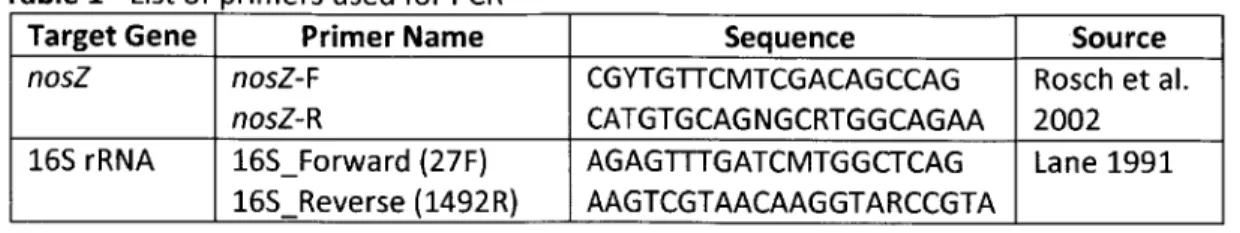
Table 1 - List of primers used for PCR
Target Gene Primer Name Sequence Source
nosZ nosZ-F CGYTGTTCMTCGACAGCCAG Rosch et al.
nosZ-R CATGTGCAGNGCRTGGCAGAA 2002
16S rRNA 16SForward (27F) AGAGTTTGATCMTGGCTCAG Lane 1991
16SReverse (1492R) AAGTCGTAACAAGGTARCCGTA
For each set of reactions, a master mix was prepared using 5X Colorless GoTaq® Flexi Buffer, 25-mM magnesium chloride solution (MgC2), 10-mM deoxynucleoside triphosphates (dNTPs), 10-pM forward and reverse primers, and 5 units per pL GoTaq* G2 Hot Start Polymerase in the amounts shown in Table 2 (Promega Corporation, Madison, WI). This master mix recipe was optimized to provide bright bands at the expected amplicon length of 700 base pairs for nosZ. Optimizing the master mix involved reducing the original concentration of primers and
magnesium chloride to reduce the formation of primer dimers, which occur when primers attach to each other and are amplified rather than the template DNA. Ingredients for the master mix were pipetted into a 1.5-mL tube in the order listed in Table 2. The polymerase was
added last and pipetted gently several times to mix. A volume of 24 PL of the master mix was
then added to PCR tubes, and 1 IL of template DNA from different samples was added to the tubes for individual 25-pL reactions.
Table 2 - Master mix preparation (adapted from Promega 2013)
Component Final Volume (pl) Final Concentration 5X Colorless GoTaq* Flexi Buffer 1 5 1x
MgC2 Solution, 25 mM 1 1.5 1.5 mM (1.0-4.0 mM)
PCR Nucleotide Mix, 10 mM each 0.5 0.2 mM each dNTP Upstream primer, 10 pM 0.625 0.25 pIM (0.1-1.0 M)
Downstream primer, 10 IM 0.625 0.25 ptM (0.1-1.0 pM)
Sterilized deionized water 15.625
GoTaq* G2 Hot Start Polymerase (5u/ptL) 0.125 1.25u Template DNA 1 <0.5 pg per 50 ptL
Reaction volume 25
Thawed completely, and vortexed thoroughly prior to use.
A duplicate sample from 30 cm bgs at Location 1 was used as a positive control, because it gave a clean, bright band at the expected amplicon length of 700 bp for nosZ. This ad hoc positive
control was used in place of DNA from strain Aeromonas MIT189_M3 that was previously identified as containing the nosZ gene (data not shown), but failed to amplify reproducibly during the experimental period. Sterilized deionized water was used as a negative control. A Bio-Rad MyCyclerTM was used for PCR (Bio-Rad Laboratories, Inc., Hercules, CA). Thermal cycling conditions for amplification of nosZ were: an initial cycle of 94"C for two minutes; 30 cycles of 95*C for one minute (denaturing), 56*C for one minute (annealing), and 72'C for two minutes (elongation); and a final elongation cycle of 72"C for ten minutes. Thermal cycling conditions for 165 rRNA were: an initial cycle of 94"C for three minutes; 30 cycles of 94*C for 45 seconds (denaturing), 52*C for 30 seconds (annealing), and 72*C for one and a half minutes (elongation); and a final elongation cycle of 72*C for ten minutes.
4.3 Agarose Gel Electrophoresis
Agarose gel electrophoresis was performed to visualize the results from PCR using a Bio-Rad Wide Mini-Sub Cell GT System (Bio-Rad Laboratories, Inc., Hercules, CA). An agarose gel was prepared by mixing 1.5 g of agarose with 120 mL of 0.5X Tris/Borate/EDTA (TBE) buffer in a glass flask, microwaving for one minute, adding 4 IpL of SYBR* Safe DNA Gel Stain (Life
Technologies Corporation, Carlsbad, CA), and swirling to mix. An excess of TBE buffer was used (120 mL instead of 100 mL) because a significant amount is vaporized in the microwave, so that the final concentration of agarose is around 1.5% (weight/volume). This mixture was poured into a gel plate mold and allowed to set for approximately 15 minutes. Once the gel was firm, it was placed in the electrophoresis cell and covered with 0.5X TBE buffer. Two microliters of
100-bp DNA ladder (New England BioLabs* Inc., Ipswich, MA) was loaded into the first well in the agarose gel when analyzing product with amplified nosZ. For 16S rRNA, 7 IpL of 1-kb DNA ladder
was used (New England BioLabs* Inc., Ipswich, MA).
Five microliters of blue (6X) gel loading dye (New England Biolabs® Inc., Ipswich, MA) was
added to each PCR tube containing PCR product and pipetted up and down to mix. Ten microliters of this mixture of dye and PCR product was then loaded into separate wells in the agarose gel. The gel electrophoresis system was then run for 40-60 minutes at 100 V. Gels were
then put under ultra-violet light and images were captured using a Gel Doc" XR+ Gel Imaging System and Quantity One" software (Bio-Rad Laboratories, Inc., Hercules, CA).
4.4 Estimating Amplified Gene Copies from Dilution PCR
Amplified gene copies were quantified for the nosZ and 16S rRNA assays based on brightness of bands from gel electrophoresis, which is proportional to mass of amplified DNA in the bands. Band brightness was measured using ImageJ software (National Institutes of Health, U.S. Department of Health & Human Services). The program allows for measurement of band intensity and area, the product of which can be compared to a known standard to calculate the mass of DNA in the band. Calculated values for the number of gene copies amplified accounted for amplicon size, dilution, and soil sample weights (Equations 4-6).
The product of mean pixel intensity and band area was compared to the standard to determine mass of DNA amplified per lane. The standard for nosZ was the 700 bp band of the 100 bp ladder used, and the standard for 16S rRNA was the 1500 bp band of the 1 kb ladder used. These values were then used to find the number of amplicons generated per band (Equation 4), using the molecular weight of a base pair (660 g/mol), the number of base pairs per mole (Avogadro constant), and the number of base pairs in the amplicon (700 bp for nosZ). Finally, the number of amplicons per gram of dry soil could be found by taking into account the dry weight of the soil sample, the volume of template DNA used per reaction, and the volume of PCR product loaded into the well plate (Equations 4 and 5).
For the IX dilution, 2 pl& of DNA template was used per reaction, whereas for the 0.05X dilution, 0.1 pL of DNA template was used. The nosZ assay evaluated for the lX dilution, since bands were most visible for each sample at this dilution. For 16S rRNA, band brightness was found from the 0.05X dilution since the bands from this assay were of similar brightness at this dilution to the IX nosZ assay. This was accounted for by the volume of DNA template added in Equation 6. See Appendix C for tabulated calculations with results.
Amplicon molecules per band = 1 mol Mass DNA Amplified (ng) *
660 g
6.02 x 10²³ bp
1 mol
1 g 1 copy
109 ng Amplicon size (bp)
Amplicon molecules per band 25 yL reaction
Amplicons per gram soil = *
8.3 pL PCR product loaded PCR
Where:
Y pL DN A template
X g soil = dry weight soil sample (g) * Y pL DNA elte
100 ML DNA elution 1 PCR X g soil (5) (6) 23 (4)
5. RESULTS AND DISCUSSION
5.1 Soil Characterization
Soil samples were inspected visually during collection as well as during DNA extraction.
Although Balam Rain Garden was initially constructed with 40 cm of sandy loam as the top layer of the bioretention system, high percentages of fines were observed at depths of 10, 30, and 50 cm (Figure 4). The samples from 10 cm bgs were especially clayey, forming ribbons of greater than 2.5 cm. It is suspected that the deposition of fine suspended solids and migration of sands to lower levels over the six years of operation of Balam Rain Garden has significantly altered the
composition of the upper 40 cm from the original condition of loamy sand. Loamy sand is characterized by 70-90% sand, less than 15% clay, and less than 30% silt (Brady and Weil 2010). As determined using the "texture-by-feel" method, the samples from 10 cm bgs were likely closer to a sandy clay loam than a loamy sand.
Soil samples with greater than 70% sand were not observed, thus further investigation of potential clogging of the soil in the upper layers of Balam Rain Garden by fines is suggested. Greatly increased percentage of fines could lead to clogging and reduced hydraulic
conductivity. This would have the effect of reducing retention volume of Balam Rain Garden, leading to more frequent overflows of incompletely treated stormwater flowing directly into Pelton Canal. Vegetation helps to mitigate this issue by increasing porosity and organic content of the soil. In a study comparing bioretention mesocosms, Barrett et al. (2013) observed an initial decrease in hydraulic conductivity which then stabilized to between 2 cm/hr and 50 cm/hr for the different mesocosms. Bioretention systems vegetated with a thicker rooted plant were observed to have a much higher hydraulic conductivity than the mesocosms without vegetation as well as mesocosms with shallow, fine-rooted plants, suggesting that deeply rooted plants create pores in the soil and can maintain sufficient drainage in bioretention systems.
After DNA was extracted from the soil samples, the total DNA concentration of each sample was measured in nanograms of DNA per microliter of template using a NanoDropTM
Spectrophotometer. These values were converted into genome copies per gram of soil (gc/g soil) using an average molecular weight of a base pair (660 g/mol), an estimated average
number of base pairs in a genome (approximately 4x10⁶ bp/genome), and the dry weight of soil
used for DNA extraction (mg/100 pL template).
SOIL CHARACTERISTICS AT LOCATION 1 10 30 U50 ~60 70 80
a % Sand U % Fines U % Organic
U
U
U
U
K
U
SOIL CHARACTERISTICS AT LOCATION 2 10 30 50 j 6 0 70 80U % Sand U % Fines U % Organic
Figure 4 - Approximate soil characterization for soil sampling Location 1 and 2
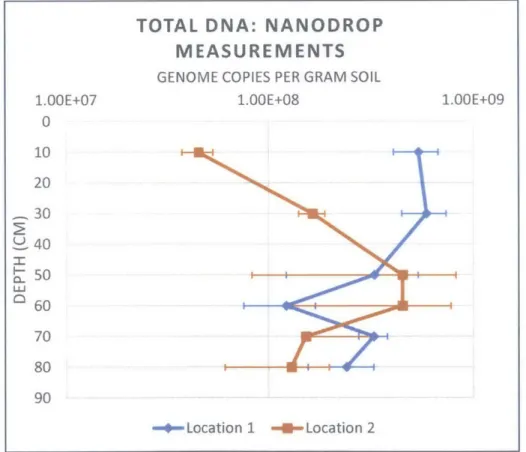
Total DNA concentrations, as measured by NanoDropTM Spectrophotometry, ranged from 0.35
to 3.3 ng/p.L and corresponded to 4x10⁷ to 5x10⁸ gc/g soil. Spectrophotometric
measurement-of low concentrations measurement-of DNA in environmental samples may be subject to high uncertainty (J. Thompson, pers. comm.); therefore the DNA in some samples may be over-estimated. Overall, DNA concentrations, rounded to an order of magnitude, were found to be approximately 108 gc/g soil. Although the contribution to the total DNA pool of partially degraded organic matter is unknown, this concentration is similar to values of total bacterial 16S rRNA gene copies per gram of soil observed in stormwater BMPs. For instance, Chen et al. (2013) observed total 16S
rDNA concentations of between 2.2x10⁷and 6.8x10⁹gc/g soil in a bioretention system in
25
U
U
U
U
U
Kansas. In a separate study using soil samples from varied natural environments, Henry et al. (2006) observed 16S rRNA concentrations on the order of 108 to 1010 gc/g soil.
A vertical profile of DNA concentrations averaged for each sample is shown in Figure 5. The DNA concentrations for the two locations seem to mirror each other, suggesting that either the locations were very different from each other in terms of vertical distribution of soil bacteria, partially degraded organic matter containing DNA, or uncertainty associated with
spectrophotometric measurements of UV absorption in low concentration environmental DNA. The concentrations deviate from each other the most at depths of 10 and 30 cm bgs, with the concentrations at Location 2 much lower at these depths than the concentrations at Location 1 despite observation that the proportion of organic matter (a potential additional source of DNA) at Location 2 was higher than at Location 1 (Figure 4).
TOTAL DNA: NANODROP MEASUREMENTS
GENOME COPIES PER GRAM SOIL
1.OOE+07 1.OOE+08 1.00E+09
0 10 20 ,30 40 50 Lu 60 70 80 90 -*-Location 1 -1-ULocation 2
Figure 5 - Vertical profile of average total DNA concentrations for Location
5.2 Water Quality Results
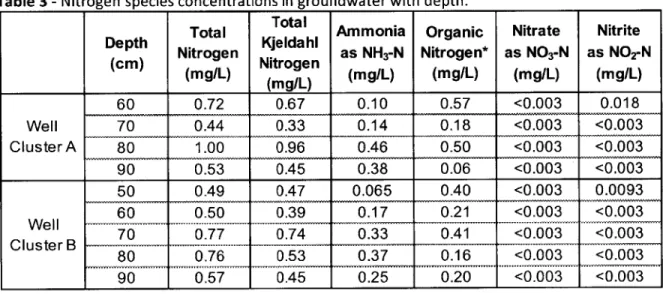
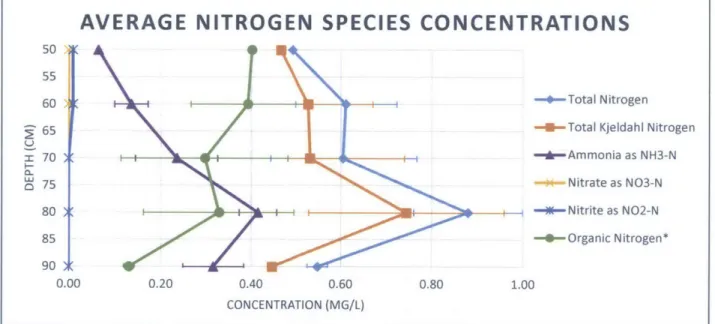
Concentrations of nitrogen species were measured in water samples collected at two different locations (Well Clusters A and B) adjacent to the study sites for biological characterization (Locations 1 and 2). Measured concentrations are shown in Table 3. Average total nitrogen throughout the saturated anoxic zone was 0.64 mg/L, which is significantly lower than influent concentrations of around 1-7 mg/L (Ong et al. 2012; Wang J., pers. comm.). Total nitrogen ranged between 0.49 mg/L and 1.0 mg/L, with a peak observed around 70-80 cm bgs (Table 3). Total nitrogen tended to increase with depth in the saturated anoxic zone to 80 cm bgs and then decline significantly at 90 cm bgs as shown in Figure 6, which conveys vertical profiles of average nitrogen species concentrations.
Table 3 - Nitrogen species concentrations in groundwater with depth.
Total Total Ammonia Organic Nitrate Nitrite Depth Nitrogen Kjeldahl as NH3-N Nitrogen* as N03-N as N02-N
(cm) (mg/L) Nitrogen (mg/L) (mg/L) (mg/L) (mg/L) _____ _ ___ ____ _ ___ ____ (mg/L) _ _ _ ___ _ _ _ 60 0.72 0.67 0.10 0.57 <0.003 0.018 Well 70 0.44 0.33 0.14 0.18 <0.003 <0.003 Cluster A 80 1.00 0.96 0.46 0.50 <0.003 <0.003 90 0.53 0.45 0.38 0.06 <0.003 <0.003 50 0.49 0.47 0.065 0.40 <0.003 0.0093 60 0.50 0.39 0.17 0.21 <0.003 <0.003 Well 70 0.77 0.74 0.33 0.41 <0.003 <0.003 ClusterB 80 0.76 0.53 0.37 0.1 <0.003 <0.003 80 0.76 0.53 0.37 0.16 <0.003 <0.003... 90 0.57 0.45 0.25 0.20 <0.003 <0.003
*Note: organic nitrogen calculated using Equation 7
Nitrate concentrations were below the detection limit of 0.003 mg/L for all samples; and nitrite was below the same detection limit for samples at 70 cm bgs and below for Well Cluster A and 60 cm bgs and below for Well Cluster B. During recent investigations of Balam Rain Garden performance by Wang (Wang J., pers. comm.), influent concentrations of nitrate and nitrite were observed to be around 1-2 mg/L, which suggests that available nitrate or nitrite is
consumed in the saturated anoxic zone (SAZ) during dry periods between rain events. This may be due to the process of denitrification, however it is also possible that nitrate could be
consumed through the process of dissimilative reduction of nitrate to ammonia (DNRA). Due to
the relatively high concentrations of ammonia present in the SAZ, it would be plausible that nitrate is consumed through DNRA, however past studies have concluded this to be a minor process in wetlands and stormwater management systems (Matheson et al. 2002; O'Reilly et al. 2012). Ammonia concentrations in the SAZ ranged from 0.065 mg/L to 0.46 mg/L, with a peak observed around 80 cm bgs (Table 3; Figure 6). Organic nitrogen concentrations were
calculated using Equation 7 below.
Organic Nitrogen g= Total Kjeldahl Nitrogen
(-
- Ammonia--L L (-- L)
(7)
Decreased organic nitrogen concentrations coincided with increased ammonia concentrations, suggesting that ammonification is taking place in the SAZ. Ammonification is the
biotransformation of organic nitrogen into ammonium, which can be accomplished by many microorganisms in both anoxic and oxic conditions (Madigan et al. 2009).
50 55 60 65 70 E 75 80 o 85 90
AVERAGE NITROGEN SPECIES CONCENTRATIONS
-4- Total Nitrof -U-Total Kjelda -r-Ammonia ai Nitrate as N03-N --*-Nitrite as N02-N -4-Organic Nitrogen* 0 0.20 0.40 0.60 0.80 1. CONCENTRATION (MG/L) gen hl Nitrogen
s
H
-Figure 6 - Average nitrogen species concentrations as a function of depth *Note: organic nitrogen calculated using Equation 7
during a dry-weather period.
Dissolved oxygen (DO) concentrations were observed to be high at the top of the SAZ and near anoxic at 70 cm bgs and below. DO was 9.2 mg/L at the 60 cm depth at Well Cluster A, and 7.3
mg/L at 50 cm bgs at Well Cluster B. In Ritter's study of the Balam Estate Rain Garden, subsurface water was found to be 28.5*C in January, which corresponds to a saturation
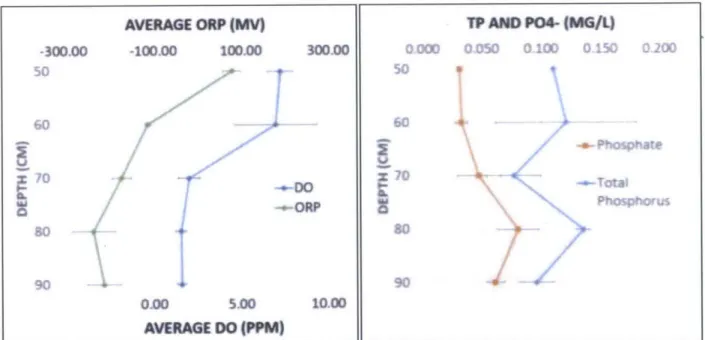
concentration for DO of 7.7 mg/L (Ritter 2013). The observed DO concentrations from the upper regions of the SAZ are thus around or even above saturation (Table 4; Appendix B). It is unlikely that the water from this study was much lower in temperature, and it would have to be lowered to 20*C to have a saturation DO of 9.1 mg/L. Therefore it is likely that there is some introduction of oxygen in the process of pumping the samples to the surface. Turbulent flow and the introduction of tiny bubbles could significantly increase the DO of the water tested. Despite this discrepancy between saturation DO and observed DO from one of the samples, a clear trend is visible with DO near anoxic conditions at 70 cm and below for both water sample locations. Anoxic conditions are defined by the U.S. Geological Survey as 0.5 mg/L or less (USGS 2010), so the samples are not technically classified as anoxic. The measured DO values may be higher than actual subsurface conditions however, as discussed above.
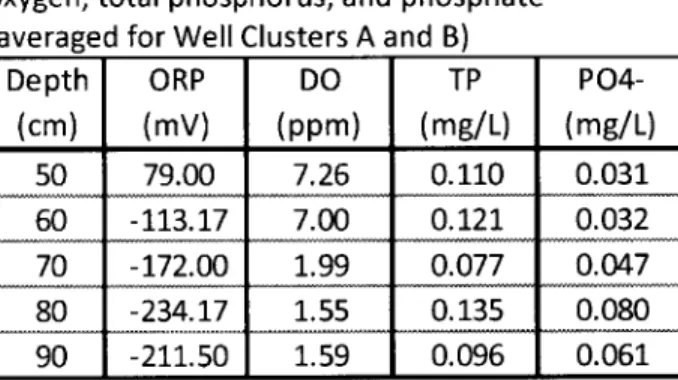
Table 4-Oxidation-reduction potential, dissolved oxygen, total phosphorus, and phosphate (averaged for Well Clusters A and B)
Depth ORP DO TP P04-(cm) (mV) (ppm) (mg/L) (mg/L) 50 79.00 7.26 0.110 0.031 60 -113.17 7.00 0.121 0.032 70 -172.00 1.99 0.077 0.047 80 -234.17 1.55 0.135 0.080 90 -211.50 1.59 0.096 0.061
Oxidation-reduction potential (ORP) was observed to be +79 mV at a depth of 50 cm, which implies that conditions are aerobic at this depth. This may allow obligate aerobes to survive and potentially outcompete denitrifying bacteria. ORP is negative for depths below 60 cm, which indicates reducing conditions that would facilitate anaerobic processes such as denitrification. This reinforces the suspicion that actual DO concentrations were lower than what was
measured. Values for ORP below 60 cm tend to become more negative with depth, producing a more reducing environment at these depths.
Denitrification is the most favorable form of respiratory metabolism at ORP values between +50 and -50 mV, which was not observed in the rain garden for this sampling. When nitrate and
nitrite are consumed in an anoxic environment, bacteria will use other terminal electron
acceptors for respiration, including ferric iron, sulfate, and carbonate (Madigan et al. 2009). Sulfide formation is observed for a range of ORP values of -50 to -250 mV, and the production of methane is observed at -175 to -400 mV (NEIWPCC 2007). Observed values of ORP in the subsurface of Balam Rain Garden were within these ranges, so it is likely that all of these biochemical reactions are occurring in the SAZ. The observed nitrate and nitrite concentrations were below the detection limit for most samples. This suggests that these species have been consumed, lowering the ORP to levels where other forms of anaerobic respiration become thermodynamically favored. In addition, the smell of sulfide was noted during subsurface water
sample collections, which again confirms reliability of the ORP measurements.
ORP values between -100 and -250 mV are associated with phosphorus release, which is undesirable in a bioretention system (NEIWPCC 2007). Phosphate was observed to increase slightly at the 70, 80, and 90 cm depths, where ORP values were observed to be in the phosphate release range of -100 to -250 mV (Figure 7). The maximum total phosphorus concentration observed in the SAZ was 0.14 mg/L, which is above the ABC Waters Design Guidelines' stated stormwater treatment objective of less than 0.08 mg/L in effluent from stormwater BMPs (PUB 2011).
AVERAGE ORP (MV) TP AND P04- (MG/L)
-300.00 -10000 100.00 300.00 * 4 O 4'ORP 904 0100 5.00 10.00 AVERAGE
DO
(PPM)Figure 7 - Vertical profiles for oxidation-reduction potential, dissolved oxygen, total phosphorus, and phosphate
Subsurface water samples were collected on January 23, 2014 during a relatively dry period with less than average rainfall. The previous rain event occurred 11 days prior on January 1 2th
and was approximately 2 cm of rainfall (WU 2014). Thus these data represent conditions in the SAZ between rain events, which would be more likely to facilitate biochemical transformations such as sulfide production. Further investigation of conditions throughout the vertical profile during and immediately after a rain event is recommended.
5.3 PCR Results
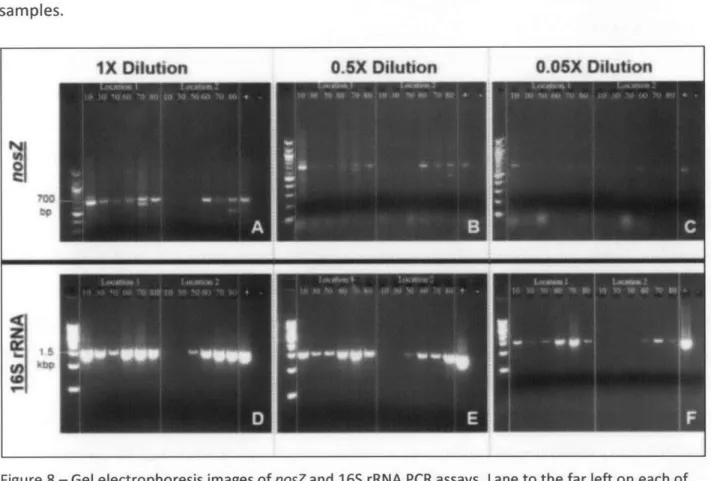
PCR results for nosZ and 16S rRNA at IX, 0.5X, and 0.05X dilutions are shown in Figure 8. These results confirmed the utility of the selected PCR assay for detection of the 700 bp nosZtarget under the PCR conditions described in Section 4.2. For the nosZ assay, bands indicating
detection and PCR amplification of the target were brightest at the expected product length of 700 bp. Some excess bands (less than 100 bp) were observed and were likely caused by primer dimerization. The sample at 10 cm bgs and Location 1 revealed the highest amplification yield (band brightness) for all three dilutions suggesting highest concentrations of nosZ in initial template DNA for this sample, if amplification efficiencies of targets do not vary between samples. For both locations, the samples from the saturated anoxic zone at depths of 60, 70, and 80 cm bgs were the next brightest at each dilution, suggesting higher abundance of the nosZ gene in these samples compared to samples from 30 and 50 cm bgs. Higher
concentrations of denitrifying bacteria were expected in the saturated anoxic zone, and the nosZ PCR assay seems to confirm this. The concentration of nosZ at 10 cm bgs for Location 1 may be relatively high because denitrifying bacteria are facultative aerobes, able to utilize oxygen when it is available. In addition, there may be anoxic micro-zones in the soil at this location, which would give denitrifying bacteria an advantage over obligate aerobes (Lee 1998).
Results for 16S rRNA show a similar pattern of relative brightness for the depth profile at both locations, with the brightest samples from depths of 60, 70, and 80 cm bgs, as well as the 10 cm bgs sample from Location 1. It is suspected that there are favorable conditions at the 10 cm depth, since it is within the root zone and likely contains high concentrations of organic material. This location also had the highest observed percentage of sand of all the samples, suggesting that this soil type might provide a better environment for soil bacteria. Although
dilution PCR is expected to improve amplification of targets by diluting potential inhibitors that reduce the amplification efficiency, substances like humic acids may interfere with the PCR result and lead to the appearance of low or no products. It is expected that 16S rRNA should be amplifiable from all samples due the ubiquitous distribution of bacteria and recovery of DNA from all samples. Lack of an intense 16S rRNA PCR product from 10 cm and 30 cm bgs at Location 2 (Figure 8) suggests that there are inhibiting substances such as humic acids in these samples.
IX Dilution O.SX Dilution 0.0X Dilution
Figure 8 - Gel electrophoresis images of nosZ and 16S rRNA PCR assays. Lane to the far left on each of the six panels (A-F) above corresponds to the molecular weight standard. For panels A-C, the brightest bands in this lane correspond to 1000 bp (top) and 500bp (bottom) and minor bands correspond to 100 bp increments. For panels D-F, the lower band corresponds to 500 bp and each band above
corresponds to increments of 500 bp. For nosZ (A-C) the expected amplification target can be observed at 700bp while for 16S rRNA (D-F) the expected amplification target can be observed at 1500
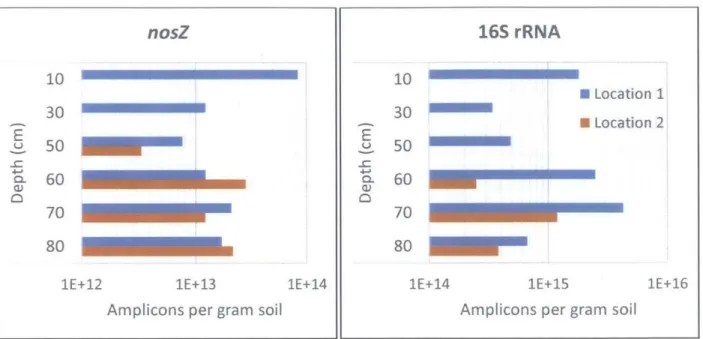
bp.Vertical profiles of nosZ and 16S rRNA amplicons generated per gram of dry soil, as
approximated by the intensity of PCR bands adjusted for template dilution, amplicon size, and sample dry weight are shown in Figure 9. These values were calculated as described in Section
4.4. If amplification efficiencies do not change between samples, these values can be correlated with the relative abundance of targeted gene copies in the DNA template. Number of nosZ amplicons was shown to be slightly higher at 10 cm bgs as well as at 60 cm bgs and below, which support the interpretations based solely on band brightness as discussed above. The value of ORP at 50 cm bgs was observed to be +79 mV, which is above the range at which denitrification is thermodynamically favorable (-50 to +50 mV), whereas the ORP was observed to be below this range at 60 cm bgs and below (Table 5). However, the water quality samples were collected over a week after the soil sample for Location 2 was collected, a timespan during which no rain events occurred. It is probable that the ORP values for 60 cm bgs and
below were within the range of denitrification at the time of soil sampling, since about 2 cm of rain fell on January 12th, the day before soil sample collection, and the influx of fresh rainwater and nutrients would tend to raise ORP. This is reinforced by the higher observed number of amplified nosZ genes at 60 cm bgs and below, as compared to the nosZ amplicons at 30 and 50 cm bgs. Since ORP is high at 50 cm bgs, it is assumed that ORP would be similarly high in pore water at 30 cm bgs, and thus both depths are likely to facilitate aerobic respiration. Fewer denitrifying organisms would be expected at these depths, since they would have to compete for resources with obligate aerobes. A slightly lower number of amplified nosZ gene copies for these depths was observed, confirming the likelihood of conditions which are less favorable for denitrifying bacteria near the top of the SAZ and above due to competition with obligate aerobic microbes.
ORP was observed to be the most negative at 80 cm bgs, which corresponds to fewer 16S rDNA amplicons compared to samples from 60 and 70 cm bgs. It is possible that fewer bacteria can survive at this depth because of the very low ORP, which might necessitate the ability to use alternative terminal electron acceptors such as sulfate, elemental sulfur, ferric iron, and carbon dioxide, since more preferable terminal electron acceptors such as oxygen and nitrate seem to be absent or at very low concentrations around this depth. Many sulfate-reducing bacteria can also utilize nitrate as a terminal electron acceptor, reducing it to ammonia, which could help to
explain the peak in ammonia concentrations observed at 80 cm bgs (Madigan et al. 2009).
nosZ
10 30 50 60 70W 80 1E+12 1E+13Amplicons per gram soil 1E+14 16S rRNA E U 10 30 50 60 70 * Location 1 * Location 2 80 M 1E+14 1E+15
Amplicons per gram soil
1E+16
Figure 9 - Number of nosZ and 16S rDNA amplicons per gram of dry soil, based on dilution PCR band brightness, amplicon size, and sample dry weight shown for both soil collection locations. Note: Samples from Location 2 at 50 cm bgs and above were inhibited for the 0.05X dilution (16S rRNA) and at 30 cm bgs and above for the 1X dilution (nosZ).
E CL ai)
6. CONCLUSION
6.1 Findings
This study was an initial investigation into the bacterial community and nitrogen cycling in Balam Estate Rain Garden. Denitrifying bacteria, as evidenced by PCR amplification of the nosZ gene, were detected throughout the soil column of the rain garden at two locations. Relative PCR band intensity suggested higher concentrations of denitrifying bacteria in the root zone of the bioretention system and at 60 cm bgs and below in the saturated anoxic zone, although these results should be confirmed by quantitative PCR in follow up work. Nitrate and nitrite were observed to be at levels below the detection limit in the SAZ during the dry period of subsurface water quality sampling, indicating high rates of nitrate and nitrite removal over long detention times.
Levels of ammonia and phosphorus are of concern, however, since these appear to increase in the SAZ. Ammonia is likely produced through mineralization of organic matter, which could be a problem because even low concentrations of ammonia are toxic to fish (EPA 2013). Phosphate is released from precipitates at low oxidation-reduction potentials. It is of concern because phosphorus is usually the limiting nutrient in fresh surface waters and could lead to algal
blooms and subsequent hypoxic conditions in downstream water bodies such as the Kallang Basin and Marina Reservoir.
6.2 Recommendations for Future Work
Suggested future work includes the investigation of other biochemical transformations of nitrogen, such as anaerobic ammonium oxidation, dissimilative nitrate reduction to ammonium, nitrification, and ammonification. Soil bacteria could also be assessed at different areas of the rain garden to determine if abundance of target bacteria varies with distance from the inlet or for different plant and soil conditions.
Additional subsurface water quality data for wet and dry conditions along with relative abundance of nitrogen cycling bacteria for different moisture conditions could help to
illuminate the dynamics of soil bacteria in Balam Rain Garden and inform construction of future
BMP bioretention systems. Phosphorus and ammonia release should also be monitored in order to determine if the saturated anoxic zone is consistently producing these contaminants. This investigation provided the first direct evidence that denitrifying bacteria are present within the Balam Estate Rain Garden and suggests that the distribution of these bacteria may vary with depth and ORP. The methods employed herein were semi-quantitative and thus future studies should employ quantitative PCR (either digital or real-time QPCR) to explore how the distribution of denitrifying bacteria varies with depth and ORP during dry and wet conditions.
REFERENCES
Angnes, G., Nicoloso, R. S., da Silva, M. L. B., de Oliveira, P. a V, Higarashi, M. M., Mezzari, M. P., and Miller, P. R. M. (2013). "Correlating denitrifying catabolic genes with N20 and N2 emissions from swine slurry composting." Bioresource Technology, Elsevier Ltd, 140, 368-75.
Barrett, M., Jahangir, M. M. R., Lee, C., Smith, C. J., Bhreathnach, N., Collins, G., Richards, K. G., and O'Flaherty, V. (2013). "Abundance of denitrification genes under different peizometer depths in four Irish agricultural groundwater sites." Environmental Science and Pollution Research
International, 20(9), 6646-57.
Brady, N.C. and Weil, R.R. (2010). Elements of the Nature and Properties of Soils, 3rd Edition. Pearson
Education, Inc., New Jersey.
Chen, X., Peltier, E., Sturm, B. S. M., and Young, C. B. (2013). "Nitrogen removal and nitrifying and denitrifying bacteria quantification in a stormwater bioretention system." Water Research, Elsevier
Ltd, 47(4), 1691-700.
EPA. (2013). "Aquatic Life Ambient Water Quality Criteria for Ammonia - Freshwater 2013." United States Environmental Protection Agency. April 2013
van de Graaf, A.A., Mulder, A., de Bruijn, P., Jetten, M.S., Robertson, L.A., and Kuenen, J.G. (1995). "Anaerobic oxidation of ammonium is a biologically mediated process." Applied Environmental
Microbiology, 61(4), 1246-1251.
Henry, S., Bru, D., Stres, B., Hallet, S., and Philippot, L. (2006). "Quantitative Detection of the nosZ Gene, Encoding Nitrous Oxide Reductase, and Comparison of the Abundances of 16S rRNA, narG, nirK,
and nosZ Genes in Soils." Applied and Environmental Microbiology, 72(8), 5181-5189.
Lane, D.J. (1991). "16S/23S rRNA Sequencing." In E. Stackebrandt and M. Goodfellow (ed.), Nucleic Acid
Techniques in Bacterial Systematics, John Wiley & Sons, Chichester, England, pp. 115-175.
Lee, M.D., Odom, J.M., and Buchanan Jr., R.J. (1998). "New Perspectives on Microbial Dehalogenation of Chlorinated Solvents: Insights from the Field." Annual Review of Microbiology, 52, 423-52.
Madigan, M. T., Martinko, J. M., Dunlap, P. V., and Clark, D. P. (2009). Brock Biology of Microorganisms, 1 2th Edition. Pearson Education, Inc., San Francisco.
Matheson, F.E., Nguyen, M.L., Cooper, A.B., Burt, T.P., and Bull, D.C. (2002). "Fate of 15N-Nitrate in Unplanted, Planted and Harvested Riparian Wetland Soil Microcosms." Ecological Engineering, 19(4), 249-264.
NEIWPCC. (2007). "Oxidation-Reduction Potential and Wastewater Treatment." New England Interstate Water Pollution Control Commission - Interstate Water Report, Winter 2007.
<http://www.neiwpcc.org/iwr/reductionpotential.asp>. (April 18, 2014).
Ong, G. S., Kalyanaraman, G., Wong, K. L., and Wong, T. H. F. (2012). "Monitoring Singapore's First Bioretention System : Rain Garden at Balam Estate." Public Utilities Board, Singapore.
O'Reilly, A.M., Wanielista, M.P., Chang, N.B., Harris, W.G., and Xuan, Z. (2012). "Soil Property Control of Biogeochemical Processes beneath Two Subtropical Stormwater Infiltration Basins." Journal of
Environmental Quality, 41, 564-581.
Passeport, E., Hunt, W.F., Line, D.E., Smith, R.A., and Brown, R.A. (2009). "Field Study of the Ability of Two Grassed Bioretention Cells to Reduce Storm-Water Runoff Pollution." Journal of Irrigation and
Drainage Engineering, 135, 505-510.
Promega. (2013). "GoTaq* G2 Hot Start Polymerase Information." Promega Corporation.
PUB. (2011). "ABC Waters Design Guidelines." Public Utilities Board, Singapore.
Ritter, H. (2013). "Nitrogen Chemistry in an Urban Bioretention System in Singapore." Massachusetts Institute of Technology.
R6sch, C., Mergel, A., Bothe, H., and Ro, C. (2002). "Biodiversity of Denitrifying and Dinitrogen-Fixing
Bacteria in an Acid Forest Soil Biodiversity of Denitrifying and Dinitrogen-Fixing Bacteria in an Acid Forest Soil." Applied and Environmental Microbiology, 68(8), 3818-3829.
USGS. (2010). "Anoxic Definitions Page." United States Geological Survey.
<http://toxics.usgs.gov/definitions/anoxic.html>. (April 24, 2014).
Walsh, C.J., Fletcher, T.D., and Ladson, A.R. (2005). "Stream Restoration in Urban Catchments through Redesigning Stormwater Systems: Looking to the Catchment to Save the Stream." Societyfor
Freshwater Science, 24(3), 690-705.
Wang, J., and Ong, G. S. (2009). "Design , Construction and Monitoring Singapore ' s First Bioretention
Systems ABC Waters Framework for Stormwater Management." 6th International Water Sensitive
Urban Design Conference and Hydropolis #3. Perth.
WU. (2014). "Weather History for Singapore, Singapore." Weather Underground.
<http://www.wunderground.com/history/airport/WSSS/2014/1/11/MonthlyHistory.html#calendar