HAL Id: inserm-00678124
https://www.hal.inserm.fr/inserm-00678124
Submitted on 12 Mar 2012HAL is a multi-disciplinary open access archive for the deposit and dissemination of sci-entific research documents, whether they are pub-lished or not. The documents may come from teaching and research institutions in France or
L’archive ouverte pluridisciplinaire HAL, est destinée au dépôt et à la diffusion de documents scientifiques de niveau recherche, publiés ou non, émanant des établissements d’enseignement et de recherche français ou étrangers, des laboratoires
Assessment of qualitative and quantitative features in
coronary artery MRA
Jérôme Velut, Pierre-Axel Lentz, Dominique Boulmier, Jean-Louis Coatrieux,
Christine Toumoulin
To cite this version:
Jérôme Velut, Pierre-Axel Lentz, Dominique Boulmier, Jean-Louis Coatrieux, Christine Toumoulin. Assessment of qualitative and quantitative features in coronary artery MRA. Innovation and Research in BioMedical engineering, Elsevier Masson, 2011, 32 (4), pp.229-242. �10.1016/j.irbm.2011.05.002�. �inserm-00678124�
Assessment of qualitative and quantitative features in
coronary artery MRA
´
Evaluation de caract´eristiques qualitatives et
quantitatives en angiographie IRM des art`eres
coronaires
J´erˆome Veluta,b, Pierre-Axel Lentzc, Dominique Boulmierc, Jean-Louis
Coatrieuxa,b, Christine Toumoulina,b
aLTSI, Universit´e de Rennes 1, Campus de Beaulieu, Bˆat 22, Rennes, F-35042 Cedex bINSERM, U642, Rennes, F-35000, France
cCHU Pontchaillou, Service de Radiologie, Rennes, F-35000
Abstract
In this paper, an analysis of the coronary trees using Magnetic Resonance Angiography (MRA) is performed. The objective is to estimate how much MRA is capable to provide insights into the vascular network. A qualitative exploration of the MRA volumes with anatomical labelling by experts is first performed, Quantitative vessel features are then manually extracted providing a ground truth which is further compared to a semi-automatic extraction. This evaluation is carried out on 10 datasets of the SSFP MRA sequence and allows getting a more precise view on the current state-of-the-art as well as on future achievements to be done.
R´esum´e
Nous proposons une analyse des art`eres coronaires en angiographie IRM.
L’objectif est d’estimer la profondeur `a laquelle l’angio-IRM peut conduire
en premier lieu. Une quantification de certaines caract´eristiques des vaisseaux
sont extraites manuellement, pour servir de v´erit´e de terrain dans le cadre
d’une ´evaluation pr´eliminaire d’une m´ethode d’extraction semi-automatique.
Cette ´evaluation, qui porte sur 10 volumes de cœur entier obtenus partir de
la s´equence SSFP, apporte un ´eclaircissement sur l’´etat de l’art ainsi que sur
les progr`es envisageables.
Key words: Coronary artery, MRI, Labelling, Extraction
Mots-cl´es: Art`eres coronaires, IRM, ´etiquetage, extraction
1. Introduction
According to the recent heart disease and stroke statistics update, “death rates from cardiovascular disease (CVD) have declined, yet the burden of di-sease remains high” [1]. Efforts made until now have proven profitable for western countries, where CVD are known as the leading cause of death. Ho-wever, an earlier and better diagnostic of coronary artery diseases (CAD) based on the advances made in imaging modalities leads to a significant de-crease of mortality [2, 3]. Moreover, new therapies that rely on cardiac veins extraction, like biventricular pacing, known as cardiac resynchronization the-rapy (CRT), open also new perspectives for patient care [4]. In both cases, imaging sources play an important role as it enables to detect and charac-terize potential pathological patterns and to elaborate sound planning for therapy and efficient patient followup [5]. They provide relevant anatomical knowledge of the human heart vasculatures (either morphometric [6, 7], struc-tural [8, 9] or both [10]) which can be confronted to patient-specific data in a therapeutic or surgical decisional process. Despite the high resolution of the
X-Ray angiography, the gold standard for coronary analysis, and the many attempts in reconstruction from few views [11, 12, 13], other techniques are increasingly being used in clinical protocols : Multidetector Computed To-mography (MDCT), Electron Beam Computed ToTo-mography (EBCT) and Magnetic Resonance Angiography (MRA) [14, 15].
MRA is of interest for several reasons : (1) no ionizing radiation is used, (2) improved assessment of aneurysms and CAD are expected, and (3) MR imaging provides acquisition sequences that allow focusing on different ana-tomical or physiological characteristics. Recent works show that MRA could discriminate significant (> 50%) from non-significant stenosis [16] and is a reliable imaging method for anatomy assessment before a surgical inter-vention [17]. However, they do not report yet precise quantitative features. The state-of-art of MR sequences used for clinical studies are those based on steady-state free precession (SSFP) technique [18, 19]. Whole-heart ac-quisition makes the image analysis less operator dependent by including the vessels up to distal vascular parts in a single volume. Used in conjonction with navigators, it is possible to image a whole heart without β—blockers, without contrast agent and in a free-breathing fashion. These points are of importance when diagnostic is performed on symptomatic patients.
A meta-analysis of CAD diagnostic performance of coronary MRA [20] reports a moderately high sensitivity for detecting proximal stenoses but notes that distal segments can not be evaluated. The clinical study conducted in [21] on congenital heart disease diagnostic based on SSFP MR Imaging focuses therefore on proximal segments.
in terms of visual exploration and manual extraction of vascular structures by expert ? (2) what difficulties and performance can be anticipated for semi-automatic quantitation ?
10 whole-heart coronary artery SSFP MRA have been studied. The da-tasets are first described (2) and then qualitatively analysed (Section 3.2). Furthermore, a quantitative study, expert-based, is carried out in order to as-sess patient and inter-patient the variability of different features (Section 3.3). A preliminary comparison of the manual extractions with an existing semi-automatic centreline tracking algorithm is then presented in Section 4 and allows concluding on factual benefits and future challenge of whole-heart coronary artery imaging.
2. Technical and anatomical background 2.1. Datasets
The 10 datasets were acquired on a 1.5T system (Philips Intera and Achieva) using a steady-state free precession (SSFP) MR sequence [18], at end-diastolic phase without contrast agent. The MR sequence parameters are summarized in table 1. Table 2 shows different characteristics of the MRA volumes. The field of view corresponds to the whole acquired volume, while the VOI is the volume of the bounding box comprising the visible coronary vasculature. The intensity range is measured inside the VOI. All the volume have the same in-plane resolution, being 512 × 512 isotropic pixels of size 0.59 mm whereas the interslice distance and the number of slices vary.
Parameters TR 4.04 − 4.75ms TE 2.01 − 2.38ms Flip angle 70.00 − 90.00 Pixel size 0.5 − 0.7mm Matrix size 512 × 512 Slice distance 0.7 − 0.9mm Number of slices 100 − 170
Tab. 1: MR sequence parameters
Volume Slices distance (mm) Number of slices Field of view (cm3) VOI (cm3) Intensity range 1 0.85 159 12163.5 761.3 0 − 673 2 0.9 109 8829 721.5 0 − 740 3 0.8 149 10728 828.5 0 − 627 4 0.85 139 10633.5 542.8 0 − 949 5 0.8 139 10008 790.8 0 − 588 6 0.85 139 10633.5 724.1 0 − 671 7 0.75 169 11407.5 789.2 0 − 611 8 0.85 129 9868.5 478.6 0 − 560 9 0.85 139 10633.5 880.1 0 − 542 10 0.85 139 10633.5 353.3 0 − 1054
Segment Map location Acronym 1 Proximal right coronary artery conduit segment RCA(p) 2 Mid-right coronary artery conduit segment RCA(m) 3 Distal-right coronary artery conduit segment RCA(d) 4 Right posterior descending artery segment RPD 5 Right posterior atrioventricular segment RPA 6 First right posterolateral segment RPL(1) 7 Second right posterolateral segment RPL(2) 8 Third right posterolateral segment RPL(3) 9 Posterior descending septal perforators segment PDS
10 Acute marginal segment(s) RCA-AM
Tab. 3: Right coronary artery map correspondence.
2.2. Anatomical considerations
In the following and for the whole paper, anatomical nomenclature is based on the classification established by the American Heart Association [22]. Figure 1 shows the anatomical segments and their corresponding names depicted in tables 3 and 4. For clarity purpose, and because some distal segments have never been evaluated in the litterature, we propose reader-friendly acronyms in the remaining of the paper.
3. Labelization and manual extraction
Existing studies, even recent, on whole-heart coronary MRA lack of in-depth qualitative and quantitative analysis. In this section, we present the result of the manual extraction of the coronary arterial trees from the 10 datasets. The anatomical nomenclature and the labelling performed in
colla-Segment Map location Acronym
11 Left main coronary artery segment LM
12 Proximal LAD artery segment LAD(p)
13 Mid-LAD artery segment LAD(m)
14 Distal LAD artery segment LAD(d)
15(a) (Lateral) first diagonal branch segment DIAG(1) 16(a) (Lateral) second diagonal branch segment DIAG(2)
17 LAD septal perforator segments LASP
18 Proximal circumflex artery segment CX(p) 19(a) Mid (distal)-circumflex artery segment CX(md) 20(a) (Lateral) first obtuse marginal branch segment OBTM(1) 21(a) (Lateral) second obtuse marginal branch segment OBTM(2) 22(a) (Lateral) third obtuse marginal branch segment OBTM(3)
23 Circumflex artery AV groove continuation segment CX(g) 24 First left posterolateral branch segment LPL(1) 25 Second left posterolateral branch segment LPL(2) 26 Third left posterolateral branch segment LPL(3) 27 Left posterolateral descending artery segment LPD 28(a) (Lateral) ramus intermedius segment RIS 29(a) (Lateral) third diagonal branch segment DIAG(3)
boration with a radiologist and a cardiologist are confronted. Finally, some basic vessel features (length, diameter and image intensity) are quantified and results discussed.
3.1. Coronary arterial trees extraction procedure 3.1.1. Rough manual centreline extraction
The manual extractions have been performed by interactively pointing inside the vessels on the axial slices of the volumes. The resulting curves having a non-uniform sampling, a slight smoothing was applied based on a decimation/refinement procedure.
Decimation The manually-extracted curves are evenly resampled along a cardinal spline interpolating the initial point set. Sampling step is 3 mm long.
Refining The decimated curve is then resampled along a cardinal spline but with a 1 mm sampling step.
Figure 2 shows the ten arterial trees obtained from this interactive procedure. By slicing the MR dataset orthogonally to the curves, it is possible to carry out a straightened reformation of the arteries. A volume rendering of such a reformation is depicted in figure 3. This view is based on the Straightened Curved Planar Reformation (Sa-CPR) described in [23].
3.1.2. Centreline correction
A centreline correction, similar to the one presented in [24], is performed to ensure an accurate localization of the vessel centre. The main drawback of an axial-exclusive slice pointing is that the center of a vessel is not reliabily located when the vessel runs tangentially to the axial plane. It may lead to an
inaccurate location of the centreline for a non-negligible length of coronary arteries (eg RCA 3rd segment, posterio- and atrio-ventricular segments). To deal with this issue, the consideration that slicing axially the Sa-CPR is equivalent to slicing orthogonally along the vessel allows us to point trustfully the center of the vessel at each Sa-CPR axial slice. A corrected centerline is then produced, as shown in figure 4.
3.1.3. Radius estimation
This corrected centreline is used as a reference for the local radius mea-surement along the vessels. This radius is estimated on each Sa-CPR axial slice by pointing the upper north point of the vessel. Figure 5 shows a re-construction of the vascular structure through a radial-variant tube centered on the corrected centreline.
3.2. Coronary arterial tree labelling
Figures 6-8 display several labeled slices (a) from the coronary artery MRA dataset #2. An approximate location of the slice plane is given on a schematic view of the heart (b). The arterial segments that can be seen on the slices are represented as sharp on the coronary artery map, the non visible vessels being blurred (c). Figure 2 illustrates the manual extraction of the coronary arteries from the ten datasets. The extracted segments are reported in tables 5 and 6. This analysis demonstrates the merits of MR imaging for coronary arteries. The whole proximal and medial segments have been extracted, and even the distal locations for the most part of the datasets. However, whereas these merits are obvious in the case of a global coronary anatomy exploration, we are interested in the following in assessing the MR
Dataset 1 2 3 4 5 6 7 8 9 10 RCA(p) E E E E E E E E E E RCA(m) E E E E E E E E E E RCA(d) E E E E E E E E E E RPD E E E . E E E . E . RPA E E E E E E E . E E RPL(1) . E E . E . . . . . PDS . . . E . . . . RCA-AM . E . . . E . E
Tab. 5: Summary of extracted RCA segments. E stands for “extracted”.
modality for quantification purposes. 3.3. Quantitative analysis
The characteristics presented in this work are : (i) the length of each coronary arterial segments, as well as their estimated radii, according to the manually extracted and corrected centreline ; (ii) the image intensity probed along the corrected centreline.
3.3.1. Extracted length
Figure 9 shows the mean length of each coronary artery segment. No surprisingly, the proximal to medial segments have a length close to those reported in [25] when they exist. The relative error is due to the anatomical variations between subjects. For distal segments, no reliable comparison can be made due to the fact that they are far to be entirely extracted.
Dataset 1 2 3 4 5 6 7 8 9 10 LM E E E E E E E E E E LAD(p) E E E E E E E E E E LAD(m) . E E E E E E E E E LAD(d) . E E . E E E . . E DIAG(1) E E E . E E E E . . DIAG(2) . . . E . . DIAG(3) . . . E E . . . CX(p) E E E E E E E E E E CX(md) E E E E E E E E E E OBTM(1) . E . . E . . . E . OBTM(2) . . . . E . . . . .
3.3.2. Estimated radii
As the radius is expected to decrease along a vessel, the result is presented through a simple linear regression. Figure 10 depicts the manually-pointed data and the corresponding regression line. The regression slope is negative (−4.33E − 03), that confirms the general decreasing trend expected along a vessel. Results over the whole database and for each segment are summarized in table 7. The whole database presents a slowly-decreasing radius along the arterial segments, except for CX-2 and LAD-3. The difficulty to reliably point the vessel wall can explain this low quality radius estimation. Furthermore, the radius is highly varying along the vessels. The absolute Pearson
correla-tion coefficient |r| is adequatly lower than√3/2, meaning that the dispersion
around the regression line prevents a correct radius prediction. The low MRA vessel contrast and the inherent difficulties to keep a 3D continuity through 2D manual analysis explain the observed errors.
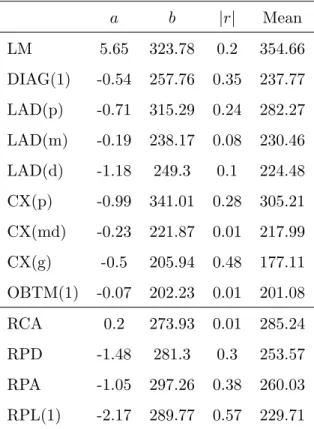
3.3.3. Intensity measurement
An analysis of the intensity profiles along the coronary arteries has been performed. Figure 11 shows such a profile along the RCA of the volume #1. It can be observed that local variations are important. The simple regression line is also drawn on the chart. The results for each segment is displayed (slope a, y-intercept b, absolute correlation coefficient |r| and mean) in table 8. Although the slope of the regression lines are closed to zero reflecting an almost-constant intensity at centreline, the correlation coefficients show in most cases significant variations.
Indeed, not only the intensity is highly-varying along the vessels but as the figure 12 shows, major differences appear between different datasets, with
a b |r| Mean (mm) LM -5.75e-2 2.08 0.44 1.76 DIAG(1) -5.72e-3 1.37 0.41 1.11 LAD(p) -4.07e-3 1.49 0.25 1.33 LAD(m) -3.47e-4 1.1 0.01 1.14 LAD(d) 8.41e-4 1.23 0.01 1.23 CX(p) -3.99e-3 1.36 0.27 1.22 CX(md) 1.94e-3 1.12 0.11 1.19 CX(g) -1.82e-3 1.19 0.26 1.08 OBTM(1) -2.07e-2 1.38 0.71 1.01 RCA(pmd) -3.21e-3 1.78 0.3 1.58 RPD -8.50e-3 1.23 0.32 1.1 RPA -6.02e-3 1.31 0.32 1.14 RPL(1) -3.91e-3 1.3 0.3 1.15
Tab. 7: Linear regression over local estimated radius along each segment. Regression line slope is a, y-intercept is b and Pearson coefficient is r.
a b |r| Mean LM 5.65 323.78 0.2 354.66 DIAG(1) -0.54 257.76 0.35 237.77 LAD(p) -0.71 315.29 0.24 282.27 LAD(m) -0.19 238.17 0.08 230.46 LAD(d) -1.18 249.3 0.1 224.48 CX(p) -0.99 341.01 0.28 305.21 CX(md) -0.23 221.87 0.01 217.99 CX(g) -0.5 205.94 0.48 177.11 OBTM(1) -0.07 202.23 0.01 201.08 RCA 0.2 273.93 0.01 285.24 RPD -1.48 281.3 0.3 253.57 RPA -1.05 297.26 0.38 260.03 RPL(1) -2.17 289.77 0.57 229.71
Tab. 8: Linear regression over intensity measurement along each segment. Regression line slope is a, y-intercept is b and Pearson coefficient is r.
mean intensities along the whole trees ranging from 186 to 469. It emphases the need for normalized intensities, such as it was proposed in [26].
3.4. Discussion
The qualitative analysis of coronary arterial tree extraction using whole-heart SSFP MRA points out that the main segments, up to distal parts, are unambiguously localized and labeled. Proximal diagonal segments have been also identified on seven of the 10 datasets. A number of marginal and septal segments were extracted.
This quantitative analysis that aimed to extract the lengths, local radii and local intensities along the arterial centrelines leads to mixed results. The extracted lengths confirm the qualitative analysis with figures closed to anatomical references and variabilities, but the local radius estimations and intensity measurements do not provide enough reliability for diagnosis or interventional planning.
Furthermore, the manual extraction of the coronary tree is highly time-consuming and is not applicable in clinical routine. A reliable estimation of the radius requires to point more than the only upper points of the vessel lumen.
These findings support the need for automatic or at least semi-automatic methods. They should avoid intra- and inter-operator biases and fasten the extraction process. The challenging points concern :
1. The low vessel spatial resolution : 4-voxels diameter for proximal main segment, down to 1-voxel diameter for distal segments
2. The high intensity variability along a vessel, making threshold-based method setting tedious
3. The high intensity inter-patient variability
4. the loss of signal due to either pathology or artifacts (motion, suscep-tibility,...)
5. The proximity of bright structures (veins, ventricles)
In the next section, we apply an existing semi-automatic method and compare the results with those obtained manually.
4. Preliminar testing of a semi-automatic segmentation method 4.1. State-of-the art methods
Most basic tools designed so far have been mainly applied to X-ray mo-dalities and are based on intensity thresholding [27]. They are daily used as part of scanner marketed software packages including 3D volume rende-ring functionnalities. The vessel intensities being highly variable inside and along a vessel, thresholding can not be considered as reliable. Smarter seg-mentation methods are based on region growing (RG) [28]. For the same reasons of heterogeneity, a RG algorithm cannot extract the whole vascular tree without many expert interactions. Other methods rely on the tube-like structure as a prior knowledge. A joint fast-marching/level set method is proposed in [29] which offers the capability to build a vascular tree thanks to a minimal path technique. In [30], 3D geometrical moments were used to get the center and the principal axis of a vessel that feeds a spatial tracking algorithm. Geometrical moments and level-set methods have been combined in [31]. An artificial life-based method is also reported in [32] and a mathe-matical morphology approach is described in [33]. One can refer to [34] for a review on vessel extraction methods.
Although these segmentation methods show promising results, they have been mainly tested on X-Ray angiography or MDCT modalities. In the follo-wing, we assess a modified geometrical moment-based tracking method inte-grating multiple hypothesis testing and regularization (MH-GMT) [35] and we compare its performance to the manual extraction carried out above, considered here as ground truth.
4.2. Extraction results
Briefly speaking (more algorithmic details can be found in [35]), the
geometrical moment-based tracking methods are designed to extract a 3D curve from a volume, following a particular feature. As geometrical moment are able to compute the local orientation of a cylinder from image intensities, it is well-suited for vessel centreline extraction. The tracking starts from a seed point and iteratively builds a curve from the estimated orientations until a stopping criterion is reached. The idea behind the multiple hypotheses framework is to automatically browse the parameters of the algorithm (eg. moment kernel size, stopping criterion,...) to extract multiple centrelines and then select the best one.
The bunch of candidate centrelines is shown figure 13 for the 10 arterial trees together with the seed point locations. Each centreline is the output of the algorithm for one state of the parameter set.
4.3. Distance definition for quality measurement
In the following, we use the concepts of overdetection and underdetection
to assess the quality of the extracted arterial tree. Let TS be the tree obtained
and q a point from TR, we define the overdetection distance as :
∀p ∈ TS, ODp = min
q∈TR
(||pq||) (1)
This measure allows detecting points that belong to the semi-automatically
extracted tree TS but do not belong to the reference tree. Figure 14(a) shows
the overdetection distance (OD) for each point and the histogram in fi-gure 14(c) points out that the majority of the points are less than 2mm far from the reference. Only 3% of points may correspond to false positive detections.
The symmetric measure of (1) is the underdetection distance, able to
detect vessels from TR that cannot be find in TS and defined as :
∀q ∈ TR, U Dq = min
p∈TS
(||pq||) (2)
The visualization of U D for each reference point (figure 14(b) underlines the
missing segments in TS. However, the histogram (figure 14(d)) shows that
77% of the points from TR are less than 2mm far from TS. 15% of points
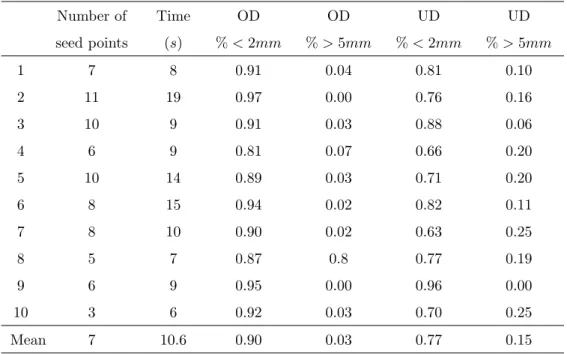
are farther than 5mm, which may be lowered by adding few seed points. These results are summarized in table 9 for each dataset, where over- and underdetection are presented as the number of points with OD and U D less than 2mm in percent. The rates of correspondance are relatively high between the semi-automatic extraction and the ground truth. It can be seen that the number of seed points remains reasonable with respect to the interaction time required to the user. The computation time is also compatible with the clinical constraints.
Number of seed points Time (s) OD % < 2mm OD % > 5mm UD % < 2mm UD % > 5mm 1 7 8 0.91 0.04 0.81 0.10 2 11 19 0.97 0.00 0.76 0.16 3 10 9 0.91 0.03 0.88 0.06 4 6 9 0.81 0.07 0.66 0.20 5 10 14 0.89 0.03 0.71 0.20 6 8 15 0.94 0.02 0.82 0.11 7 8 10 0.90 0.02 0.63 0.25 8 5 7 0.87 0.8 0.77 0.19 9 6 9 0.95 0.00 0.96 0.00 10 3 6 0.92 0.03 0.70 0.25 Mean 7 10.6 0.90 0.03 0.77 0.15 Tab. 9: Summary of the semi-automatic coronary artery centreline extraction.
5. Conclusion
Cardiac imaging is now able to provide 3D static data sets but also 3D image sequences and open new perspectives for diagnosis and image guided interventions. In this context, MR imaging is very attractive and has been widely investigated for coronary vessel analysis. With SSFP MR sequence, a whole heart volume can be acquired in a free breath fashion in less than 15 minutes, thus improving the patients comfort.
We have shown that an unambiguous labeling of large parts of coronary arteries can be achieved. To our knowledge, such a proof of the potential of MR imaging for coronary analysis is lacking at this depth. A global coronary anatomy can thus be reconstructed, bringing useful information for inter-ventional planning. However, the coronary tree is built from many points
manually placed in the volume, requiring too much interaction and time for a clinical use.
A semi-automatic extraction method has therefore been applied. It is based on geometrical moments and outputs the central axes of the vessels. Results are promising as the labeled vessels are retrieved thanks to only 13 seed points on average. Therefore, for qualitative applications on coronary anatomy, MR leads to a performance comparable to MDCT [36] without using any contrast product.
Improvements however are necessary. They will come first from the MR imaging (new acquisition sequences, contrast agents, etc.) where continuous advances are observed. They will also come from advances of detection and segmentation algorithms with lower time computation, higher robustness and reduced interaction. The quantification of patient-specific coronary features is required to reach a better diagnosis and to help in planning the interventions such as CRT as far as the the coronary sinus and the whole left venous tree is also extracted. The competition between imaging modalities and especially MDCT and MRA is a factor of progress that will help in such objectives.
6. Acknowledgements
The research leading to these results has received funding from the Euro-pean Community’s Seventh Framework Programme (FP7/2007-2013) under grant agreement n˚224495 (euHeart project). We are also grateful toward Olivier Ecabert and Juergen Weese from Philips Research Aachen for provi-ding the MRA data sets.
7. References
R´ef´erences
[1] D. Lloyd-Jones, R. Adams, M. Carnethon, G. D. Simone, T. B. Ferguson, K. Flegal, E. Ford, K. Furie, A. Go, K. Greenlund, N. Haase, S. Hail-pern, M. Ho, V. Howard, B. Kissela, S. Kittner, D. Lackland, L. Lisa-beth, A. Marelli, M. McDermott, J. Meigs, D. Mozaffarian, G. Nichol, C. O’Donnell, V. Roger, W. Rosamond, R. Sacco, P. Sorlie, R. Stafford, J. Steinberger, T. Thom, S. Wasserthiel-Smoller, N. Wong, J. Wylie-Rosett, Y. Hong, A. H. A. S. Committee, S. S. Subcommittee, Heart disease and stroke statistics – 2009 update : a report from the American Heart Association Statistics Committee and Stroke Statistics Subcom-mittee., Circulation 119 (3) (2009) 480–486.
[2] X. Bi, D. Li, Coronary arteries at 3.0 T : Contrast-enhanced magnetization-prepared three-dimensional breathhold MR angiography., J Magn Reson Imaging 21 (2) (2005) 133–139.
[3] F. Renard, Y. Yang, Coronary artery extraction and analysis for detec-tion of soft plaques in MDCT images, in : Proc. 15th IEEE Internadetec-tional Conference on Image Processing ICIP 2008, 2008, pp. 2248–2251. [4] J. C. Daubert, C. Leclercq, E. Donal, P. Mabo, Cardiac
resynchroni-sation therapy in heart failure : Current status, Heart Fail Rev 11 (2) (2006) 147–154.
[5] K. Rioual, E. Unanua, S. Laguitton, M. Garreau, D. Boulmier, P. Hai-gron, C. Leclercq, J.-L. Coatrieux, MSCT labelling for pre-operative
planning in cardiac resynchronization therapy, Comput Med Imaging Graph 29 (6) (2005) 431–439.
[6] J. T. Dodge, B. G. Brown, E. L. Bolson, H. T. Dodge, Intrathoracic spatial location of specified coronary segments on the normal human heart. Applications in quantitative arteriography, assessment of regional risk and contraction, and anatomic display., Circulation 78 (5 Pt 1) (1988) 1167–1180.
[7] J. T. Dodge, B. G. Brown, E. L. Bolson, H. T. Dodge, Lumen diameter of normal human coronary arteries. Influence of age, sex, anatomic va-riation, and left ventricular hypertrophy or dilation., Circulation 86 (1) (1992) 232–246.
[8] C. Chalopin, G. Finet, I. E. Magnin, Modeling the 3D coronary tree for labeling purposes., Med Image Anal 5 (4) (2001) 301–315.
[9] M. Garreau, J. L. Coatrieux, R. Collorec, C. Chardenon, A knowledge-based approach for 3-D reconstruction and labeling of vascular networks from biplane angiographic projections., IEEE Trans Med Imaging 10 (2) (1991) 122–131.
[10] C. Lorenz, J. von Berg, A comprehensive shape model of the heart., Med Image Anal 10 (4) (2006) 657–670.
[11] A. Bousse, J. Zhou, G. Yang, J.-J. Bellanger, C. Toumoulin, Motion Compensated Tomography Reconstruction of Coronary Arteries in Ro-tational Angiography 56 (4) (2009) 1254–1257.
[12] J. Zhou, A. Bousse, G. Yang, J.-J. Bellanger, L. Luo, C. Toumoulin, J.-L. Coatrieux, A blob-based tomographic reconstruction of 3D coro-nary trees from rotational x-ray angiography, Vol. 6913, SPIE, 2008, p. 69132N.
[13] G. Schoonenberg, A. Neubauer, M. Grass, Three-Dimensional Coronary Visualization, Part 2 : 3D Reconstruction, Cardiology Clinics 27 (3) (2009) 453 – 465.
[14] N. R. V. de Veire, J. D. Schuijf, G. B. Bleeker, M. J. Schalij, J. J. Bax, Magnetic resonance imaging and computed tomography in assessing car-diac veins and scar tissue., Europace 10 Suppl 3 (2008) 110–113.
[15] W. Y. Kim, P. G. Danias, M. Stuber, S. D. Flamm, S. Plein, E. Nagel, S. E. Langerak, O. M. Weber, E. M. Pedersen, M. Schmidt, R. M. Bot-nar, W. J. Manning, Coronary magnetic resonance angiography for the detection of coronary stenoses., N Engl J Med 345 (26) (2001) 1863– 1869.
[16] M. Stuber, R. G. Weiss, Coronary magnetic resonance angiography., J Magn Reson Imaging 26 (2) (2007) 219–234.
[17] H. Sakuma, Y. Ichikawa, N. Suzawa, T. Hirano, K. Makino, N. Koyama, M. V. Cauteren, K. Takeda, Assessment of coronary arteries with total study time of less than 30 minutes by using whole-heart coronary MR angiography., Radiology 237 (1) (2005) 316–321.
[18] B. Giorgi, S. Dymarkowski, F. Maes, M. Kouwenhoven, J. Bogaert, Improved Visualization of Coronary Arteries Using a New
Three-Dimensional Submillimeter MR Coronary Angiography Sequence with Balanced Gradients, Am. J. Roentgenol. 179 (4) (2002) 901–910. [19] M. Ozgun, A. Hoffmeier, M. Kouwenhoven, R. M. Botnar, M. Stuber,
H. H. Scheld, W. J. Manning, W. Heindel, D. Maintz, Comparison of 3D Segmented Gradient-Echo and Steady-State Free Precession Coro-nary MRI Sequences in Patients with CoroCoro-nary Artery Disease, Am. J. Roentgenol. 185 (1) (2005) 103–109.
[20] P. G. Danias, A. Roussakis, J. P. A. Ioannidis, Diagnostic performance of coronary magnetic resonance angiography as compared against conven-tional X-ray angiography : a meta-analysis., J Am Coll Cardiol 44 (9) (2004) 1867–1876.
[21] P. Beerbaum, S. Sarikouch, K.-T. Laser, G. Greil, W. Burchert, H. Krpe-rich, Coronary anomalies assessed by whole-heart isotropic 3D magnetic resonance imaging for cardiac morphology in congenital heart disease., J Magn Reson Imaging 29 (2) (2009) 320–327.
[22] P. J. Scanlon, D. P. Faxon, A. M. Audet, B. Carabello, G. J. Dehmer, K. A. Eagle, R. D. Legako, D. F. Leon, J. A. Murray, S. E. Nissen, C. J. Pepine, R. M. Watson, J. L. Ritchie, R. J. Gibbons, M. D. Cheit-lin, T. J. Gardner, A. Garson, R. O. Russell, T. J. Ryan, S. C. Smith, ACC/AHA guidelines for coronary angiography. A report of the Ame-rican College of Cardiology/AmeAme-rican Heart Association Task Force on practice guidelines (Committee on Coronary Angiography). Developed in collaboration with the Society for Cardiac Angiography and Interven-tions., J Am Coll Cardiol.
[23] A. Kanitsar, D. Fleischmann, R. Wegenkittl, P. Felkel, E. Groller, CPR - curved planar reformation, in : Proc. IEEE Visualization VIS 2002, 2002, pp. 37–44.
[24] M. Schaap, C. T. Metz, T. van Walsum, A. G. van der Giessen, A. C. Weustink, N. R. Mollet, C. Bauer, H. Bogunovi, C. Castro, X. Deng, E. Dikici, T. O’Donnell, M. Frenay, O. Friman, M. H. Hoyos, P. H. Kits-laar, K. Krissian, C. Khnel, M. A. Luengo-Oroz, M. Orkisz, O. Smedby, M. Styner, A. Szymczak, H. Tek, C. Wang, S. K. Warfield, S. Zambal, Y. Zhang, G. P. Krestin, W. J. Niessen, Standardized evaluation metho-dology and reference database for evaluating coronary artery centerline extraction algorithms., Med Image Anal 13 (5) (2009) 701–714.
[25] C. Christids, C. Cabrol, Anatomie des art`eres coronaires du coeur, J. B.
Bailliere, 1976.
[26] O. M. Weber, S. Pujadas, A. J. Martin, C. B. Higgins, Free-breathing, three-dimensional coronary artery magnetic resonance angiography : comparison of sequences., J Magn Reson Imaging 20 (3) (2004) 395– 402.
[27] U. J. Schoepf, CT of the heart : principles and applications, Humana Press, Totowa, N.J, 2005.
[28] T. Boskamp, D. Rinck, F. Link, B. Kmmerlen, G. Stamm, P. Milden-berger, New vessel analysis tool for morphometric quantification and vi-sualization of vessels in CT and MR imaging data sets., Radiographics 24 (1) (2004) 287–297.
[29] L. D. Cohen, T. Deschamps, Segmentation of 3D tubular objects with adaptive front propagation and minimal tree extraction for 3D medical imaging, Comput Methods Biomech Biomed Engin 10 (4) (2007) 289– 305.
[30] C. Boldak, C. Toumoulin, J. L. Coatrieux, 3D segmentation and charac-terization of lower limb vessels in multi-slice computed tomography, in : Proc. 25th Annual International Conference of the IEEE Engineering in Medicine and Biology Society, Vol. 1, 2003, pp. 580–583 Vol.1.
[31] A. Bousse, C. Boldak, C. Toumoulin, G. Yang, S. Laguitton, D. Boul-mier, Coronary extraction and characterization in multi-detector com-puted tomography, ITBM-RBM 27 (5-6) (2006) 217 – 226.
[32] C. McIntosh, G. Hamarneh, Vessel Crawlers : 3D Physically-based De-formable Organisms for Vasculature Segmentation and Analysis, in : Proc. IEEE Computer Society Conference on Computer Vision and Pat-tern Recognition, Vol. 1, 2006, pp. 1084–1091.
[33] B. Bouraoui, C. Ronse, J. Baruthio, N. Passat, P. Germain, Fully au-tomatic 3D segmentation of coronary arteries based on mathematical morphology, in : Proc. 5th IEEE International Symposium on Biomedi-cal Imaging : From Nano to Macro ISBI 2008, 2008, pp. 1059–1062. [34] D. Lesage, E. D. Angelini, I. Bloch, G. Funka-Lea, A review of 3D
ves-sel lumen segmentation techniques : Models, features and extraction schemes., Med Image Anal.
[35] J. Velut, C. Toumoulin, J.-L. Coatrieux, 3D coronary structure tracking algorithm with regularization and multiple hypotheses in MRI, in : ISBI, 2010, pp. 37–40.
[36] A. Larralde, C. Boldak, M. Garreau, C. Toumoulin, D. Boulmier, Y. Rol-land, Evaluation of a 3D Segmentation Software for the Coronary Cha-racterization in Multi-slice Computed Tomography, in : Functional Ima-ging and Modeling of the Heart, 2003, pp. 39–51.
1 2 3 11 18 19 19a 14 12 13 a a a a a a 4 5 9 6 7 8 23 24 25 26 27 29 16 15 28 20 21 10 a 22 17
Fig. 1: Coronary artery map as proposed by the AHA [22]. A correspondance between figures and segment names is given in tables 3 and 4.
(a) Dataset #1 (b) Dataset #2 (c) Dataset #3
(d) Dataset #4 (e) Dataset #5 (f) Dataset #6
(g) Dataset #7 (h) Dataset #8 (i) Dataset #9
(j) Dataset #10
Fig. 2: Coronal views of ten coronary arterial trees manually extracted from MRA and the image intensity probed along the vessels.
Fig. 3: Straightened Curved Planar Reformation of the 1st, 2nd and 3rd RCA segments. MIP (Maximum Intensity Projection) visualisation.
(a) Labels
cc Patrick J. Lynch, 2006
Descending aorta Ascending aorta
Left atria
Left ventricle
(b) Approximate slice po-sition 11 18 13 a a 15 20 (c) Visible segments
(a) Labels
cc Patrick J. Lynch, 2006
Descending aorta Ascending aorta
Left atria
Left ventricle
(b) Approximate slice po-sition
(c) Visible segments
(a) Labels
cc Patrick J. Lynch, 2006
Descending aorta Ascending aorta
Left atria
Left ventricle
(b) Approximate slice po-sition
(c) Visible segments
RCA RPD RPA LAD CX 0 20 40 60 80 100 120 140 160 180 Mean length (mm)
Mean length and standard deviation of main coronary artery segments MRA extraction Reference
0 50 100 150 200 Vessel length (mm) 0.5 1.0 1.5 2.0 2.5 3.0 3.5 Radius (mm)
RCA radius estimation
Radius regression
0 50 100 150 200 Vessel length (mm) 0 50 100 150 200 250 300 350 Intensity Intensity profile Intensity regression
Fig. 11: Intensity measurement along the RCA(p), RCA(m) and RCA(d) segment centre-lines
1 2 3 4 5 6 7 8 9 10 Dataset 0 100 200 300 400 500 Mean intensity
Fig. 12: Mean intensity along the coronary artery centreline for each dataset. Bars are gray-colored according to the intensity.
(a) Dataset #1 (b) Dataset #2 (c) Dataset #3
(d) Dataset #4 (e) Dataset #5 (f) Dataset #6
(g) Dataset #7 (h) Dataset #8 (i) Dataset #9
(j) Dataset #10
Fig. 13: Coronal view of the ten arterial tree obtained with MH-GMT method. Red spheres depict the seed points locations.
(a) Overdetection (b) Underdetection 0 2 4 6 8 10 Distance 0.0 0.1 0.2 0.3 0.4 0.5 0.6 0.7 0.8 % of points Overdetection histogram (c) Histogram of OD distances 0 2 4 6 8 10 Distance 0.0 0.1 0.2 0.3 0.4 0.5 0.6 0.7 0.8 % of points Underdetection histogram (d) Histogram of U D distances
Fig. 14: A quality assessment through over- and under-detection. The last bin in the histograms cumulates the number of points with distance greater or equal than 9mm.


![Fig. 1: Coronary artery map as proposed by the AHA [22]. A correspondance between figures and segment names is given in tables 3 and 4.](https://thumb-eu.123doks.com/thumbv2/123doknet/14651280.551597/30.918.283.633.415.704/coronary-artery-proposed-correspondance-figures-segment-names-tables.webp)

